I was just interviewed by Mike Swanson of www.wallstreetwindow.com in which we discussed our outlook for the stock market and gold.
You can get on Mike’s free list and see a little bit of what he offers by going here.
You can also download the mp3 audio file for this interview on your computer by clicking hereWITH A RIGHT BUTTON CLICK and selecting SAVE FILE AS from the drop down menu.
Trading with the trend should be your main focus for long term success no matter what type of trader you are (Options Trader, Stock Trader, or ETF Trader) although it’s not as easy as it sounds.
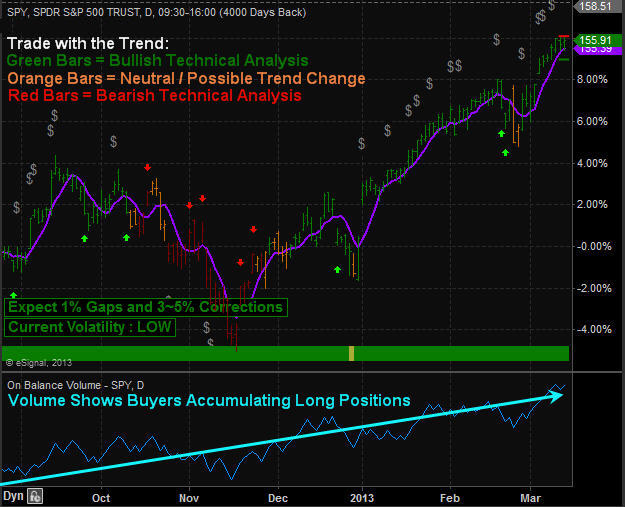
The good news is that there is a simple trading model that removes 95% of trading analysis and greatly reduces trading related emotions because the key technical analysis rules based on one of the world’s best chart technicians (John Murphy) technical analysis methods have been applied to the chart automatically. The key is to identify the trend of the market. Once that is known you can focus on trading strategies that take advantage of the current trend.
Over the past few years I have been creating this indicator/chart layout tool which converts my chart reading experience, tips and tricks into a simple system removing analysis paralysis which cause most individuals to second guess what they see and don’t pull the trigger. Using too many indicators or read/listening several other traders commentaries with different views than you causes this paralysis.
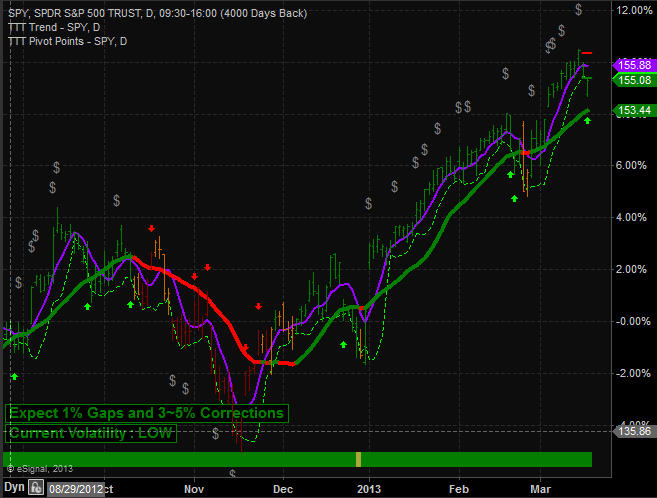
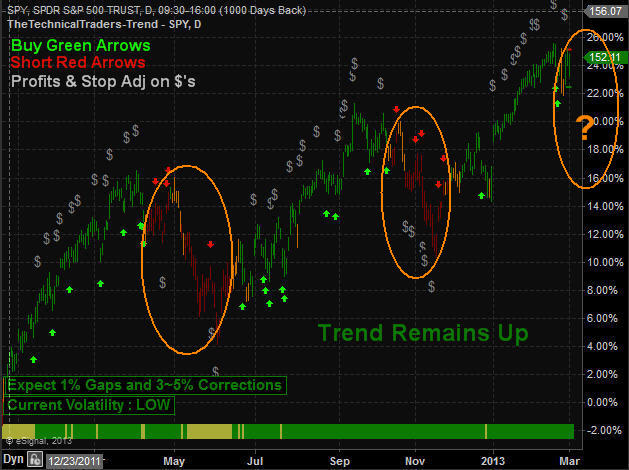
My simple red light, green light model clearly shows a viewer the current trend and expected price range (high and low) looking forward a couple days. I uses a series of data points like volatility, volume, cycles, momentum, chart patterns and logic rules. It even shows extreme pivot points helping you find low risk entry prices for both bull and bear market conditions.
Recent trends and signals for the SP500 Index Daily Chart:
Trading With the Trend – The Sweet Spots
Knowing the direction of the market is simple using the chart system above but trading with the trend is not that simple because of natural human behavior. Instead traders fall victim to trying to pick a top or bottom because they think the price is overbought or oversold and they want to catch the next big trend change.
We all know the saying “the market climbs a wall of worry”. Well, the biggest worry most traders have is buying long in a bull market because stocks and price always look overbought and ready to top each week… This leads to people trying to get fancy picking a top only to get their head handed to them a few days or weeks later depending on how stubborn they are to exit a losing position.
The key to long term success is to buy during broad market (SP500) corrections once sentiment, cycles and momentum are starting to flash extreme oversold conditions. These show up as green arrows on the trend chart. At that point most sectors and high beta stocks like IBM, GOOG etc… should be at a key entry points with most of the downside risk removed already. Remember ¾ stocks follow the broad market so it only makes sense to follow it also.
What about a runaway stock market? This is when the stock market does not pullback but just keep grinding its way higher and higher… The only thing you can do is sit in cash, or look for a stock or sector that is having a small pause or pullback and get long with a small position until you get that broad market pullback and major by signal to add more.
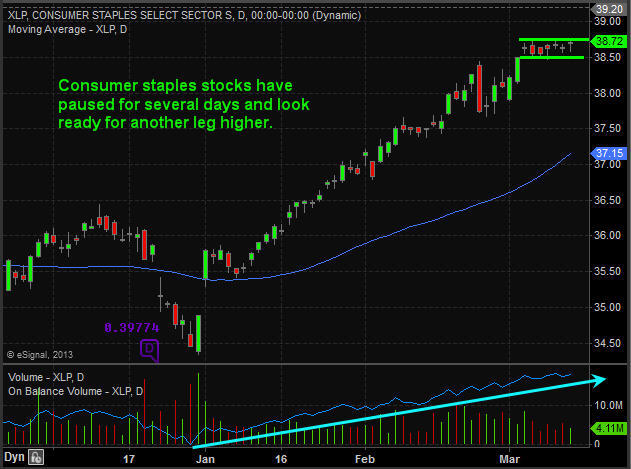
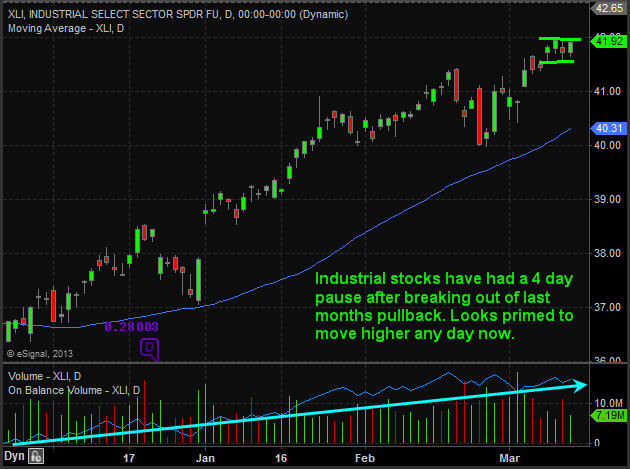
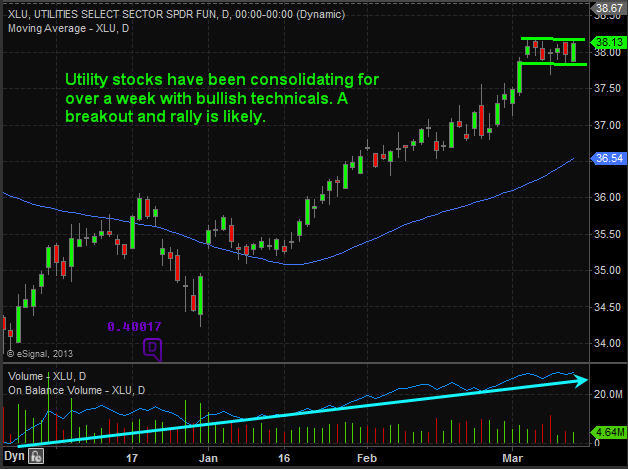
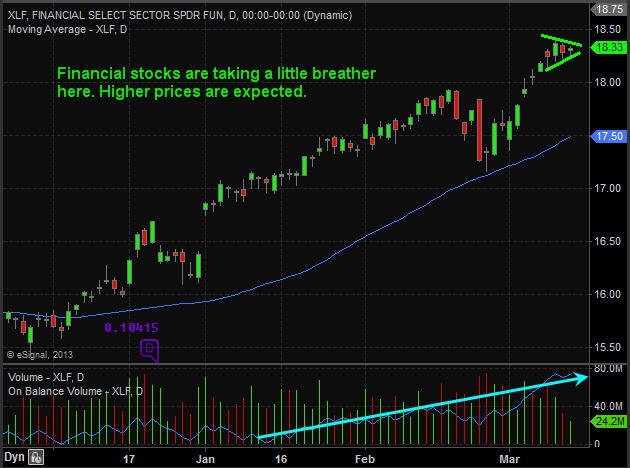
Below are a few sectors showing a minor pause/pullback within this bull market.
Mid-Week Trend Conclusion:
Overall, the broad market remains in an uptrend. While I would like to see the SP500 pullback and give us another major buy signal like it did in December and February I do mind that much if prices keep running higher as it just give us more cushion and potential profits for when the trend does eventually roll over and flip signals. I hope you found this report interesting. It’s just scratching the surface of this topic but it’s a start.
Silver and silver mining stocks are front and center for investors and active traders. Because of silvers high volatility (large price swings) it naturally attracts a lot of attention.
First you have seasoned investors who are waiting for the right opportunity to get long or short for the next move. Then you have the active traders playing the day to day price swings. Finally you get the gamblers who are salivating over the potential to double their accounts and are riding the commodity on pure emotions (Fear & Greed). All these things compound the volatility for the investment making it headline news and what everyone wants to be involved in.
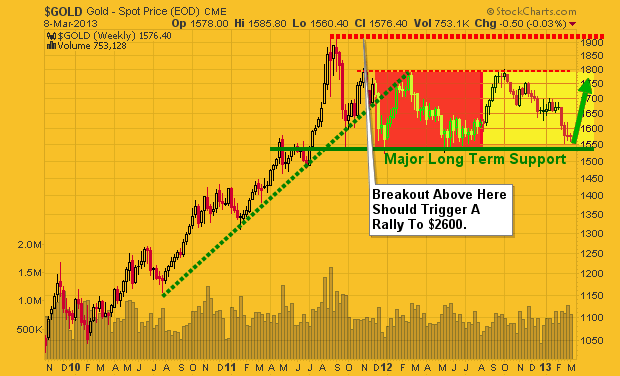
The focus of this report is show you where the price of gold, silver and miner stocks are currently trading and what to lookout for in the coming days/weeks. Below is a chart of gold but silver has a similar pattern and will follow or should I say lead the price of gold in percentage terms because of its volatility.
Gold Weekly Chart:
Gold has been testing its long term support level for three weeks. I expect we see price start to move quickly sooner than later but there is potential for it to tread water here until the second half of April. We all know the saying “Sell in May and Go Away” and as we get closer to that date we should start to see money flow into the “Safe Havens” being gold, silver, and miners. While this has not happened many times on the charts I am thinking beyond them and of what the masses are likely to flock to when stocks lose their luster.
Also if you have been following the price of the dollar index you know that its getting a little overbought and when it starts to correct the falling dollar should help send precious metals higher.
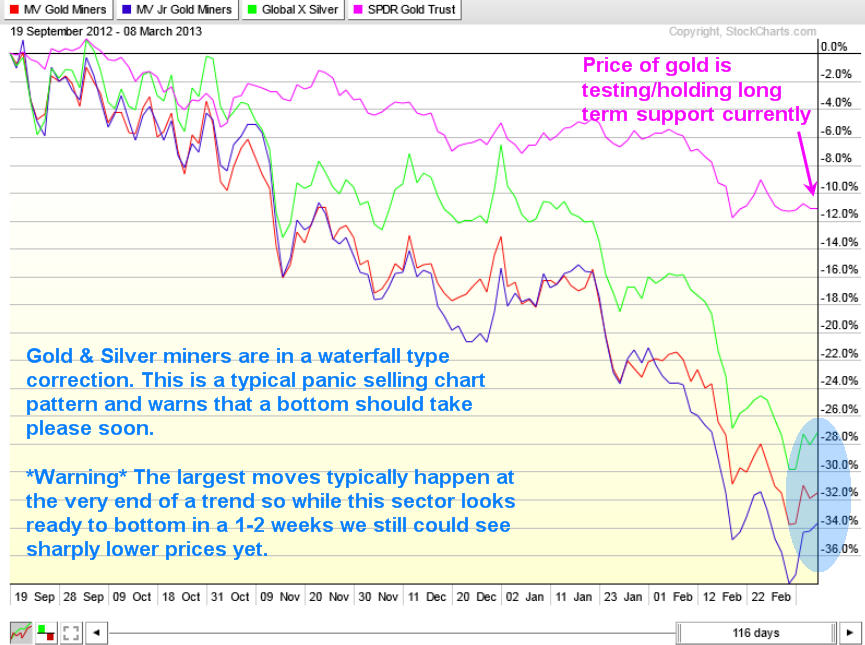
Gold & Silver Miners VS Gold Bullion Performance:
The stock market has certain chart patterns that tell chart readers what the holders of that particular investment is feeling emotionally. Knowing how to read these extreme patterns can yield some big gains and works for most investments types (stocks, bonds, commodities and currencies).
Without getting into the boring technical details precious metal stocks are starting show signs of panic selling which typically happens before a major bottom is put in place. A bottom generally takes a week or two for some type of bottoming pattern or base building to form. This is the most volatile time to be trading these investments so trade with caution.
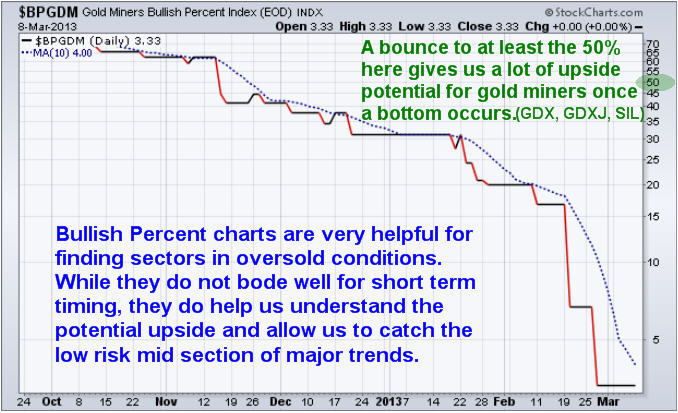
Gold Miners Bullish Percent Index:
Bullish percent indexes are a great way to see how popular an investment is. If you do not know what a bullish percent chart is then you can look it up online and learn more. The way I read it is when it’s up over 75-80 it’s a popular investment and everyone is buying it. It also means it’s in a major uptrend. But you must be aware that when everyone is buying something once price starts to turn down you better be one of the first few out the door before everyone else runs for the door and price crashes.
It’s similar but reversed for investments that are below 20. Everyone is selling, no one wants to own it but once the selling momentum stops price should rebound and rally. Keep in mind this indicator is not great for timing, but confirms that what you are looking at is either oversold, neutral or overbought in the BIG picture.
Weekend Precious Metals Trading Conclusion:
In short, I still like gold, silver, and their related mining stocks. I am watching them very closely for signs of a bottom and will be jumping on that train when the selling momentum looks to have stalled. Keep in mind that all these investments are still in a VERY STRONG DOWN TREND and trying to catch a falling knife is not what I do. Waiting for momentum to shift is my focus as there should be big upside if metals and stocks can find a bottom soon. If gold breaks down below key support as posted on the weekly chart then the uptrend may be over and it will be time to start looking for short positions.
http://www.thegoldandoilguy.com/wp-content/uploads/2014/11/tgaoglogo.png00adminhttp://www.thegoldandoilguy.com/wp-content/uploads/2014/11/tgaoglogo.pngadmin2013-03-10 21:54:052014-03-06 11:51:03Silver Miners, Gold Miners and the Price Of Gold
Over the past year my long term trends and outlooks have not changed for gold, oil or the SP500. Though there has been a lot of sideways price action to keep everyone one their toes and focused on the short term charts.
As we all know if the market does not shake you out, it will wait you out, and sometimes it will do both. So stepping back to review the bigger picture each weeks is crucial in keeping a level trading/investing strategy in motion.
The key to investing success is to always trade with the long term trend and stick with it until price and volume clearly signals a reversal/down trend. Doing this means you truly never catch the market top nor do you catch market bottoms. But the important thing is that you do catch the low risk trending stage of an investment (stage 2 – Bull Market, Stage 4 Bear Market).
Lets take a look at the charts and see where prices stand in the grand scheme of things…
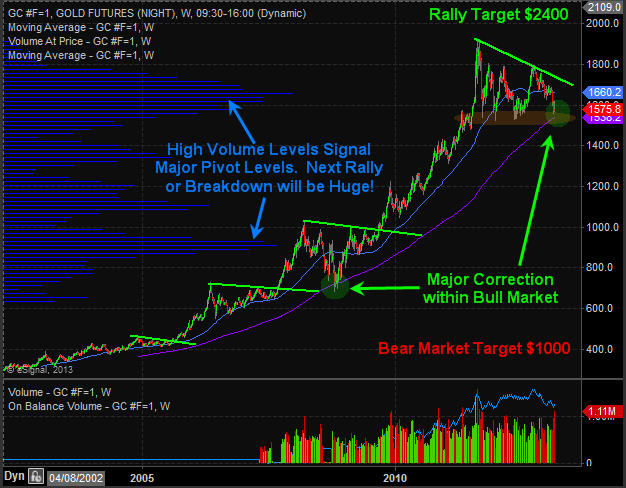
Gold Weekly Futures Trading Chart:
Last week to talk about about how precious metals are nearing a major tipping point and to be aware of those levels because the next move is likely to be huge and you do not want to miss it.
Overall gold and silver remain in a secular bull market and has gone through many similar pauses to what we are watching unfold over the past year. As mentioned above the gold market looks to be trying to not only shake investors out but to wait them out also with this 18 month volatile sideways trend.
A lot of gold bugs, gold and stock investors of mining stocks are starting to give up which can been seen in the price and selling volume for these investments recently. I am a contrarian in nature so when I see the masses running for the door I start to become interested in what everyone is unloading at bargain prices.
Gold is now entering an oversold panic selling phase which happens to be at major long term support. This bodes well for a strong bounce or start of a new bull market leg higher for this shiny metal. If gold breaks below $1500 – 1530 levels it could trigger a bear market for precious metals but until then I’m bullish at this price. I think we could see another spike lower in gold to test the $1500- $1530 level this week but after that it could be off to the races to new highs.
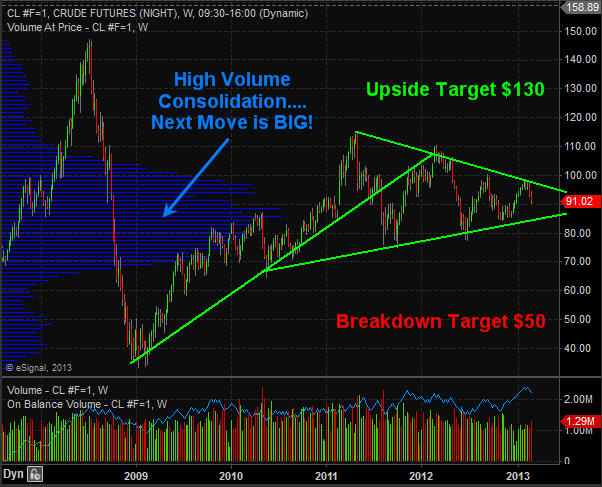
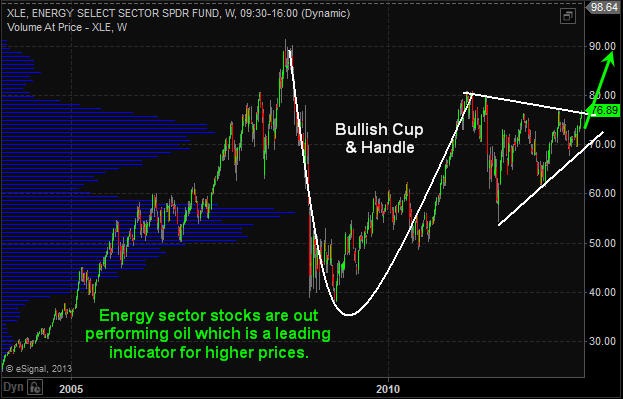
Crude Oil Weekly Trading Chart:
Oil had a huge bull market from 2009 until 2011 but since then has been trading sideways in a narrowing bullish range. I expect some big moves this year for oil and technical analysis puts the odds on higher prices. If we do get a breakout and rally then $130 will likely be reached. But if price breaks down then a sharp drop to $50 per barrel looks likely.
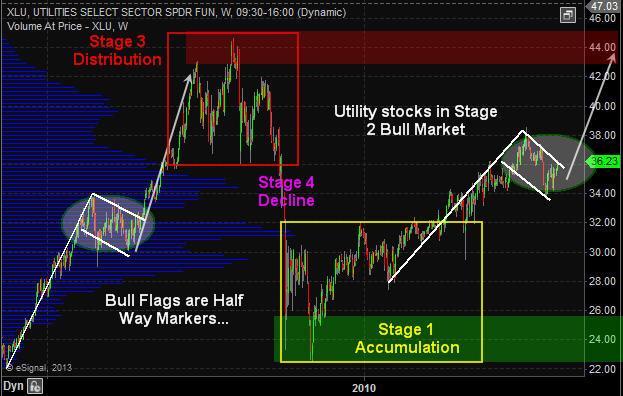
The utility sector has done well and continues to look very bullish for 2013. This high dividend paying sector is liked by many and the price action speaks for its self… If the overall financial market starts to peak then these sectors should hold up well because they are services, dividend and a commodity play wrapped in one.
SP500 Trend Daily Chart:
The SP500 continues to be in an uptrend which I am trading with until price and volume tell me otherwise. But there are some early warning signs that another correction or a full blown bear market may be just around the corner.
Again, sticking with the uptrend is key, but knowing what to look for and prepare for is important so that when the trend does change your transition from long positions to short positions is a simple measured move in your portfolios.
Weekend Trend Conclusion:
In short, I remain bullish on stocks and commodity related stocks until I see a trend change in the SP500.
Energy sector is doing well and looks bullish for the next month. As for gold and gold miners, I feel they are entering a low risk entry point to start building a new long position. Risk is low compared to potential reward.
When the price of a commodity or index trade near the apex of a narrowing range or major long term support/resistance level volatility typically increases as fear and greed become heightened which creates larger daily price swings. So be prepared for some turbulence in the coming weeks while the market shakes things up.
If you like my work then be sure to get on my free mailing list to get these each week on various investments for investment ideas at www.GoldAndOilGuy.com
Chris Vermeulen
http://www.thegoldandoilguy.com/wp-content/uploads/2014/11/tgaoglogo.png00adminhttp://www.thegoldandoilguy.com/wp-content/uploads/2014/11/tgaoglogo.pngadmin2013-03-03 15:38:492014-03-06 11:54:08Gold, Oil & the SPX Trends and Setups