Everyone knows people make mistakes when rushed to do something or if they are scared of something bad happening. We also know fear and greed is what moves the market each month, week, day and tick… So when the majority of investors are selling their shares at the same time you must recognize the psychology behind it and prepare for a low risk trading opportunity in the days that follow.

Stepping back and looking at the general vibe in the financial arena we hear about Quantitative Easing II coming to an end which should help the dollar gain strength again. A rising dollar means lower stock and commodity prices. Also keep in mind the United States is in so much trouble they will always have quantitative easing even if they are not calling it QE, that’s my opinion anyways…


In addition, everyone was talking about the saying “sell in May and go away”. Take a look at the chart of the SP500. The first session in May was the highest point and the SP500 has only gone down since then. The chart below shows my fear indicator and with the masses all selling in the month of May I have to think it’s getting ready to bottom and start another 5-6% rally from down here. Keep in mind I am more neutral on the overall market for the longer term. In the next month or two I figure we see higher prices from here but come August we could see the dollar bottom and stocks sell off in a more significant manner.


Last but not least, gold and silver…
Looking back in time and reviewing inter-market relationships with gold and silver I feel more and more investors are becoming bearish and moving their money into safe havens like gold and silver. Recently we saw a sharp pullback in both gold and silver. The price and volume action that took place was a clear sign of distribution selling meaning big money players taking money out of those investments. I see this pattern happen in stocks, indexes and commodities all the time and it generally warrants caution!

My trading buddy JW Jones over at OptionsTradingSignals.com has some very exciting ways to profit from these choppy market conditions with limited risk. If you are into options then check it out.

Typically we will see a few more new highs being reached which are quickly followed with strong selling. What happens is that the big money players allow the price to make a new high and that hits the headline news, CNBC, BNN etc…. drawing in new buyers and a surge of volume for the big money guys to sell into and exit their positions at the top. It also helps cover up their large volume selling.

Below is what I am thinking will take place in gold this summer.


Weekend Trend Conclusion:
In short, I feel the dollar will continue to slide lower, both stocks and commodities should have some strength over the next 1-2 months but after that all bets are off and it will be time to re-evaluate things.

The next week in the market will most likely make or break this outlook as the overall market is trading at a tipping point. Let’s see how this week pans out then take another look at the charts.

Get my trading reports free each week here: www.thegoldandoilguy.com/trade-money-emotions.php

Chris Vermeulen

It was a crazy session as the stock market slid over 2% on heavy volume. This type of price action means fear has taken control of masses and they are unloading (selling their stocks) in anticipation of much lower prices.
Trading off extreme levels of fear can be very rewarding if done right. That’s because fear is the most powerful reaction we as humans have and it’s somewhat predictable. Fear can make people do crazy and or stupid things and it’s these extreme reaction which investors do in the market that lead to great trading opportunities. Buying into fear and selling into greed is what I focus on.

Gold and Silver Showing Greed and Fear
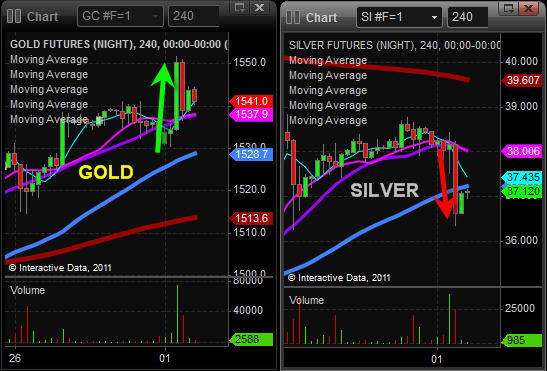
For example, if we take a look at the 4 hour chart of gold and silver you will see how investments which have a large amount of speculation like Silver move the opposite to what other related investments like gold are doing.

The first chart which is gold, shows how today’s fear had investors moving into this shiny safe haven. Silver on the other hand has been the investment of choice for every Tom, Dick and Harry trying to play the popular headline investment. So on a day like today when prices start to slide in the stock market these speculative holders of silver get scared and dump (sell) their position in stocks and silver. The problem with silver is that the market is still small and its does not take many people hitting the sell button to send it 5% lower which is what took place today. This is one sign which is telling me traders are getting scared of a market selloff.

Evidence #2 Showing Signs Of Fear
These data points below clearly show sellers were in control today. I like to look at the NYSE because it holds all the big brand name stocks which the masses like to buy when they feel lucky. So when I see this many traders selling and so few buying I know the masses are dumping shares and going to a cash.

The NASDAQ had 10 shares being sold to every one share being bought which is half the fear level of what the NYSE and that makes good sense. The NASDAQ has many smaller companies which the masses just don’t know about or own so there was not as much selling taking place on that exchange. So brand name stocks getting dumped all at once is another sign of extreme fear hitting the market.

Evidence #3 Showing Signs Of Fear
This chart below provides the momentum of the market. I think of it as the rubber band effect. If the market selling momentum is strong enough then it pulls this indicator down to a level which it cannot go much further before it gives way and moves back a neutral or positive extreme level. This little hidden gem of an indicator can help time entry and exit points with ease once you understand it. Currently its telling us that a pause or bounce is likely to happen tomorrow.

Evidence #4 Showing Signs of Fear and an Oversold Market Condition
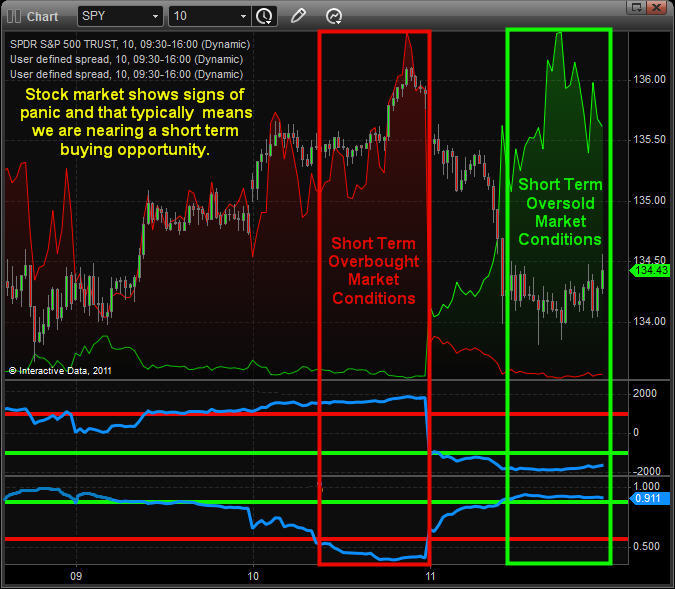
Take a look at the 10 minute SPY (SP500) chart below. Simple visual analysis shows that today’s strong selling which has brought the market down into a support zone should provide a pause or a bounce very soon. The question is how big will the bounce or rally be?

Given all the confirming is looking ready for a bounce and I feel we could be nearing not a bounce but an intermediate bottom and higher prices going forward. But if we break strongly below this support level then all bets are off and much lower prices should occur.

Mid-Week Trading Conclusion:
In short, today’s sharp move lower has put the market in a short term oversold condition. Meaning, a bounce is very likely to take place within the next 1-3 sessions. With the masses selling all their positions in stocks and commodities it generally takes 1-3 days after a day like this for the selling pressure to dissipate and for value buyers to step back into the market providing support.

I think both stocks and commodities will strengthen in the next few days and we will see if the market can get some traction and start a new rally. But until everyone has sold out of the market giving their shares to the big money (smart money) at a sharp discount I feel we have a rough road ahead.

Get these trading reports free each week here: http://www.thegoldandoilguy.com/trade-money-emotions.php

Chris Vermeulen
Update on Metals with David Morgan and Chris Vermeulen

Listen To What David and Chris have to say About gold and silver: http://www.netcastdaily.com/broadcast/fsn2011-0520-1.mp3

Seduced by silver at the tender age of 11, David Morgan started investing in the stock market while still a teenager. A precious metals aficionado armed with degrees in finance and economics as well as engineering, he created the Silver-Investor.com website and originated The Morgan Report, a monthly that covers economic news, overall financial health of the global economy, currency problems ahead and reasons for investing in precious metals.

Today on Jim Puplava’s Financial Sense Newshour metals update, David Morgan talks about the 16:1 gold to silver ratio fallacy and why we see silver margin requirements imposed.

Chris Vermeulen is Founder of the popular trading site GoldAndOilGuy.com. There he shares his highly successful, low-risk trading method. Since 2001 Chris has been a leader in teaching others to skillfully trade in gold, oil, and silver in both bull and bear markets. Subscribers to his service depend on Chris’ uniquely consistent investment opportunities that carry exceptionally low risk and high return.

Jim Puplava welcomes Chris Vermeulen today on the Financial Sense Newshour metals update. Chris indicates that silver is still consolidating, with the possibility of one more down draft.

Read Chris Vermeulen’s previous forecast which unfolded as planned: http://www.thegoldandoilguy.com/articles/parabolic-moves-are-only-temporary-for-silver-and-gold/


Here is quick pre-week analysis video explaining what I think could happen in the gold, silver, oil and the stock market.

The dollar continues to control the short term movements in both stocks and commodities

We are about to see some fireworks across the board in the next few trading sessions and im leaning more towards lower prices

I feel as though we are at a tiping point similar to March 9-10th on the SP500…

This week should shed some light on what the market wants to do, Rally or Selloff

Watch My Video Analysis Here: http://www.thetechnicaltraders.com/ETF-trading-videos/TTTMay16/TTTMay16.html

Smart Phone Video Format: Click Here

Chris Vermeulen

This week we are seeing fear across the board from traders and investors as they dump their long positions is stocks and commodities. Just in the past two trading sessions alone we have seen extreme overbought conditions and extreme oversold conditions which generally mean another big move is brewing…

Fear (panic selling) has very distinct characteristics when looking at the intraday charts and we are seeing those price and volume patterns forming now. When waves of buying and panic selling start to take place back to back, I start to prepare for a trading setup which should form within a couple of trading sessions.

Keep in mind that fear is a much more powerful force in the market and once extreme levels are reached, we typically tend to see continued selling for 1-3 more days afterwards. This is the reason I tend to scale into oversold market conditions as I can potentially enter at lower prices within the next couple of sessions to build a position with a reduced cost basis.

SPY 10 Minute Chart of My Market Sentiment Readings
Panic selling, coupled with oversold NYSE market conditions and fearful options traders makes for an extreme reading in stock prices.

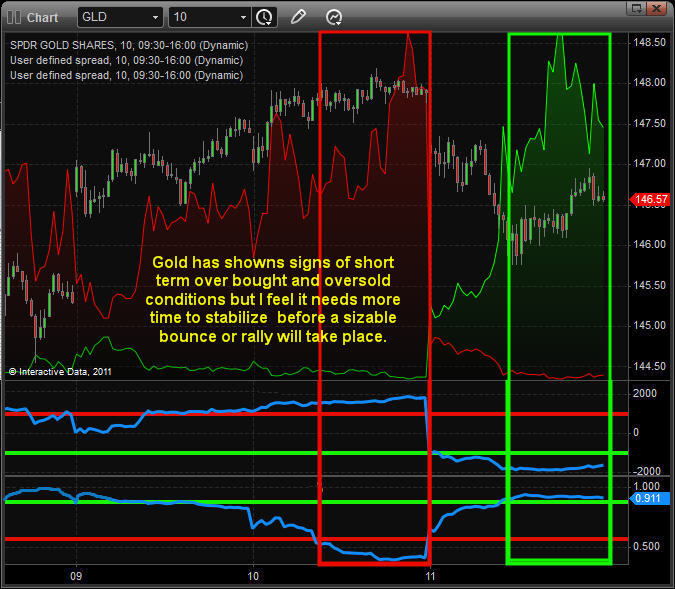
GLD 10 Minute Chart of My Market Sentiment Readings
Sentiment readings many times carry over into the precious metals sector and can be used as a gauge also for tightening stops, adding to long positions etc..

Mid-Week Market Trading Update:
In short, I feel the market is at a major tipping point along with the US Dollar. It is just a matter of time before we get another low risk setup and take a position for the next move in either direction.

Get My Weekly Reports Free Here: http://www.thegoldandoilguy.com/trade-money-emotions.php

Chris Vermeulen
The price action in precious metals and oil this past week has been breathtaking. The last time we have seen this much volatility in commodity prices was amidst the financial crisis in 2008 and the early part of 2009. Does this mean we are at the brink and risk assets are going to decline precipitously? Obviously that question cannot be answered with any certainty, but the underlying price action in the S&P 500 has been relatively strong compared to gold, silver, and oil.

Talking heads everywhere are predicting the commodity bubble has burst and pointing fingers at excessive speculation in silver and oil. Margin requirement changes in silver futures have been fingered as the primary catalyst for the nasty sell off. Silver had gotten way ahead of itself in terms of price and parabolic moves higher are usually followed by parabolic moves lower. For silver buyers on Friday, April 29 a painful lesson has been learned as their investment has declined more than 30% in 5 days.

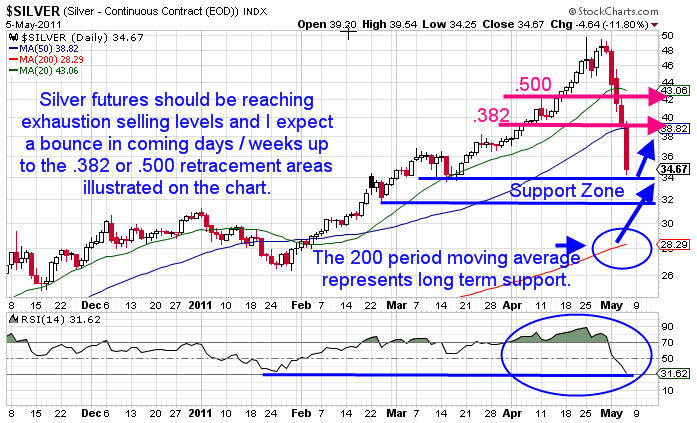
It doesn’t take a genius to realize that we are going to bounce higher at some point. With a sell off of this magnitude it would not be shocking to see at least a 50% retracement of the entire move in coming weeks. It is also possible that this is a buying opportunity for precious metals and oil. It is too early to be certain, but a bounce next week is likely as silver went from being severely overbought to severely oversold on the daily chart in one week. The chart below illustrates the 50% retracement and the RSI reading for silver futures:

In the month of April OptionsTradingSignals members were able to capitalize on rising silver prices to close a trade that produced an 18% return in less than 5 days using a double calendar spread in order to produce outsized profits based on maximum risk. Members regularly receive trade alerts focusing on gold and silver using ETF’s GLD & SLV which have extremely liquid options.

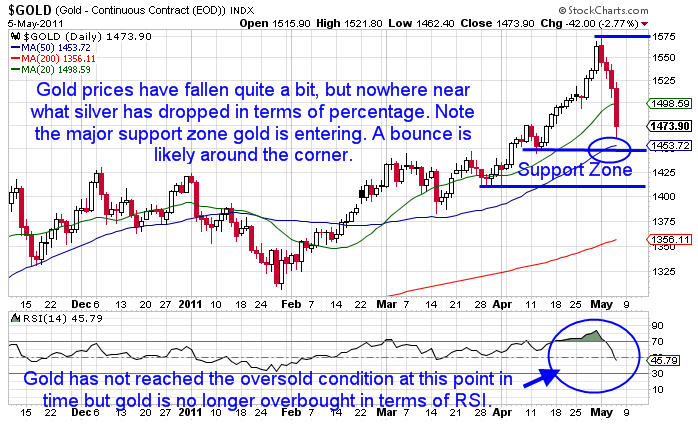
While silver prices have been absolutely crushed, gold prices have held up a bit better. In fact, in this selloff gold has been less volatile in terms of intraday percentage price movement and has not suffered from near the losses that we have witnessed in silver. The gold futures chart below illustrates key price levels:

Members of the OTS service received a trade alert on April 6th for a calendar spread that was converted to a vertical spread. When the vertical spread was closed on April 26th the members realized a gain close to 56% based on the maximum risk of the trade.

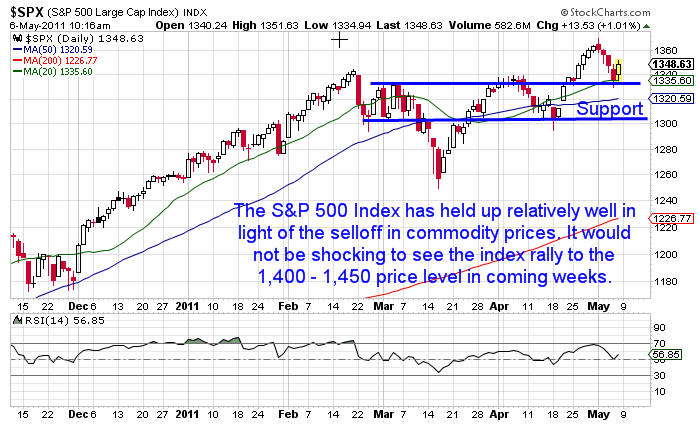
Recently we have received some poor economic data which has put a drag on equities the past few weeks. This morning we are seeing a strong bounce in the S&P 500 futures and if we have another light volume Friday prices tend to drift higher throughout the trading day. The S&P 500 futures spiked to around 1,370 on the news of Osama Bin Laden’s death and then sold off from that point. The chart below illustrates the S&P 500 futures rally and subsequent sell off highlighting current key price levels:

Members of OptionsTradingSignals received a trade alert on April 12th to put on a call vertical spread to capitalize on rising prices. On April 21st partial profits were taken and eventually stop orders closed out the position on May 4th locking in a total gain of around 32% for the trade based on maximum risk.

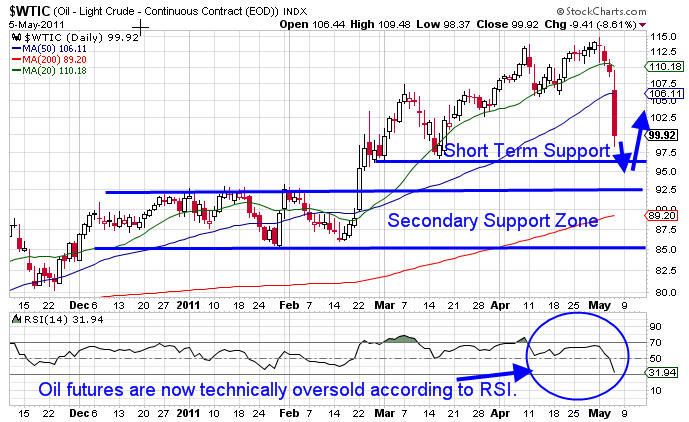
Oil prices have sold off sharply, albeit not as sharp as the downside move in silver recently from a percentage standpoint, but a significant amount of the risk premium has come out of oil prices. I continue to believe that oil prices over the long term have only one direction to go based on tightening supply / demand going forward and lower production levels in the future. Similar to silver, a .500 retracement of the entire recent move is rather likely in coming weeks. The daily chart below illustrates key price levels in oil futures:

I continue to believe that oil prices are going to work higher over the longer term for a variety of reasons, but a drop in gasoline prices would not hurt U.S. Consumers and the domestic economy. Higher oil and gasoline prices weigh on the U.S. Economy heavily so this sudden decline in price is beneficial to most Americans which could juice consumption if prices stay lower for a longer period of time.

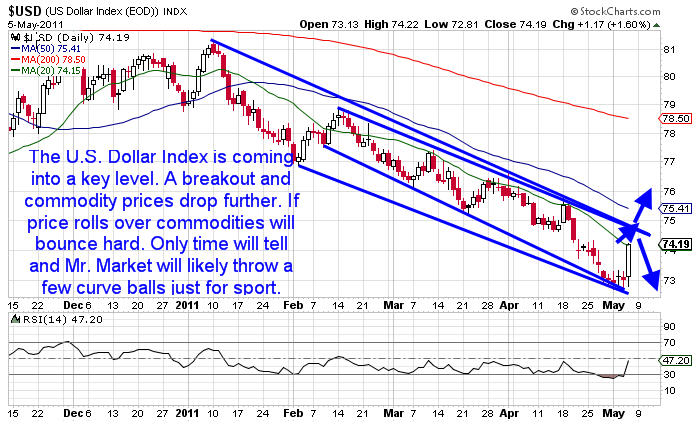
Overall, price action in the commodity space has been extremely volatile the past week with silver and oil really getting hammered lower. Gold and the S&P 500 held up a bit better and it would not be shocking to see the S&P 500 put on a rally from here if oil prices stabilize. However, if the U.S. Dollar continues its recent rally it will force the commodity space as well as equities lower. The daily chart of the U.S. Dollar Index futures is shown below:

In closing, I am expecting a bounce in coming days and a .382 or .500 retracement of the entire move in gold, silver, and oil would make sense so I would not be too aggressive shorting. However, I would not necessarily be an aggressive buyer either. It is going to take time for market participants to digest the recent moves. In weeks ahead it will be more apparent what price action is likely to do and I would be shocked if we did not see a few low risk, high probability trades setting up.

Speaking of low risk, high probability trades, the month of April was the best performance for the OptionsTradingSignals service so far year to date. Seven total trades were opened and six trades have been closed with sizable profits. Recent returns included an 18% return in SLV, a 56% return on a GLD trade, 32% return on an SPY call vertical spread, a 12% return on a RUT Calendar spread, and a 37% return on an AMZN calendar spread. The total cumulative return in April was 155%.

Assuming a trader had a $10,000 account and risked a maximum of $1,000 per trade, the gross gains would have been well over $1,400 in April alone. The overall service is up over 15% year to date handily beating the S&P 500 return while assuming less risk. Take advantage of the special offer going on now where new members get 3 months for the price of one!

Get JW Jones’ Weekly Reports Free Here: http://www.optionstradingsignals.com/profitable-options-solutions.php

By: JW Jones
Co-Author: Chris Vermeulen

The past few weeks we have been seeing the US Dollar slide to new lows at an increasing rate. The strong devaluation of the dollar has sent precious metals like silver and gold rocketing higher out of control sending them parabolic!

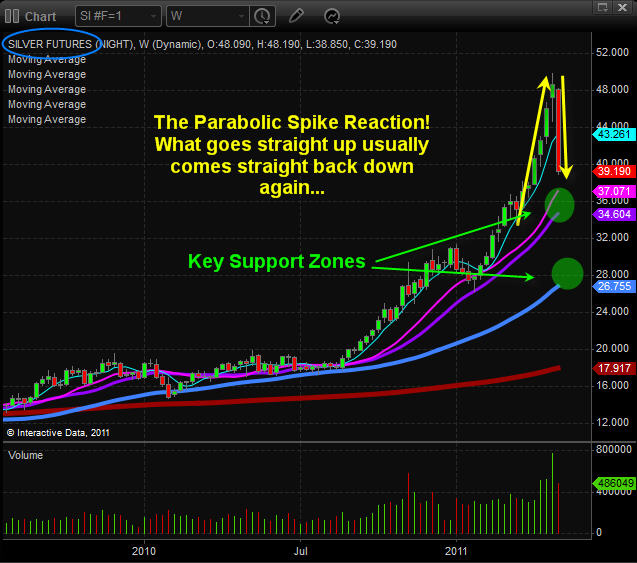
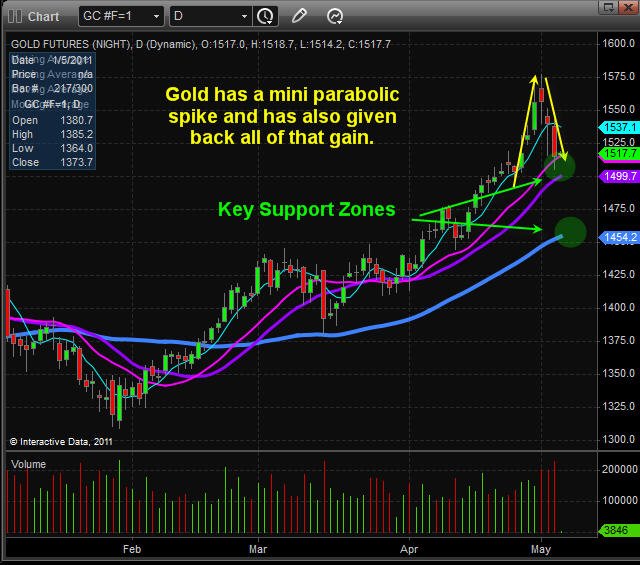
During the past 6 weeks both silver and gold have been rising in a parabolic formation. Meaning the price is going straight up with strong volume as everyone gets greedy and buys into the commodities at the same time. Most of you who follow my work already know that if the general public is piling into an investment rocketing prices higher, you better start focusing on tightening your protective stops and or taking some profits off the table before the price collapses.

Take a look at the weekly chart of Silver below:
Silver was grinding its way higher from July into March of this year. Only in the past 6-7 weeks did we start to see silver open up and run with expanding candles growing at an accelerated rate. This virtually straight up rally is a signature pattern and tells me that price action is now VERY unpredictable and anyone getting involved should be tightening their stops and or taking partial profits on price surges.

Parabolic moves can provide some big gains but most traders end of giving it all back and then some because the price can drop very abruptly as seen on this chart.

The weekly chart of gold below shows much of the same thing but without the extreme volatility that silver has.

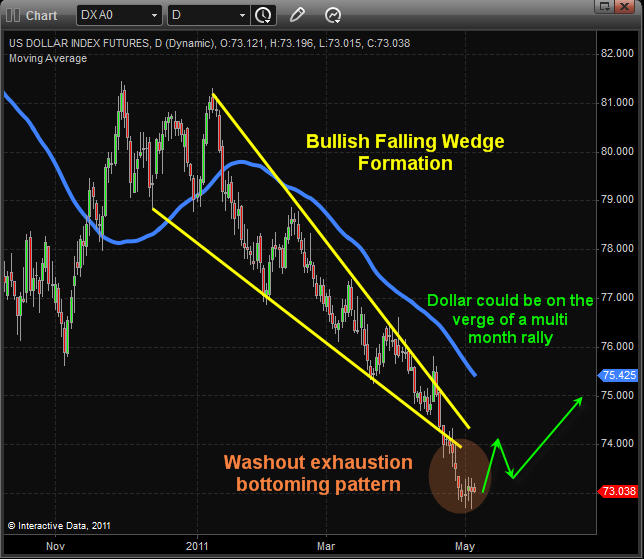
Now, if you take a look at the US Dollar chart it’s starting to look very bullish in my opinion. The chart shows a falling wedge which typically means the selling pressure should be coming to an end soon. I’m not sure how large the bounce/rally will be. I do think a quick move to the 75 level is very likely in the near future though.

I find that metals tend to turn just before the dollar does. So I’m very cautious here on buying any stocks or commodities at the moment. The past 2 years we have seen stocks and commodities have an inverse relationship with the dollar so a rising dollar means a market pullback will take place. Sell in May and Go Away…?

Mid-Week Trading Conclusion:
In short, we exited our SP500 position this week for a nice 6% gain in a couple weeks making that our third profitable back to back index play. At this time I’m not ready to buy or short the market until all the charts line up for another low risk entry point. Things are 50/50 odds here and that’s not good enough for me.

That’s it for now, but remember you can get my free trading reports each week at: http://www.thegoldandoilguy.com/trade-money-emotions.php

Chris Vermeulen

The dollar continues to control the equities and commodities market with its inverse relationship to them. The past couple years it seems that the dollar does what it wants and the all other investments move according to their relationship with rising or falling dollar prices.

 
Most of you know that I follow the dollar very closely. And each morning I provide my analysis with what I feel will take place throughout the session or next 48 hours.

 
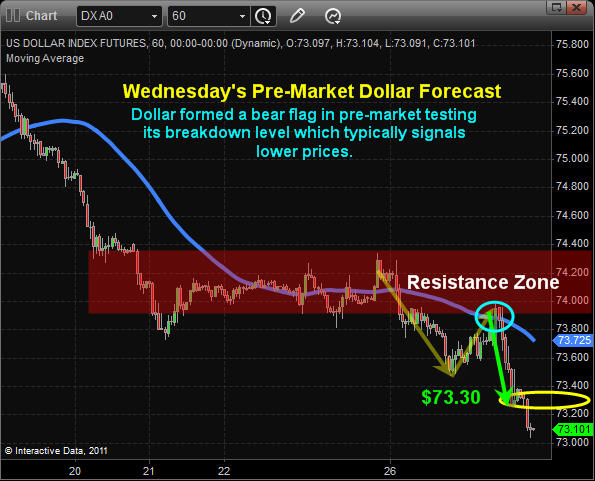
In Today’s (Wednesday’s) pre-market trading analysis I talked about the strength of the equities market in the past few sessions and that it looks as though it still has more power behind it.


Dollar Index 60 Minute Chart
Taking a look at the US Dollar I noticed this morning that it was pointing to even lower prices and that it would likely happen today. It was only a few hours later that the dollar went into a free fall blowing through my downside price target of $73.30. It was this sharp drop in the Dollar which sent stocks, silver and gold soaring higher yet again in our favor.

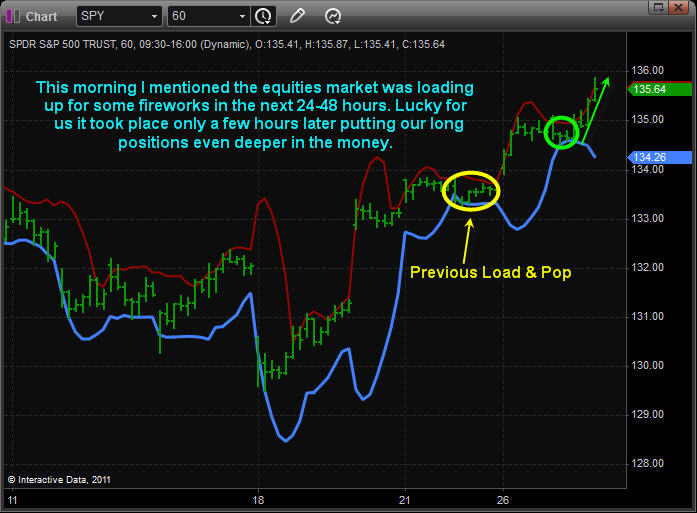
Equities Market – SPY 60 Minute Chart
Stepping back a couple hours before the US dollar dropped in value sending stocks higher I did see fear creep into the market as traders started selling their shares and buying put options expecting the stock market to fall. When I saw this I got exciting because higher stock prices are usually just around the corner which they were! That’s when I sent an update out subscribers noting we should see some fireworks very soon.

 
While I am bullish on the stocks and metals at the moment and are long in several positions I am starting to see signs that a pullback is becoming more likely each trading session. This is when money management is important. I do not want to give back to much profit, but I must make sure we lock in some gains during times when the market is overbought like this.

Mid-Week Trading Conclusion:
In short, we continue to ride the trend of higher stock and precious metal prices as the US Dollar spirals down out of control. Our SP500 positions are deep in the money and we continue to ride it for all it’s worth raising our stops as we go.

 
The big question is if the Sell In May, and Go Away will take shape or not… Im thinking it will as when the time is right I will be looking to short the market.

If you are not yet getting my pre-market chart analysis be sure to join my trading service at http://www.thegoldandoilguy.com/free-preview.php

Chris Vermeulen
It has been a very interesting week thus far. Monday kick started traders with a heart pounding equities sell off which sent money into the US Dollar, precious metals and bonds as the safe havens of choice.

A lot has happened this week on a technical analysis basis which I can’t really show in a written report like this. But can do so in detail within my video newsletter. There are just to many charts required and layers of analysis to cover… But I can cover some of the points and my thoughts using the charts below:

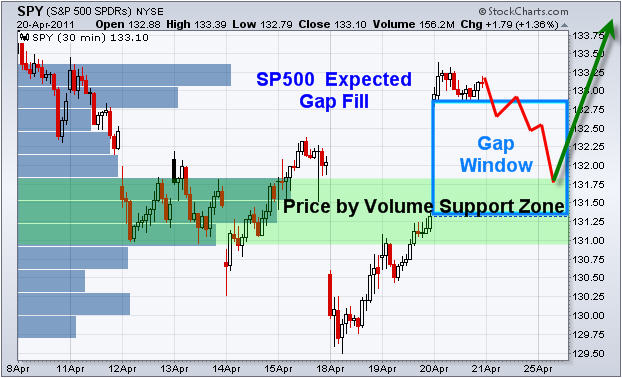
SPY 30 Minute Intraday Chart
This chart shows the volume traded at various price levels for the SP500 index. These high volume levels act as support or resistance depending if you are above or below them. On Wednesday we had large gap higher into a resistance level which the market could not break through. So I am expecting to see the market take a pause and fade back down to fill part or all of Wednesday’s gap window.

While most gaps tend to get filled. Gaps that occur right at the beginning of a new trend when momentum is strong. They generally do not fill all the way down to the bottom. I expect a couple days of sideways to lower price action. Buyers should step back in and send the market higher next week if this trend is to continue.

GDX – Gold Miner Stocks – Daily Chart
Gold stocks have been underperforming the price of gold bullion for several months. This typically is not a strong sign for physical gold prices. That being said I do feel the majority of investors are seeking true safety and want to own real gold and not some highly leveraged gold stock. This to me is more of a risk off trade for global investors and it explains the performance.

From the recent price action shown on the GDX chart I am expecting to see prices trade sideways or lower in the coming days. A sideways move would actually be bullish and would signal a possible breakout to upside. So that is what I am hoping will unfold in the coming days/weeks.


US Dollar Daily Chart

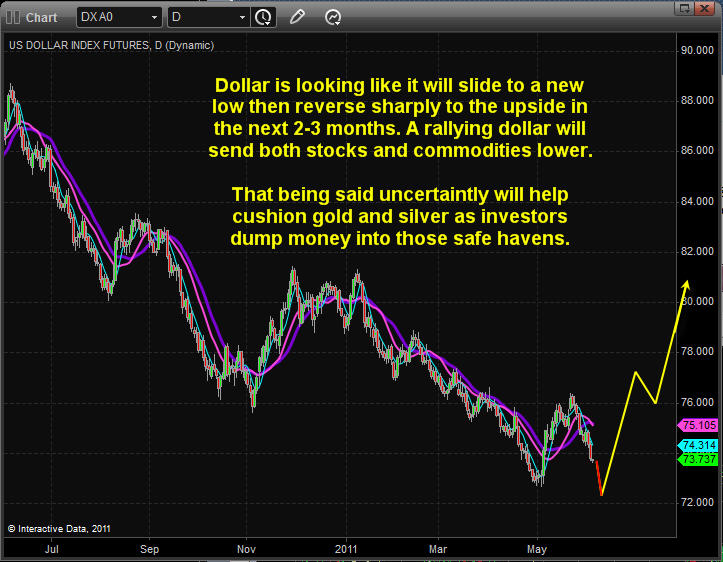
The dollar continues to get sold at a tremendous rate and the Fed is devaluing the currency as quickly as they can trying and save the world one dollar at a time…
The trend is strongly down but it’s starting to near a point where we should start to keep a closer eye on it for signs of a reversal to the upside. When the dollar makes a move higher and starts a rally it will put downward pressure on stocks and commodities. We must be prepared to move our protective stops ups and possibly take advantage of falling prices in the near future. Until then remain long equities and commodities.

Mid-Week Trend Conclusion:
In short, it looks as though stocks and commodities are in favor again. Monday’s panic sell off looks to have shaken the masses out of the market and the big money players were buying up all the shares they could. Members and myself are sitting nicely in our long positions and this could be the start of something exciting.

You can get my Pre-Market Trading Analysis Videos, Intraday Chart Updates and Trade Alerts with my Premium Newsletter: http://www.thegoldandoilguy.com/free-preview.php

Chris Vermeulen
In overnight and pre-market trading the US Dollar posted a strong rally which in turn caused a sharp selloff in the equities market. The market is currently down 1.6 – 2.3% depending on the index traders are following.

Here is what I see on the charts going forward a few days.

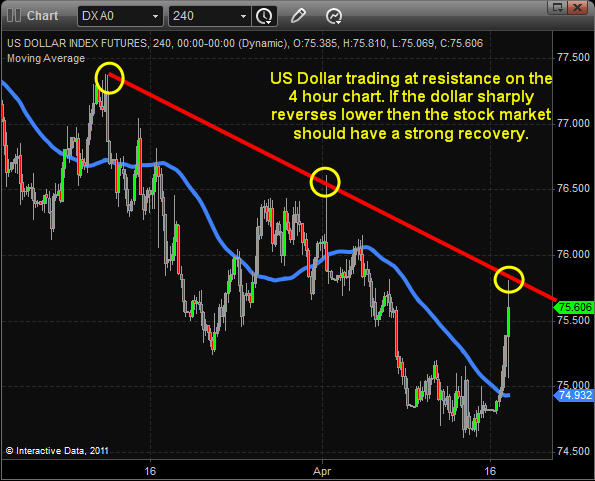
Dollar Index – 4 Hour Chart
The Dollar is trading at a resistance level which has in the past triggered strong moves lower. If we get a move lower on the dollar from here then I expect a strong recovery in the equities market and likely higher commodity prices also. If the US Dollar breaks out and rallies above this point then we could see a much further collapse in stocks and commodities.

The falling dollar has also helped to boost crude oil prices the past couple months. One of my trading buddies J.W. Jones at OptionsTradingSignals.com pocketed a nice 86% gain on a USO cash secured put based on the credit sold. Also the weak dollar has his GLD options trade up over 50% already and it has just begun. Jones is an options expert and always seems to find a way to pull money out of the market month after month…

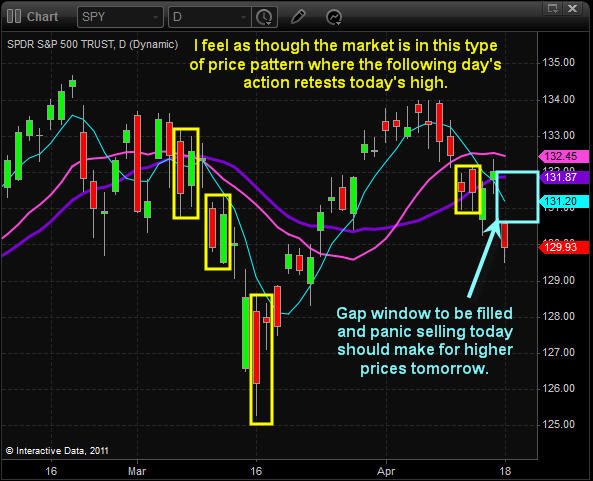
SPY Daily Chart
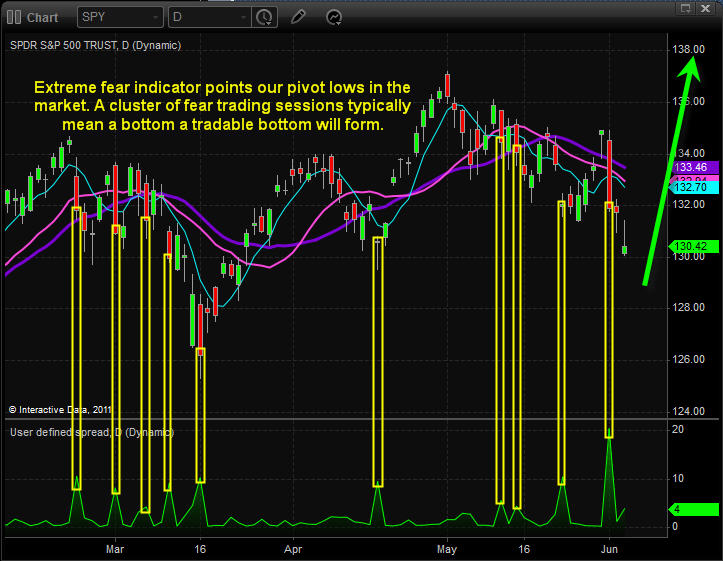
The daily chart shows a large gap down putting the market in a short term oversold condition. Typically we see the market bounce back up or gap higher the following day. In some cases similar to today the market actually bottoms. So those long the SP500 I feel have a good change of recouping some of today’s decline by waiting for the kneejerk reaction bounce in the next 24-48 hours.

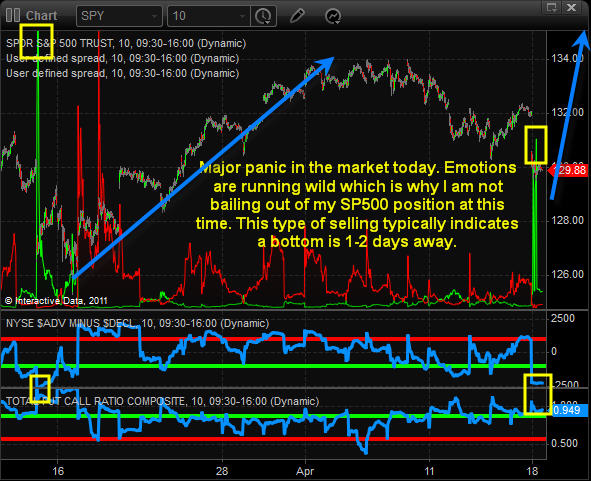
Market Sentiment – Panic Selling At Extremes
Today we are seeing panic selling at levels not seen since the market bottom in March. The green indicator spikes on the chart show very high levels of traders/investors dumping stocks in fear of a collapse. Today’s negative headline news has sparked mass fear and when levels like this are reached you should think of holding long positions for another 1-2 session to see if we get that bounce or market bottom.

Monday Mass Selling Conclusion:
Today’s sharp drop in equities could be an excellent low risk opportunity to add or take a long position here because most of the downside fear for the short term has been eliminated today.

That being said the trend appears to be down on the SP500 now so at this time I am looking to sell into a rally if we get one today, tomorrow or Wednesday.

Get My Free Trading Rule Guide And My Weekly Newsletter Here: http://www.thegoldandoilguy.com/trade-money-emotions.php

Chris Vermeulen