March 11th 2010
So far this week has been pretty slow. Large cap stocks continue to lag the market which can be observed by looking at the Dow Jones Industrial Average which still has room to move higher before breaking the January high.

One important thing to note is that volume has picked up this week considerably – particularly on the SP500 and OEX. It’s difficult to say if this volume is a good sign or not.

A lot of stocks and sectors are trading near their January high and this gives traders a reason to unload shares. On the flip side, the several sectors and indexes have broken their January high and this triggers a surge in volume as breakout traders try to take advantage of the new high and momentum. So you can see how the surge of volume is not a useful indicator right now.

Here are some charts of what I think we could see in the coming weeks.

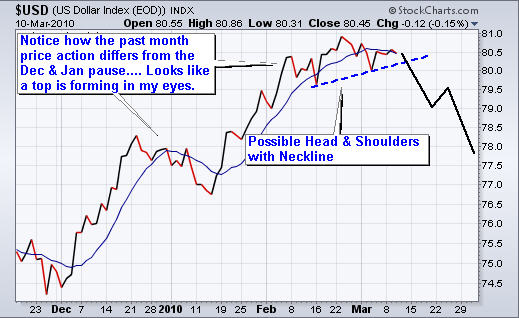
US Dollar Index – Daily Trading Chart
I follow the US dollar index very closely simply because it affects the prices of stocks and commodities. I used a line chart below in order to take out the daily candle stick noise which made it very difficult for our eyes to pick up this pattern.

The chart shows a possible head & shoulders pattern and if that is the case then we should see the dollar start to slide lower. In turn, this would boost stocks and commodities. This is the fuel that I think could really move the market sharply higher in the coming weeks.
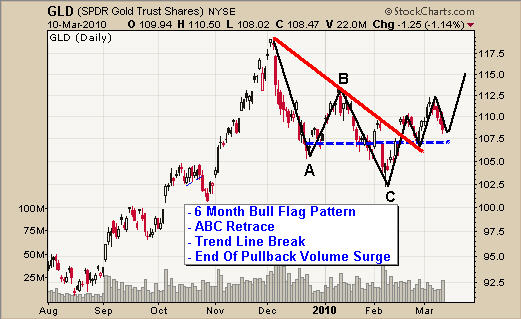
GLD Gold ETF – Daily Trading Chart
The price of gold looks to be setup for a nice bounce off support and the timing could just work out if the US Dollar starts to drop over the next few days. There could be a low risk setup just around the corner.
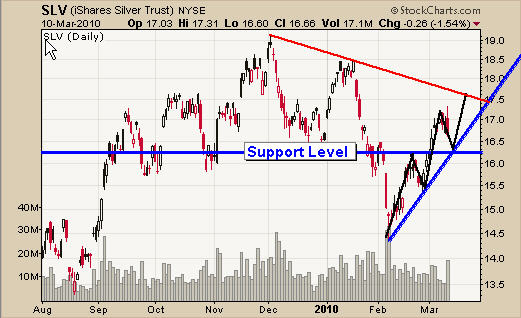
SLV Silver ETF – Daily Trading Chart
Silver has held up well but today’s reversal candle to the downside scares me a little. The odds are that silver will carry this strong momentum selling down for another 1-2 days. Again, with any luck, it will test support and the US Dollar will start to slide lower.
Crude Oil – Daily Trading Chart
Oil has had a great run the past month but as you can see it’s currently trading at the top of a large trading range. I would like to see a sideways move before it takes another run at the $84 level, but the 7 day bull flag that formed two weeks ago may have been enough to maintain the upward momentum. Again, if the Dollar drops we will see oil rally.

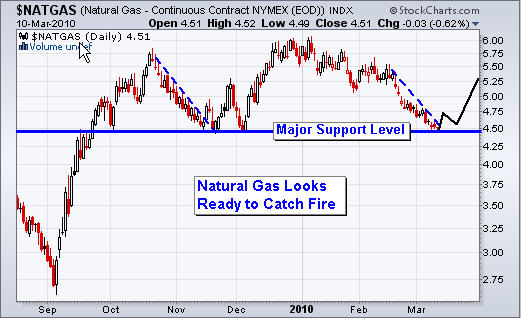
Natural Gas – Daily Trading Chart
This chart is actually very attractive looking. Even if you do not understand how to read charts I think it’s safe to say this one is a no brainer.

I will be closely watching for a potential low risk setup in the coming days.

Mid-Week Trading Conclusion:
In short, stocks and indexes are trading at resistance levels with many of them making new highs and that is great to see.

A lot of things are trading in limbo waiting to see what the US Dollar is going to do. Several months ago I posted some charts showing that 81 would be a key resistance level for the dollar. If it broke above that then 84 would be the next key level to watch. So we just have to wait and see… the hardest part of trading is the waiting.

Gold, silver, oil and natural gas all look like they could continue higher in the next few days if things unfold that quickly. But the market always finds a way to drag out moves so we could still be a 2-3 weeks away.

I hope this report helps give you an idea of where things are at in the market.

If you would like to receive my Free Trading Reports and Analysis be sure to visit my website:


First Name:
Email:


Chris Vermeulen
www.GoldAndOilGuy.com

Last week was exciting as we saw stocks and gold close above the February highs which confirms we are in a new up trend. The question everyone is wondering is:
.

How far will this market go before rolling over?

This is a tough question but we can get a good feeling about the risk and if it’s worth putting money to work or not at this point. Here are my quick points and thoughts about the stocks indexes at the current price (March 5th closing price).
• The market is extremely overbought on the hourly and daily charts. Buying here is just chasing prices around, and that is a net losing game.
• Small Cap stocks have been on fire making a new higher for the year. This is very bullish but again buying here carries too much risk because after such a sharp price appreciation, we can see it all be given back just as quick.
• Volume over the past three weeks has been below average and when I see higher prices on declining volume I expect prices to drop very quickly once the thrust upwards ends.
.

Stock Market Indexes – 21 Trading Days
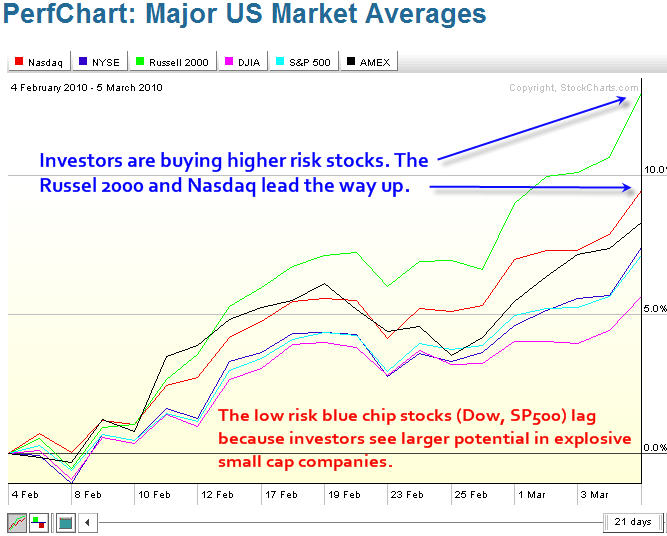
Here is a simple chart showing the past 21 trading sessions. It compares the Nasdaq, NYSE, Russell 2000, Dow Jones, SP500, and Amex indexes.

As you can see the Russell 2000 (small cap stocks) and Nasdaq (tech stocks) have been on fire the past couple weeks while the solid large cap stocks lag.

.
Are The Small Caps Stocks Telling Us Something?
Its means investors and traders are confident enough to buy higher risk companies. This is good for the overall market because small cap stocks tend to lead the market in both up and down trends. What has me concerned is the low volume rally, which I don’t like.

One thing to note is that small cap stocks tend to do well during times when the US Dollar is rising. This is because they are not multinational dealing with currency exchange. So this small cap stock rally has me wondering if the US Dollar is about to continue its up trend or if investors really are comfortable with buying riskier stocks?

.
.

GLD Gold ETF – Daily Chart
Gold gained some ground last week but the majority of the money seemed to flow into small cap stocks. But take a look at this bullish chart.

This is a text book bull flag pattern complete with and ABC retrace, trend line break, and reversal candle off of a support zone. I am bullish on gold long term but think we could see prices rise a couple percent from here but will trend sideways/down for the next 2-3 weeks to digest the recent move up.

.
.

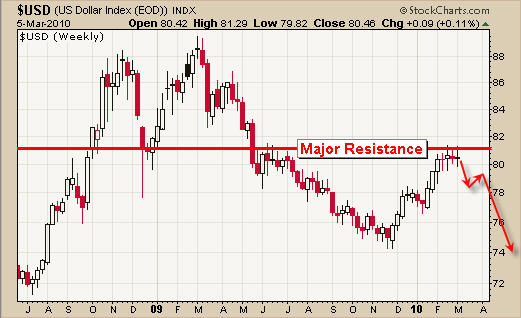
US Dollar Index – Weekly Chart
I have posted this chart several times in the past few months with 83 being a key resistance level. The dollar’s recent price action is very bullish and it is flagging just under this key resistance level. I feel the price is heading lower from here but only time will tell. A breakout to the upside will put a lot of pressure stocks and precious metals.

.
.

Weekend Trading Conclusion:
Last weeks strong rally into the close will most likely carry over into Monday and possibly Tuesday. The reason being is simply because retail traders and investors (John Doe’s) get excited when they see higher prices, thus it attracts more money into the market.

In short, I feel the market is overbought. All indexes are trading at resistance other than the Russell 2K index, and volume is below average. I am going to wait and see how things unfold this week before thinking about getting committed to any more long positions. If anything I will be looking to short the market using the intraday charts for a quick trade. Again low volume rallies that are overbought tend to snap back very quick on an intraday time frame providing a 1-4 hour trade.

Get My Free Weekly Trading Reports:

Chris Vermeulen
www.TheTechnicalTraders.com

March 3th
It’s been a great year for trading!
So far February, last week and this week have being absolutely amazing for both swing traders and intraday traders.

On February 5th we had extreme panic selling with nearly 35 sell orders for every 1 buy order on the NYSE. That extreme panic and dumping of shares was the day we jumped into the market and we nailed the bottom.

As my trading buddy David Banister from ActiveTradingPartners would say “Buy When They Cry!” and that is exactly what subscribers did. Since then our gold, silver and the index funds have been moving up nicely.

I would like to note that there were several more technical reasons why we jumped into the market that day but I won’t get into the nitty-gritty cause this mid-week update would be a trading book…

.

Explanation of What happened Last Week & This Week
Ok this may get a little confusing but try to stick with me here…

If you recall last Wednesday’s mid-week report which was called “Gold, Silver & Stock Indices on the Verge of Rolling Over”, I talked about how I was bearish on the overall market. This report has a bunch of detailed charts explaining what was most likely to happen next and some trading.

Well, the market played out just as we had expected. The market dropped 1.35% in over night trading and the following trading session providing intraday traders using ETF’s, Futures or CFD’s a net profit between 1.35% to over 100% return within 17 hours of entering a trade depending on which trading vehicle you used. Check out how this trade was executed by reading my report titled “How To Use Multiple Time Frames For Setups” which I send out the next day. Understanding how to trade using different time frames is a must for all traders and this report shows you how.

.

Now here is the part that has thrown a lot of traders off
Just to recap, I posted an extremely bearish report saying the sky is falling on Wednesday. Thursday morning the market moved down as expected, and then late Thursday afternoon I sent out a trade alerts to buy a bunch of precious metal and stock etfs.

I understand why emails flooded my inbox that afternoon…. Everyone wanted to know how I can say the market is falling then turn around and buy the very next day.

It’s actually a really simple answer. “I don’t fall in love with my positions” and “I re-evaluate the market after each new candlestick on the chart”.

Trading is not an easy task, that we all know. The market tests and bends my brain to the limit on a regular basis and if one cannot control their emotions and stick with a set of trading rules, then you will eventually lose all your money.

I have placed thousands of trades in my lifetime and pulling the trigger to get in and out of a position does not phase me anymore. But the problem is most people don’t want to exit a losing trade because then they are proven wrong and most people hate being wrong. If that’s what you are feeling, then you need fix it or get out of trading.

My general rule is “when in doubt, get out”. I would rather watch a trade move without me knowing I had it right, than be stuck in a losing trade, saying to myself, “Why the hell did I get into this trade?”

.

Re-Evaluating the Market or Your Investment
After each new candle is formed on a chart it is crucial to re-evaluate the charts. In other words if your main focus is to trade the daily chart then you better re-evaluate the strength of the chart each day and also check the 1 hour intraday chart for possible bullish or bearish patterns.

On the other hand, if you are an intraday trader focusing on trading the 1 hour chart, then you better be evaluating things every hour, and also check the 5 or 10 minute charts for patterns to keep an eye on price and volume action.

.

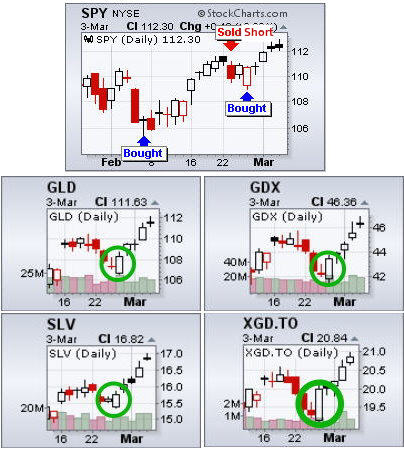
Below are daily charts of some ETF’s I trade showing how we have been trading the market. You can see February 25th the market reversed to the upside and that is when we went long again as prices formed an outside reversal candle and these funds have been moving higher ever since.

.

Mid-Week Trading Conclusion:

In short, it’s been a great start to the year with the market performing within its regular trading patterns between fear and greed.

I believe 2010 is going to be very tough for individuals who do not fully understand the market and how to manage risk. I figure the market is about to top in the next week or so then start to head lower. 2010 will most likely trade in a large sideways range for 8-10 months and maybe even longer. Being able to spot market reversals and trade them actively is were the money is this year. No grand slams, just a bunch of single base hits.

I would like to see the market rally and makes new highs but I am ready for what ever the market dishes out in the coming months.

I hope this report helped you to understand that trading is an active sport and being able to change directions one day to another is just part of the game.


If you are interested in my Trading Alert Service for ETFs check out TheGoldAndOilGuy
at www.TheTechnicalTraders.com

On another note, if you would like to trade all the setups I do in real-time I will be launching a service where I provide all my personal trades and analysis for your to follow along in real-time. Members will receive all my intraday and swing trade alerts for indexes and commodities Futures allowing you to trade which ever vehicle you want whether it’s an ETF, Leveraged ETF, Futures Contract or CFD. This way your timing is accurate and you can trade which ever investment you are comfortable trading with.

There will be a 24/7 chatroom allowing us to trade around the clock when setups arise. Also, members can swap ideas, ask me questions, make new trading buddies etc… There is even a squawk box feature! I can talk live with audio to everyone in the chatroom to the site can hear me for important news or trades alerts.

All trade alerts are instantly posted in the members area, chat-room and sent via email making it one of the most powerful trading services I have seen available online.

If you are interested please fill out the form to be notified for this service which will start the last week of March or the first week of April. It will have limited availability to keep it personal:

Chris Vermeulen