Good morning, Lots of great analysis including Bitcoin today.
Executive Summary:
– Stocks set to gap higher and at short-term resistance. We will see if sellers jump back into the market and drive prices lower to fill the gap. Its Friday so if we have a weak close in price near the lows then Monday could be another huge sell-off.
– Bonds are trading a major long term resistance trend channel on the monthly chart. I would expect bonds to stall and pullback over the next few months. The video shows this very clearly.
– Metals are giving mixed signals and gold hit our key price target and resistance area yesterday for a quick 22% profit.
– Oil and natural gas are still in downtrends but not giving much insight at this time.
https://thegoldandoilguy.com/wp-content/uploads/2019/08/TTT-VIDEO-LOGO.png480640adminhttp://www.thegoldandoilguy.com/wp-content/uploads/2014/11/tgaoglogo.pngadmin2019-08-16 11:53:572019-08-16 11:53:57Today’s Stock, Metal, and Energy Forecasts – Aug 16 2019
This section of our multi-part article regarding current and past central bank actions, we are going to attempt to look at key elements of the past and present to highlight what we believe may turn out to be an incredible “setup” in the global markets.
This setup is almost like a complex chess game where two skilled players battle for control and near the end of the game, one player is left with the King, a Rook, and a Pawn while the other player has a dramatic advantage with stronger chess pieces. Yet, as the game continues, the weaker player is able to remove one or two of the stronger players key pieces and move his pawn to his opponent’s side to recover his Queen – thus altering the dynamic of the game and eventually winning.
This actually happened to me once playing against a friend of mine. My friend was so wrapped up in trying to move my King into checkmate, he left his other pieces open for me to target and remove – while leaving my Pawn untouched. After I had gained a clear advantage by removing his stronger pieces, I cornered his king within an area that allowed me to move my Pawn to his side of the board whereas I regained my Queen. At that point, the game was nearly over for him – and he knew it.
Did the US Fed and global central banks set up a similar type of process in the global economy? We can rephrase this question as did the global central banks inadvertently set up a massive credit/debt problem by attempting to pour capital into the global markets to spark an economic recovery? And did the acquisition of all of this debt/credit setup a “chase after the King” moment where foreign nations failed to understand the underlying risks associated with this move? Have the dynamics of the global markets shifted away from the advantages that were present three to four+ years ago?
So, let’s investigate the data to see what we can find out about what is changing in the markets.
One change that is critical to the understanding of consumer sentiment is the savings rates for consumers. Since the 2008-09 credit market crisis, Americans have started saving more of their income even though rates for savings have dramatically fallen. This is a shift in consumer sentiment that suggests consumers are attempting to put more cash into savings in preparation for some future event.
The Fed expects economic growth rates in the US to run at far lower levels than in 2011 and 2012. With all the capital that has been poured into the global markets, one would think growth rates would be moderately higher or climbing. But we believe the global economy is stuck in a mode where capital is unable to be effectively deployed throughout the globe because of inherent economic failures and processes that prevent future growth. We’ve discussed this in the previous article about how the US and global economies are stuck in a mostly 19th-century mode of operation while attempting to transition into a 21st-century mode of operation. This transition may take another 10 to 20+ year, but it will eventually happen.
Until that transition is completed, expect further bumps in the road as traditional expectations for investment and returns are shattered – forcing a move towards a 21st-century economic revival.
The price of commodities is a perfect example of how the 19th-century economy is purging itself while the new 21st-century economy is searching for a foundation/footing to take root. Oil is a prime example of the 19th-century economic foundation for growth and economic output. Yet in today’s world of solar, green and various other energy sources, Oil has fallen to near $52 ppb recently and could fall as low as $35 to $38 ppb in the future months. Considering Oil was recently above $120 bbp – what the heck happened?
This chart of the Index of All Commodities prices highlights the shift in capital and the shift in the economic mode of operation that is currently taking place. What was an increasing commodities price market in 2005~07 and 2010~12 has now been replaced with a decreasing commodity pricing market. Is this indicative of a collapse in the global economy? In some ways, yes. But we believe this is more indicative of a transitional economic shift away from 19th-century processes and functions and towards a more dynamic 21st century economic model for the globe.
This process, though, will be full of very large price swings, failures, successes, and opportunities for those skilled technical traders that are able to catch the moves and setup as they happen.
Lastly, the US Consumer Price Index chart. Notice how the GREEN highlighted area (from the early 1960s till 2000 were filled with positive CPI results? Notice how that changed in 2000 and how after 2000 the CPI levels fluctuated from positive to negative quite regularly? Now, pay attention to how the expansion of peaks immediately after the 2000 Dot Com bubble burst has been replaced with a contraction of peaks after the 2008-09 credit market crisis. What is causing the CPI to contract in this manner? Why is is that expansion of commodity pricing is unable to expand as it had been going for decades before 2008-09?
The key to understanding all of this is that the expansion prior to 2000 was an expansion fueled by rising wages, income, wealth creation and opportunity from a mature 19th-century economic model. The 1990 to 2000 narrow range in the CPI was related to the “early shift” away from the 19th-century economic mode and into the Dot Com (internet) mode of economic activity (where this new economic model was taking away from brick-and-mortar shopping malls and replacing it with virtual commerce activities. The recovery in 2005 was fueled by moderate quantitative easing in the US as well as a resurgence in more traditional economic functions related to the growth of economic opportunity in foreign nations, Europe and the push to expand digital technology throughout most of the developing world.
Then came the crisis of 2008-09, which was like blowing out 3 pistons of your V8 motor. You may still be able to limp the car around and back home, but you probably have to keep pouring high-octane fuel into it to keep it running and hope it does not blow out another piston or two.
This Custom Smart Cash Index chart is a perfect example of how capital works in the markets. It attempts to avoid risk by reducing exposure to risk events and attempts to pile into an opportunity as security and returns are setup for optimum outcomes.
Notice how in 2008 capital fled the global markets and how it slowly reentered the markets from 2011 to 2015. Pay attention to the dips in this Smart Cash Index and you’ll notice how these dips align with the US Fed and global central bank QE functions. Pay very close attention to the dip in 2015~2016. Why would cash want to avoid risks setting up during this time and what caused the global markets to fear excessive risks then? US Presidential elections – that’s what happened. And what is happening in November 2020? Yup – you guessed it.
Why would risks become so heightened at these times and throughout collapse events and where does capital rush into when these types of events happen?
CONCLUDING THOUGHTS:
In Part IV of this article, we’ll try to answer some of your bigger questions and we’ll explain why we believe an incredible opportunity is setting up for skilled technical traders over the next 24+ months.
Using technical analysis and proven strategies we can follow the market trends and profit from them no matter which the market moves. We bet with the market (the house) and provide entry, target, and stops for all trades we initiate.
NEXT MOVES FOR GOLD, SILVER, MINERS, AND S&P 500
In early June I posted a detailed video explaining in showing the bottoming formation and gold and where to spot the breakout level, I also talked about crude oil reaching it upside target after a double bottom, and I called short term top in the SP 500 index. This was one of my premarket videos for members it gives you a good taste of what you can expect each and every morning before the Opening Bell. Watch Video Here.
I then posted a detailed report talking about where the next bull and bear markets are and how to identify them. This report focused on gold miners and the SP 500 index. My charts compared the 2008 market top and bear market along with the 2019 market prices today. See Comparison Charts Here.
On June 26th I posted that silver was likely to pause for a week or two before it took another run up on June 26. This played out perfectly as well and silver is now head up to our first key price target of $17. See Silver Price Cycle and Analysis.
More recently on July 16th, I warned that the next financial crisis (bear market) was scary close, possibly just a couple weeks away. The charts I posted will make you really start to worry. See Scary Bear Market Setup Charts.
https://thegoldandoilguy.com/wp-content/uploads/2019/08/42.png342850adminhttp://www.thegoldandoilguy.com/wp-content/uploads/2014/11/tgaoglogo.pngadmin2019-08-14 12:20:572019-08-14 12:20:57Global Central Banks Move To Keep The Party Rolling – Part III
Our researchers have created this research post to highlight a big price move based on super-cycle research and patterns that should begin on or near August 19, 2019. Back in April/May 2019, we started warning of a critical top formation we believed was aligned for July 2019. In May/June, we altered this date to align more closely with our super-cycle research and determined the August 19, 2019 date.
It is our belief that this date will initiate a breakdown price move that may align with external news related or economic related data. Our research continues to point to the potential for a large global breakdown in equity prices related to some type of near-crisis event. It could be related to something within the US or outside the US – but either way, we slice it, August 19 looks to be the date we need to focus on.
– Crazy Ivan Market Prediction for Stock Market and Volatility Article
–Crazy Ivan Precious Metals Prediction Article
FANG Custom Index Weekly Chart
This FANG custom index weekly chart highlights how our Fibonacci Price Amplitude Arcs work in alignment with price rotation and trends. The theory behind this analysis is that price trends operate at a frequency and amplitude that we can map out – much like Tesla’s theory of Mechanical Resonance.
In our studies, we have learned how to identify relative price amplitude and frequency factors, then align these to price peaks and valleys. The result is that we can see where hidden support and resistance channels form and where the price will potentially reach an “inflection point”.
Right now, this week and next on this FANG chart are likely to see increased volatility and the potential for a price breakdown as the current RED arc level sets up a massive resistance channel.
Custom Smart Cash Index Chart
Our custom Smart Cash Index chart is also highlighting an overall weakness in the US and global markets. Once this chart breaks the lower price channel level, there is a very strong possibility that this index will break down toward the $134 level (or lower) as the global markets attempt to identify price support. Overall lows could target the $111 level (seeing in 2016) if the breakdown is excessive.
Custom Volatility Index
This Custom Volatility Index is suggesting a deeper price low is setting up if the August 19 breakdown date acts as we suspect. If the global markets break lower, then this Custom Volatility Index will be pushed into an extreme low territory (below 5.5) were a very deep bottom/base will setup (as we have seen before). If it reaches levels below 4.0, then we should be very close to a very deep “V” type bottom.
The recovery from this base/bottom will likely be somewhat extended as the shift in the capital around the globe seeks out the best, safest locations and returns. We believe this bottom will complete near the end of 2019 or into early 2020 where the US markets will quickly gain acceptance as the location for global assets to avoid extended risks.
What Does All This Mean?
August 19 is only a few days away and we could see fireworks start in the global financial market place.
If our analysis is correct, we have only 4 to 7+ days before a major breakdown in price starts and we are yet unsure of the source or intensity of this event if there is one. Multiple analysis types are pointing to August as a key turn date and the market could fall by as much as 16-25% if there is a trigger event to spark the crisis.
What should you do? Well, being a pilot, quasi engineer, and technical trader using logic, rules, and processes to do things. I always wait for the price to confirm a new trend before taking action and entering a position. This is how we profited last week from the SP500 index falling. We traded the 2x bear fund SDS and locked in a quick profit.
The days are long gone where I would buy or sell stocks or trends based on tips and forecasts. That type of trading is really called legal gambling and the odds generally are not in your favor unless you tips are coming from insiders who actually know something.
Using technical analysis and proven strategies we can follow the market trends and profit from them no matter which the market moves. We bet with the market (the house) and provide entry, target, and stops for all trades we initiate.
https://thegoldandoilguy.com/wp-content/uploads/2019/08/32.png561850adminhttp://www.thegoldandoilguy.com/wp-content/uploads/2014/11/tgaoglogo.pngadmin2019-08-13 10:49:382019-08-13 10:49:38August 19 (Crazy Ivan) Event Only A Few Days Away
In the first part of this multi-part technology sector research post, we highlighted our previous research and predictive modeling result that suggest the US and global stock markets are poised for a peak/roll-over within the next 30+ days. Our predictive modeling systems and cycle analysis tools are pointing to August 19, 2019, critical inflection date that we believe will become the “breakdown date” for this next big move to the downside.
Part of our effort to help skilled technical traders is to provide research posts, like these, that highlight trade setups and allow our followers to understand the type of trading opportunities that are present for them to consider in the future. We believe the next 30+ days will prove our predictions are accurate and that the US/Global stock markets will roll-over into a new bearish trend – likely breaking downward near August 19, 2019.
With this in mind, Part II will continue to explore trade setups and opportunities related to our belief that the NQ/Technology Sector will become one of the biggest rotations when this move happens.
NQ/TECS price prediction
Our downside NQ price prediction supports a hedging trade in TECS for skilled technical traders. If our predictions are accurate, then the risk levels for a strategic trade in TECS are only about 10% to 15% from current price levels and the upside profit potential is 12% to 35% (or more). We are actively seeking an entry price near recent lows in TECS (near $11 or lower) over the next 2+ weeks as we watch the US stock market continue to attempt to push to new highs.
TNA, Small Cap Bull ETF
The TNA, Small Cap Bull ETF, is often a leader for the US major markets. This Weekly chart highlights the weakness that is found in the Small Caps compared to the NQ chart above. While the NQ chart has continued to push higher, the TNA chart has rolled-over and has weakened substantially from the October to December 2018 rotation. It is our belief that the continued price weakness in the Small Caps will provide a leading price confirmation of the US major markets price rotation downward over the next few weeks and months.
We also believe the Transportation Index (TRAN) will lead the markets lower over the next few weeks and months. Skilled traders must learn to search for these market-leading triggers/signals to stay ahead of the next big price swings.
So, within this article, we’ve highlighted three incredible trading opportunities and setups for skilled technical traders. Each one is aligned to a single event that may happen in the future and each one varies in the price level, scale, and scope for different skill levels of traders. The opportunities for these types of trades in 2019 and 2020 keep setting up over and over again. We believe the next 2 to 3 years are going to continue to create incredible opportunities for us as technical traders. You can become a technical trader with us before Aug 1st if you ack now!
There are dozens of great trades setting up right now in preparation for the August 19 price peak/price rotation that we predicted months ago. The markets are setting up for some really big swing trades and we urge all traders/investors to be prepared for these moves by joining my Wealth Building Newsletter
5 other crucial warning signs about the US markets topping and the pending gold and silver bull market
In early June I posted a detailed video explaining in showing the bottoming formation and gold and where to spot the breakout level, I also talked about crude oil reaching it upside target after a double bottom, and I called short term top in the SP 500 index. This was one of my premarket videos for members it gives you a good taste of what you can expect each and every morning before the Opening Bell. Watch Video Here.
I then posted a detailed report talking about where the next bull and bear markets are and how to identify them. This report focused mainly on the SP 500 index and the gold miners index. My charts compared the 2008 market top and bear market along with the 2019 market prices today. See Comparison Charts Here.
On June 26th I posted that silver was likely to pause for a week or two before it took another run up on June 26. This played out perfectly as well and silver is now head up to our first key price target of $17. See Silver Price Cycle and Analysis.
More recently on July 16th, I warned that the next financial crisis (bear market) was scary close, possibly just a couple weeks away. The charts I posted will make you really start to worry. See Scary Bear Market Setup Charts.
CONCLUDING THOUGHTS:
In short, you should be starting to get a feel of where stocks are headed along with precious metals for the next 8-24 months. The next step is knowing when and what to buy and sell as these turning points take place, and this is the hard part. If you want someone to guide you through the next 12-24 months complete with detailed market analysis and trade alerts (entry, targets and exit price levels) join my ETF Trading Newsletter.
Be prepared for these incredible price swings before they happen and learn how you can identify and trade these fantastic trading opportunities in 2019, 2020, and beyond with our Wealth Building & Global Financial Reset Newsletter. You won’t want to miss this big move, folks. As you can see from our research, everything has been setting up for this move for many months.
Join me with a 1 or 2-year subscription to lock in the lowest rate possible and ride my coattails as I navigate these financial market and build wealth while others lose nearly everything they own during the next financial crisis.
As a technical analysis and trader since 1997, I have been through a few bull/bear market cycles. I believe I have a good pulse on the market and timing key turning points for both short-term swing trading and long-term investment capital. The opportunities starting to present themselves will be life-changing if handled properly.
FREE GOLD OR SILVER WITH MEMBERSHIP!
Kill two birds with one stone and subscribe for two years to get yourFREE PRECIOUS METAL and get enough trades to profit through the next metalsbull market and financial crisis!
Chris Vermeulen – www.TheTechnicalTraders.com
https://thegoldandoilguy.com/wp-content/uploads/2019/07/55-1.png470850adminhttp://www.thegoldandoilguy.com/wp-content/uploads/2014/11/tgaoglogo.pngadmin2019-07-30 17:46:392019-07-30 17:46:39(Part II) Us Stocks Seem To Be Following Our Predictions – Get Ready
https://thegoldandoilguy.com/wp-content/uploads/2019/07/silverstock.jpg7501000adminhttp://www.thegoldandoilguy.com/wp-content/uploads/2014/11/tgaoglogo.pngadmin2019-07-23 11:50:132019-07-23 11:50:13Silver Price Forecast: What The Next Silver Rally Should Look Like
Our researchers rely on a number of proprietary tools and cycle forecasting technology. Additionally, we use custom index charts to help measure price cycles, trends, support & resistance and many other aspects of the markets. Recently, we posted an article relating to the US Dollar and foreign currencies using custom index techniques. In the past, we’ve highlighted our Custom Price Cycle index that we use to gauge market sentiment, topping and bottoming setups. All of these tools are essential for our team of researchers while they attempt to identify trade setups and larger market events.
Currently, we are highlighting a number of our custom index chart that suggest a market top may only be 3 to 5 weeks away and the setup of this market top may surprise many traders. We posted a good forecast chart here also.
First, we’ll highlight our Smart Money Custom Index chart on a Monthly charting basis. As you can see since the ultimate price bottom in 2009, and using the price range from 2015 to 2016 (the rotation prior to the 2016 Presidential Elections) as the basis for the forward envelope, our Smart Money index shows the markets have rallied to levels just above the envelope in January 2018, then rotated lower to levels near the lower envelope levels in December 2018. This extended price rotation suggests the entire year of 2018 prompted a massive price rotation event that likely resulted in a price revaluation cycle.
Our researchers believe the strength of the US Dollar will continue to drive foreign investments into the US stock market and prompt a rally to levels near the middle of this price envelope before stalling and topping in August or September of 2019. This top formation should result in a price decline in the US stock market of at least 16% with a maximum decline level of somewhere between 24% to 28% overall. We’ll get into more detail about that later in this article.
We want our readers to understand this Custom Price Cycle chart highlights the level at which the price bottom will likely form, near the lower level of the current price envelope, and suggests the current price rally will likely attempt to breach key psychological price levels ($300: SPY, $3000: ES, $30k: INDU) before this new price top completes.
After these new price highs are reached above the key psychological price levels, we believe the new price top will immediately begin to form with a short period of sideways price action, then a price decline back below these psychological levels and likely initiating a downward price decline of at least 11 to 13%. It is our opinion that this downward price decline in the US stock market will align with increased global market weakness and currency devaluations that are likely to be much greater in scale and scope than the US stock market price decline.
We believe the US Dollar will continue to stay strong while staying above $95~96 throughout most of this price decline. We believe the strength in the US Dollar may be a catalyst for the future global market price declines and may also play out in future activities in precious metals and commodities.
The strength of the US Dollar, while foreign markets are contracting, would present a very ominous event as debt, credit and future operational standards of many foreign corporations, nations, governments, and consumers could come under severe pressures.
This Custom Price Cycle chart, below, highlights the current price setup of the US stock market in relation to previous high and low points. The closer we come to the upper price channel, the more likely we are to see price setup and seek out a price top formation. Although, history has shown that price can move up to these upper levels and continue to trend in an upward price channel for many weeks and months. So, at some point in the future, we would expect to see this Custom Price Cycle chart revert back to 2017 type price activity where price continually attempts to stay near the upper price channel levels with very mild price rotations.
Currently, though, we believe the US stock market is only 3 to 5 weeks away from a major price topping formation and that the downside price move will likely result in a, roughly, -16% to -25% downside price rotation before the end of 2019. We believe US earnings will push this Custom Price Cycle chart to levels near or above the upper price channel level and that will drive the US Dollar higher as well as a shift in capital deployment prior to the end of September. The shift will be away from technology and mid-caps and into the safety of cash, metals and large-cap equities.
This shift in capital investments will likely transpire over many weeks before a serious price breakdown begins. In other words, we expect a top formation to setup somewhere between August 15 and September 16. This top formation will likely result in 3~6 weeks of sideways downward pricing pressure before a larger price breakdown happens. We believe the larger price breakdown will coincide with some external economic event and result in a migration of capital away from risk and into cash/metals/safety. Right now, our estimate is that this external economic event may be a currency devaluation event (Asian currencies breaking down and putting pressure throughout Europe and the rest of the developing world).
It is very likely that some issue related to the US/China trade deal prompts this currency devaluation move or that some extended credit/debt crisis event becomes more evident to investors. We believe the Asian currencies are particularly at risk for this event and that European and development market currencies will likely collapse as a result of the Asian/European currency price declines.
The US technology sector could be uniquely vulnerable should this event unfold as we suspect. Foreign markets and investor are heavily invested in the US technology sector. Many of these investors have moved their capital into the US Technology sector to avoid risks related to their home country’s currencies and to take advantage of the US Dollar strength. A decline in the US stock market, of any level greater than 10%, could send a shock-wave through the global markets and cause investors to shift away from risk and into safety.
Expect to see the volatility index to start rising and for the price of options to jump as well. I posted this VIX chart and cycle analysis a couple of days ago and its good for another few weeks in terms of its direction.
IN CONCLUSION:
Our researchers believe we are only a few weeks away from this event and those Q2 US earnings will push the US stock market above these psychological price levels. It is this event, the push above the key psychological price levels ($ 300: SPY, $ 3000: ES, $ 30k: INDU) that will likely trigger the topping event and set off a chain reaction event that we have described.
Pay very close attention to how the foreign currency market reacts over this time-span and pay very close attention to Gold/Silver and the US Dollar. We believe this topping price formation is going to unfold just as we are suggesting and we believe this will be an incredible opportunity for skilled technical traders.
We’ll keep you informed as this plays out with Wealth Building & Global Financial Reset Newsletter if you like what I offer, join me with the 1 or 2-year subscription to lock in the lowest rate possible and ride my coattails as I navigate these financial market and build wealth while others lose nearly everything they own during the next financial crisis. Join Now and Get a Free 1oz Silver Round or Gold Bar Shipped To You!
I can tell you that huge moves are about to start unfolding not only in metals, or stocks but globally and some of these supercycles are going to last years. A gentleman by the name of Brad Matheny goes into great detail with his simple to understand charts and guide about this. His financial market research is one of a kind and a real eye-opener. 2020 Cycles – The Greatest Opportunity Of Your Lifetime
As a technical analysis and trader since 1997, I have been through a few bull/bear market cycles. I believe I have a good pulse on the market and timing key turning points for both short-term swing trading and long-term investment capital. The opportunities are massive/life-changing if handled properly.
IM GIVING THEM AWAY WITH 2-YEAR MEMBERSHIPS
So kill two birds with one stone and subscribe for one or two years to get your FREE BULLION and enough trades to profit through the next metals bull market and financial crisis!SUBSCRIBE -> GET FREE BULLION -> GET WINNING TRADES
Chris Vermeulen – Technical Traders Ltd
https://thegoldandoilguy.com/wp-content/uploads/2019/07/110.png508850adminhttp://www.thegoldandoilguy.com/wp-content/uploads/2014/11/tgaoglogo.pngadmin2019-07-11 12:38:022019-07-11 12:38:02Major Index Top In 3 to 5 Weeks?
As a technical analyst since 1997 for Technical Traders Ltd., I believe gold is entering the final leg of an advanced upside price wave formation that will ultimately target $1650 to $1750 in the coming months BUT…
https://thegoldandoilguy.com/wp-content/uploads/2019/07/75.png221400adminhttp://www.thegoldandoilguy.com/wp-content/uploads/2014/11/tgaoglogo.pngadmin2019-07-05 15:31:272019-07-05 15:31:27Gold Forecast: Gold Is Going Parabolic And Which Way Up Or Down?
In fact, there are several super cycles starting to take place as we head into 2020 and beyond which Brad Matheny and layout in our new book: 2020 Cycles – The Greatest Opportunity Of Your Lifetime
If you wanna become a technical trader with use and trade ETFs then be sure to join our Wealth Building Newsletter today and get our daily video analysis and swing trade alerts. In the past 17 months, our newsletter trade signals have generated 91% ROI for its subscribers, be sure to join before the markets start making new big moves and profit with us!
Chris Vermeulen www.TheTechnicalTraders.com
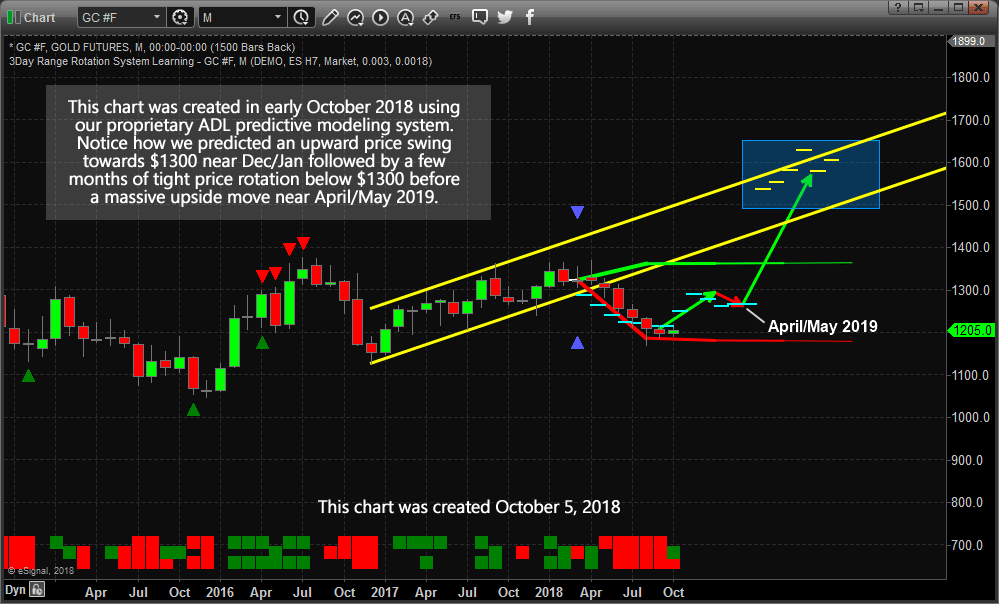
We’ve been trying to alert all of our followers of the setup in precious metals for well over 6 months. Here is our research post from February 6, 2019 (nearly 4 months ago) that highlights our prediction of an April 21~24 momentum base and our earlier calls predicting a move above $1300, then a stall and move lower towards the base in April, then the next leg higher.
This is a delayed video sample of what I share with members to my Wealth Trading Newsletter each and every morning
before the market opens. Learn, Be Alerted, and Profit!
https://thegoldandoilguy.com/wp-content/uploads/2019/05/chart13-1.png6821024adminhttp://www.thegoldandoilguy.com/wp-content/uploads/2014/11/tgaoglogo.pngadmin2019-05-13 11:25:202019-05-13 11:25:20How To Trade The Current Market Volatility/Crash/Recovery