Silver Should Pause At $16.75 Before Next Rally Starts
Our advanced Fibonacci price modeling system is suggesting that the current Silver rally may be nearing a point where the price will pause and retrace a bit before advancing further. The incredible breakout rally over the past few weeks in Silver was a real surprise for many investors. The sleepy shiny metal that everyone thought was dormant broke well above the $15.50 level on huge volume and continued to rally to levels near $16.65.
We published some incredible research regarding the longer-term potential for precious metals – specifically the potential for Silver as the Gold/Silver ratio continues to decline. Please take a minute to read this research post PART I.
We believe the upside potential for Silver is, at a minimum, targeting $26 to $34 for an immediate upside price objective. Overall, longer-term, we believe Silver could rally well above $50 as the Gold/Silver ratio falls to levels below 65.
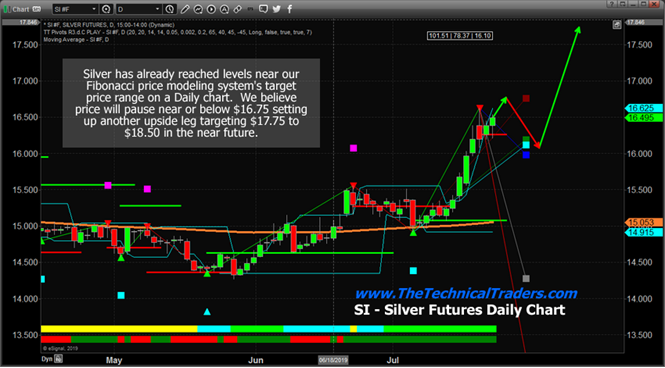
This Daily Silver chart highlights our Fibonacci price modeling system and shows you that price has already reached the upside price objectives for this current expansion leg. Sometimes price may rally beyond these levels (in extreme trending), but we believe the recent pause in the rally suggests the price will rotate lower (to levels near $16) before attempting another upside rally leg. We’ve highlighted what we believe will happen with arrows on the chart and we believe the next leg higher will align closer to the early August time-frame.
This Weekly Silver chart also highlights our Fibonacci price modeling system, yet it shows the longer-term price modeling results. Overall, the CYAN level, near $16.65, is acting as our first level of moderate price resistance. We believe the support from the previous price peak, drawn as a MAGENTA LINE, will act as support and price will rotate between current levels and this support level before forming a momentum base and attempting to move higher – targeting the $18 to $18.50 level.
Take advantage of this price rotation before the next move higher. Silver is extremely undervalued in comparison to Gold. Any reversion of the Gold/Silver ratio, which is already taking place, will mean that Silver will rally 30% to 60% faster than Gold rallies. This will happen because the disparity in price between Gold and Silver has reached an extreme level. As precious metals rally, this disparity level decreases. Silver moves higher much quicker because it continues to be extremely undervalued compared to Gold and is more affordable nicknamed “poor man’s gold”.
There are dozens of great trades setting up right now in preparation for the August 19 price peak/price rotation that we predicted months ago. The markets are setting up for some really big swing trades and we urge all traders/investors to be prepared for these moves by joining my Wealth Building Newsletter
If you want to see 5 other crucial warning signs about the US markets topping and the pending gold and silver bull market just take a look at this short video and charts.
In early June I posted a detailed video explaining in showing the bottoming formation and gold and where to spot the breakout level, I also talked about crude oil reaching it upside target after a double bottom, and I called short term top in the SP 500 index. This was one of my premarket videos for members it gives you a good taste of what you can expect each and every morning before the Opening Bell. Watch Video Here.
I then posted a detailed report talking about where the next bull and bear markets are and how to identify them. This report focused mainly on the SP 500 index and the gold miners index. My charts compared the 2008 market top and bear market along with the 2019 market prices today. See Comparison Charts Here.
On June 26th I posted that silver was likely to pause for a week or two before it took another run up on June 26. This played out perfectly as well and silver is now head up to our first key price target of $17. See Silver Price Cycle and Analysis.
More recently on July 16th, I warned that the next financial crisis (bear market) was scary close, possibly just a couple weeks away. The charts I posted will make you really start to worry. See Scary Bear Market Setup Charts.
CONCLUDING THOUGHTS:
In short, you should be starting to get a feel of where stocks are headed along with precious metals for the next 8-24 months. The next step is knowing when and what to buy and sell as these turning points take place, and this is the hard part. If you want someone to guide you through the next 12-24 months complete with detailed market analysis and trade alerts (entry, targets and exit price levels) join my ETF Trading Newsletter.
Be prepared for these incredible price swings before they happen and learn how you can identify and trade these fantastic trading opportunities in 2019, 2020, and beyond with our Wealth Building & Global Financial Reset Newsletter. You won’t want to miss this big move, folks. As you can see from our research, everything has been setting up for this move for many months.
Join me with a 1 or 2-year subscription to lock in the lowest rate possible and ride my coattails as I navigate these financial market and build wealth while others lose nearly everything they own during the next financial crisis.
As a technical analysis and trader since 1997, I have been through a few bull/bear market cycles. I believe I have a good pulse on the market and timing key turning points for both short-term swing trading and long-term investment capital. The opportunities starting to present themselves will be life-changing if handled properly.
FREE GOLD OR SILVER WITH MEMBERSHIP!
Kill two birds with one stone and subscribe for two years to get yourFREE PRECIOUS METAL and get enough trades to profit through the next metalsbull market and financial crisis!
Chris Vermeulen – www.TheTechnicalTraders.com
https://thegoldandoilguy.com/wp-content/uploads/2019/07/45-1.png368665adminhttp://www.thegoldandoilguy.com/wp-content/uploads/2014/11/tgaoglogo.pngadmin2019-07-30 11:16:072019-07-30 11:16:07Silver Should Pause At $16.75 Before Next Rally Starts