
Option Skew Points to More Downside Potential in the Nasdaq

By now it is no secret that equity markets continue to deliver solid gains for 2014. In fact, all of the major U.S. domestic stock market indexes are higher for the year. U.S. equities have benefited from an accommodating Federal Reserve, massive corporate stock buy-back plans, and solid earnings growth. The bullish trend which began in early 2009 has pushed equity indexes to several all-time highs.
However, when we focus our attention on 2014 one index is showing major relative out performance. The Nasdaq Composite and the Nasdaq 100 indexes have blown away every other major index in terms of overall returns in 2014. The chart shown below illustrates the returns of each major U.S. equity index year-to-date.
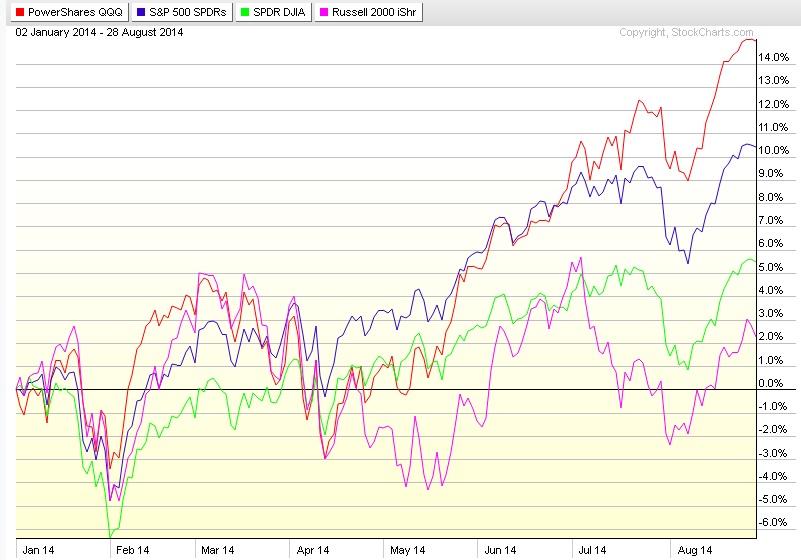
As can be seen above, when looking at the corresponding ETF for each major index, the Nasdaq 100 (QQQ) is running away from every other major index in terms of performance. As a contrarian trader, I am of the opinion that now may be an excellent time to consider looking for a possible short position to hedge against the bullish trend.
The equity markets in the United States are becoming frothy and prices are at the very least fair valued if not overvalued depending on which methods are used to calculate current prices. When we consider the major out performance in the Nasdaq 100 Index, it would only make sense that if we see downside in the future we could capture some big potential profits.
As an option trader who focuses primarily on probabilities for trade executions using a variety of implied volatility calculations and Delta assumptions, the following observations regarding the Nasdaq 100 Cash Index (NDX) were derived based on data points on Friday, August 29th.
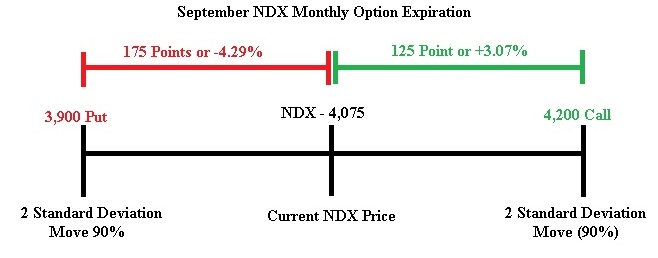
Based on the September NDX option expiration date, the current skew in the NDX option data is to the downside. In fact, as I am typing this NDX is trading around 4,075. A 2 standard deviation move to the upside (90%) is around the 4,200 call strike and the same measurement to the downside is around the 3,900 put strike.
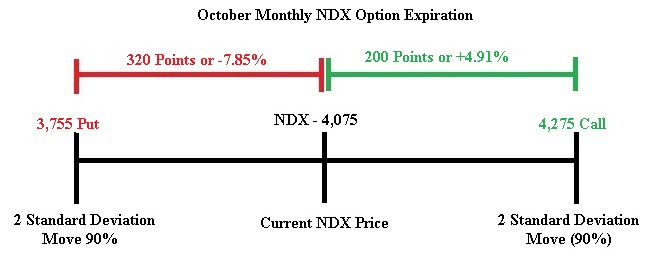
When looking at the same data based on the October NDX option expiration date, the current skew in the NDX option data demonstrates more aggressive downside Skew in October versus September. A 2 standard deviation move in the October series to the upside (90%) is around the 4,275 call strike and the same measurement to the downside is around the 3,755 put strike.
While I realize this is somewhat technical, the main premise is that the option market in the Nasdaq 100 Cash Index (NDX) is skewed toward more potential downside risk. This data lead me to place a new trade earlier this week which was next short the Nasdaq 100 Cash Index (NDX) using an October Call Credit Spread as a trade structure.
Recent results for the service have been very strong for the options alert service. The last 4 trades have produced a 13.95% winner in Matador Resources (MTDR), a 17.05% winner in the S&P 500 Cash Index (SPX), a small 1% loss in the Nasdaq 100 (QQQ), and a 21.95% in the Russell 2000 Cash Index (RUT). The options newsletter service is priced super affordable at just $29.99 per month with new trade alerts sent out almost daily.
Ultimately time will tell if the skew in the NDX proves to work. For now, I like the near 75% probability of success that the NDX Call Credit Spread is offering with a nearly 20% potential return. In the future readers can expect a recap of this trade. Happy Trading!
Chris Vermeulen
www.thetechnicaltraders.com/options/

