
METALS ARE FOLLOWING DOWNSIDE SELL OFF PREDICTION BEFORE THE NEXT RALLY
It is absolutely amazing how the precious metals markets have followed our October 2018 predictions almost like clockwork. Our call for an April 21~24 momentum base below $1300 followed by an extensive rally to levels above $1550 has been playing out almost like we scripted these future price moves.
Now that the $1550 level has been reached, we are expecting a rotation to levels that may reach just below the $1490~1500 level before attempting to set up another momentum base/bottom formation. And just like clockwork, Gold has followed our predictions and price is falling as we expected. Just look at our October 2018 chart where we forecasted the price of gold rallies and corrections along the way.
GOLD FORECAST & IS THE DEBT CRISIS ABOUT TO BE REBORN IN 2020?
https://www.thetechnicaltraders.com/is-the-debt-crisis-about-to-be-reborn-in-2020/
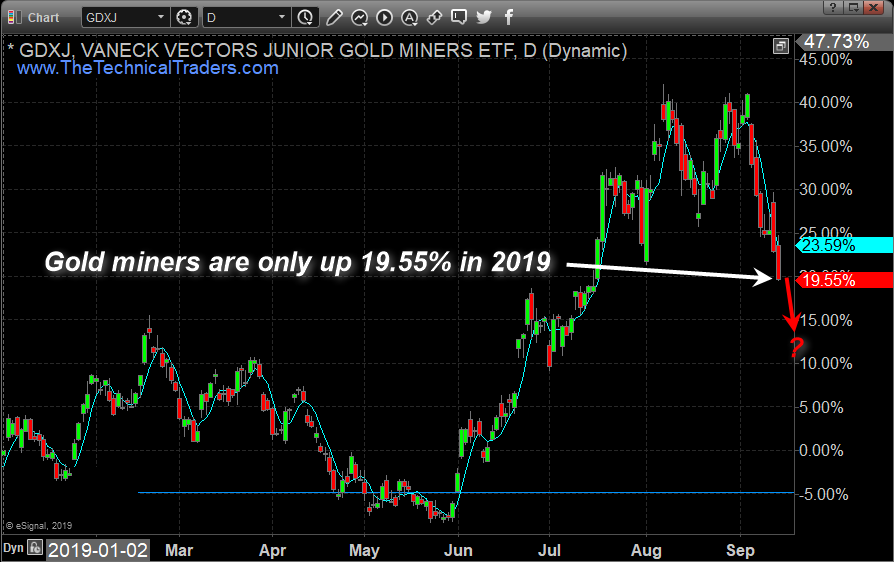
GOLD MINERS SELL OFF – DAILY CHART
Unfortunately, so many traders are highly emotional and fall in love with positions in shiny metals or gold miner stock positions. Yet we all know if you trade on emotions or fall in love with a position, you are most likely to lose a ton of money. Two weeks ago I got so much flack from traders when I said gold miners were on the verge of a violent drop in price, then the bottom fell out and the dropped huge. Then last Thursday morning when gold, silver, and miners are trading up huge in pre-market and at the opening bell I warned it looked like a big fakeout and price could collapse for yet a second leg down and the same response from those emotional traders who love their positions and won’t sell them when they should as active traders.
The downside rotation currently in Gold is likely not quite over yet and the gold mines will selloff the most. This new momentum base should setup and complete above $1455~1465 as a true Fibonacci price rotation completes. The next upside price leg should push Gold well above the $1760~1780 level – so get ready for another big rally of 20%+.

CAN YOU OUTPERFORM THE GDXJ?
If you like to trade in the precious metals sector then you most likely love to trade the gold miners ETF GDXJ. As you can see above GDXJ is only up 19.55% year to date. Sure, it’s a nice gain, but are you still holding your metals position knowing you just gave back most or all of your profits?
Being a technical analyst my focus is to only enter a position when the charts/analysis point to an immediate price advance or decline. I site in cash waiting for the next cycle top or bottom to form in an asset class like gold miners, gold, silver, or silver miners, and once the cycle starts I jump on the wave and ride it for the move until it shows signs that its weakening and will break. almost 50% of the year my portfolio is sitting in cash. And my average position only lasts around 12 days.
Take a look at all my precious metals related trades this year (2019) below. They are all winners, and total gain for subscribers of my Wealth Building Newsletter is 41.74% profit. More than double the return than if you were riding the GDXJ roller coaster for 9 months straight and all your money at risk.
My point here is that no matter how much you love metals (and I LOVE METALS), but you do not need to always be in a position in them. There are times to own, and times to watch with your money safely in cash.

GOLD EXPECTATIONS – DAILY CHART
The one aspect of all of this that all skilled technical traders need to keep in mind is that this initial upside price move in precious metals is very indicative of extended fear and greed in the global markets. We all need to understand how every upside move of $10 in Gold related to a new, high, extreme fear level related to the global markets. The bottom in Gold, near November 2016, was in relation to fear that the global markets would become, potentially, rattled by the new US president. The continued upside move in Gold is less of that extended fear as we are entering the new US 2020 presidential election cycle. At this point, it is related to the fear that the global markets have extended beyond means to sustain future growth expectations and that central banks may be losing control (and the ability to manipulate) the global financial markets.
The end result is that the fear and greed that is starting to show up in the precious metals markets may become an “unruly beast” if it continues to grow in strength and velocity.

SILVER EXPECTATIONS – DAILY CHART
Our expectations with Silver was that it would stall just below $17, rotate downward briefly and then begin another upside move – somewhat inline with Gold. What really happened is that Silver prices extended to levels just below $20 before weakening. This is partially due to the fact that metals suddenly became more “in focus” for global investors and also partially due to the fact that Silver suddenly became a “hot topic” because of the Gold/Silver ratio that continued to stay above 86~89. Once traders realized the incredible value that Silver really presented – it seemed everyone started piling into the silver trade and we believe this increased volume drove prices towards the $20 level.
Still, Silver has recently rotated lower again, moving to levels below $18 and following Gold into a momentum basing pattern. We do believe Silver and Gold may have a bit further to go to the downside before really finding support. Our researchers believe Silver may target the $17 price level before completing the momentum base. If this is the case, skilled traders should look for opportunities below $17.40 and get set up for the next upside price leg.

Keep reading our research because our proprietary tools have been nailing all of these price targets and moves many months in advance. The next bottom in metals should set up within the next 10~15+ days – then the next upside leg will begin. This time Gold should target $1800 and Silver should target $21 to $24. This will be an incredible move higher if it plays out as we suspect.
I urge you visit my Wealth Building Newsletter and if you like what I offer, join me with the 1 or 2-year subscription to lock in the lowest rate possible and ride my coattails as I navigate these financial market and build wealth while others lose nearly everything they own during the next financial crisis. Join Now and Get a Free 1oz Silver Round or Gold Bar!
I can tell you that huge moves are about to start unfolding not only in metals, or stocks but globally and some of these supercycles are going to last years. A gentleman by the name of Brad Matheny goes into great detail with his simple to understand charts and guide about this. His financial market research is one of a kind and a real eye-opener. PDF guide: 2020 Cycles – The Greatest Opportunity Of Your Lifetime
As a technical analysis and trader since 1997, I have been through a few bull/bear market cycles. I believe I have a good pulse on the market and timing key turning points for both short-term swing trading and long-term investment capital. The opportunities are massive/life-changing if handled properly.
Chris Vermeulen
www.TheTechnicalTraders.com


