
Member’s Pocketed 5% on Natural Gas Bounce with Signature Candle & Volume Pattern
During the last couple weeks the SP500 index has been taking a beating leaving many traders left holding the bag at high prices.
Fortunately, I cover several different investments so we when one is not giving us a trade, another one should be.
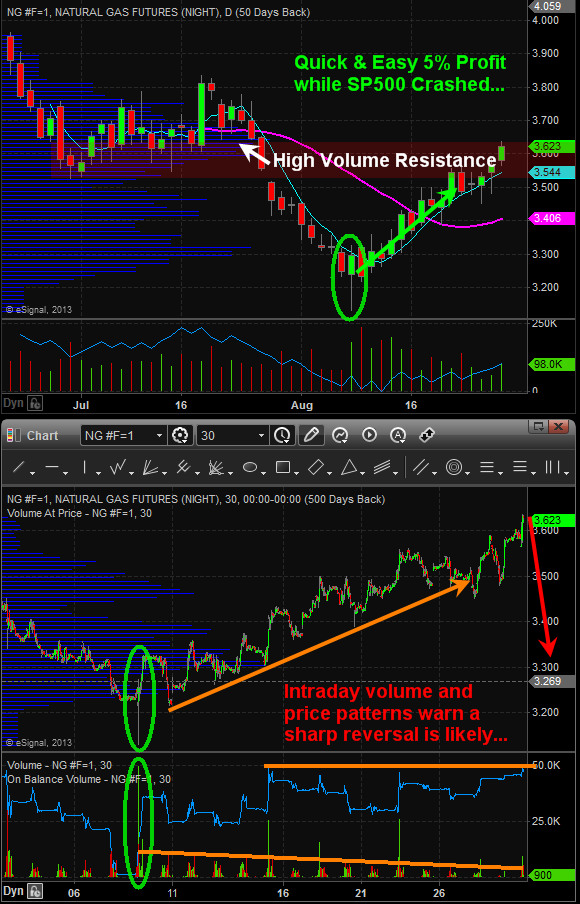
Taking a look at the technical analyst trading charts below you will see how a simple reversal candle coupled with volume can generate low risk and highly effective trades that move in your favor quickly.
If you want to learn how to read and trade the charts like a pro, be sure to join my daily video analysis newsletter which is jam packed with trading education and tradable ideas each day.
Join Today! www.TheGoldAndOilGuy.com