How to Play the Current Silver, Gold and Dollar Reversal
This has been an interesting week for traders and investors as precious metals melt down on the back of a rising dollar. Equities on the other hand bucked the trend and moved higher as they get bought into earning season. Once the earnings start to be released we should see the market get sold on the good numbers and retail traders will buy into the good numbers as the smart money selling their shares while there is liquidity in the market.
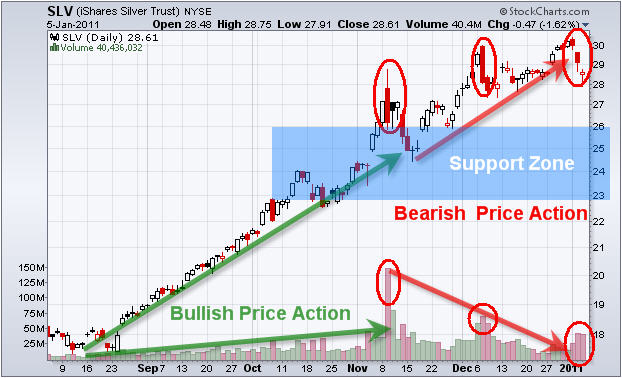
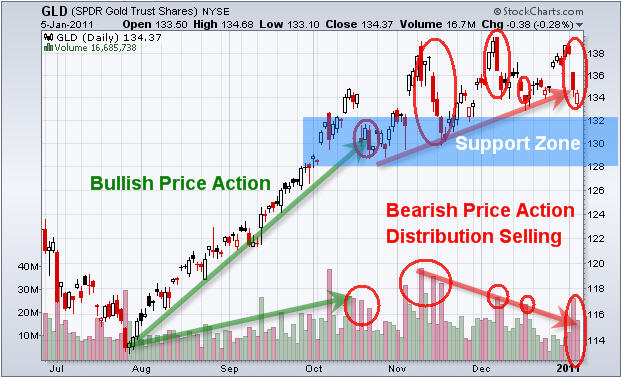
Speaking of pullbacks, I have been talking about silver and gold forming a top. A couple months ago in November I saw the first warning sign of distribution selling in the precious metals sector. There was a large drop in price with heavy volume which is a warning sign that the BIG MONEY is starting to roll out of that crowded trade (precious metals). The thing with tops is that they take a long time to form and become very choppy.
Since the November highs both silver and gold have more or less traded sideways. They never really went much higher and that’s because the big money is distributing their shares to smaller investors slowly overtime (retail buyers/average Joe’s). They try not to scare investors off so they sell their positions in chunks. What most people do now is that these sellers want higher highs to forming because once a new high has been created everyone become bullish again buying more on the breakout. It’s these waves of bullishness that the big money sells into which is why you see heavy volume after a new high has been formed.
Let’s take a look at some charts….
Silver Daily Chart
The silver chart clearly shows the bull market (markup phase) and also the distribution phase taking place now…. If things go according to plan then choppy/lower prices should take place in the coming 1-4 months.
Gold Daily Chart
Gold is doing the same thing as silver and I don’t think the selling is over yet.
Watch today’s video and price action: http://www.thetechnicaltraders.com/etftradingvideos/TTT192/TradingReport.html
Dollar Daily Chart
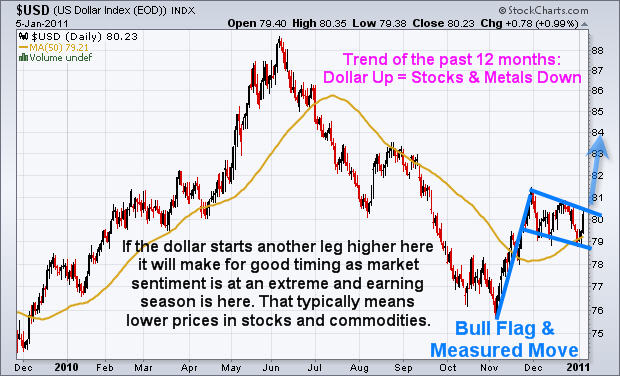
The past 12 months it seems like everything has been a dollar based play. Meaning if you were to pull up a 1 minute chart of the dollar and a 1 minute chart of the SP500 or Gold, you would now that when the dollar moves up stocks and commodities go down and vise-versa. That being said the SP500 has started to move up with the dollar in the past month so there is a shift happening but it’s a slow change and is not much of a concern for gold right now.
If the dollar starts another leg higher it will make for good timing as market sentiment is at an extreme and earning season is here. That typically means lower prices in stocks and commodities.
Mid-Week Silver, Gold and Dollar Trading Conclusion:
In short, in the next 1-4 weeks I am bullish on the dollar, and bearish/neutral on stocks and commodities. The reason I’m neutral is because I don’t like to short things in a bull market phase as they can keep going up much longer than we think at times. Rather hold my strong positions and wait for a correction to buy/add once I feel the selling momentum has stopped later this year.
I would not be surprised if we get a 4-10% drop in the next few weeks in both stocks and commodities, but until I see a clear roll in price I will not be looking for any trades to the down side. I’m not in a rush to pick a top/short the market but if we get a setup we will take a small position to play a falling market. Be sure to visit the link to today’s video which is posted in the gold chart section above.
Get my FREE Book, Pre-Market Trading Videos, Intraday Updates and Trades here: http://www.thegoldandoilguy.com/trade-money-emotions.php
Chris Vermeulen


