Gold and Oil on the Verge of Something Big – Hero’s Rarely Win
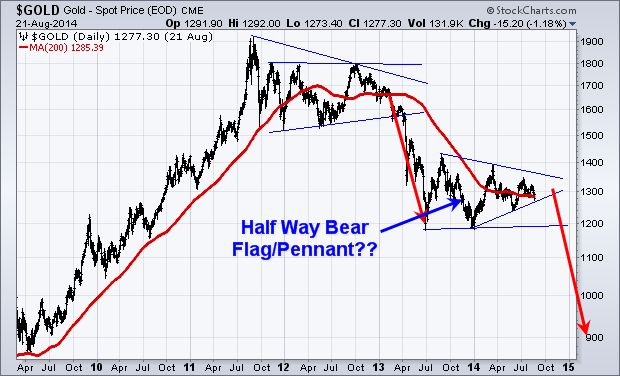
Everyone has been calling for a bottom in Gold the last year. But the fact is that gold and gold stocks are still clearly in a bear market. Just look at the 200 day moving averages. The previous trends were down and prices have been moving sideways for the past year.
A lot of newsletter and analysts are calling a bottom. Technically it’s just a consolidation pattern. Consolidation patterns are a continuation pattern, meaning if the previous trend was down, which it was from 2011 till now, the odds favor price will continue lower after this consolidation.
If this consolidation does happen to be the bottom then we can classify it as a stage I base. Gold and gold stocks will start a new bull market, but price needs to break to the upside of this consolidation pattern. Until it breaks to the upside, it is still in a down trend.
Gold topped out over three years ago. And I am in no rush to try to pick a bottom and be a hero here. I’m just going to continue waiting on the sidelines until price confirms either a new bull market has started or for price to breakdown and we get another leg lower.
Oil Outlook
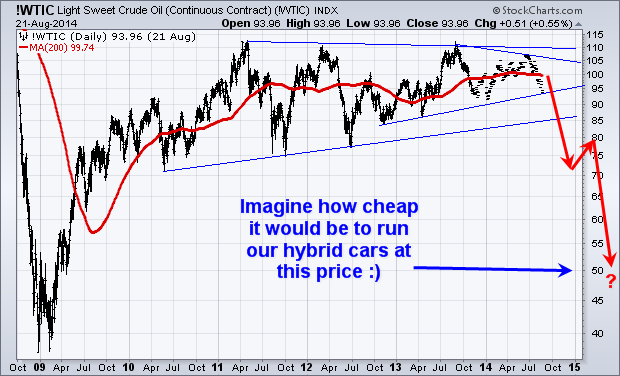
Taking a look at the big picture of crude oil the chart looks bearish. It too has been trading in a range since 2011 and the price is nearing the apex of a consolidation pattern.
It’s important to know that a pennant formation which is what crude oil has formed are the most predictable when price breaks out of the pattern within the first 1/3rd of the formation.
The longer price consolidates and gets squeezed into the narrowing apex of the pennant pattern, the more unreliable. The trend breakout will be, and it becomes at best a 50/50 bet.
Crude oil’s previous trend was up, but it’s been consolidating for such a long time that price is now squeezed into the apex. This negates that bias for the previous trend to hold true so we have no idea which why it will breakout but when it does expect an explosive move.
A breakdown in crude oil will send price to the $70 or $75 per barrel range, and that will hammer on the Canadian dollar also. I can see $1 USD being equivalent to $1.20 Canadian in a year.
My Gold and Oil Conclusion
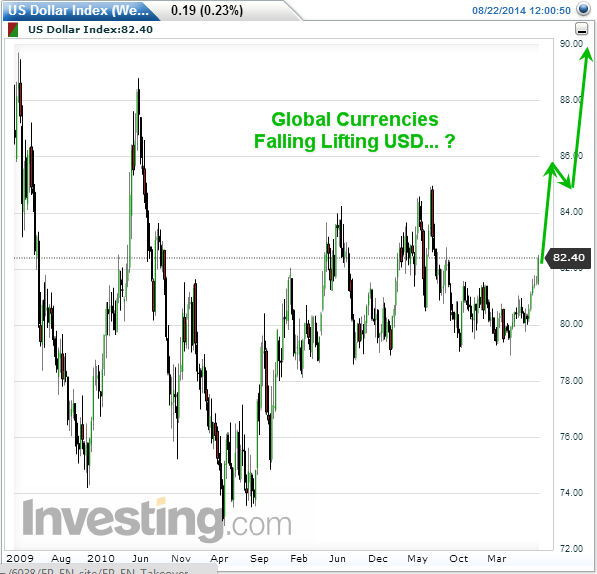
Looking at the US dollar, it has been rising partly due to the euro falling. This strong dollar will put a downward pressure on commodities overall.
Gold and oil have not been that exciting for investors since 2011 when they topped out, but both are setting up for massive moves that should last month, if not year or more. Once these new trends emerge expect to see them in the headline news every hour.
It does not matter which way these commodities breakout of the consolidation patterns. With the dollar continuing to rise and the bearish chart patterns for both gold and oil there is a good chance much lower prices are ahead.
This will catch most investor’s off guard. It’s human nature to try to predict tops and bottoms in the market. But this is why most investors get caught on the wrong side of the market. The market always has a way of catching the majority of people on the wrong side of a position.
I am happily sitting in cash with some of my investment capital waiting for gold and oil to breakout of these large patterns. I would not be surprised if we see $900 gold, gold stocks like the gold bugs index $HUI to be at $150, and $70 per barrel for crude oil. I am not saying this is what I want, but you should be mentally prepared so you can get back into cash position and so you can take advantage of falling prices with me.
Big money will be made on the next price movements in these commodities. Whether we have to go long the market or short sell the market. Either way, we can make money. So don’t be a hero and try to pick a top or bottom, just wait for confirmed breakout then invest with the trend.
Would you like my trade alerts CLICK HERE
Want my SP500 trades executed for you in your brokerage account CLICK HERE
Charting your way to financial freedom,
Chris Vermeulen


