
Crude Oil Slides to Multi Year Lows and What to Expect

Looking back to 2007 (seven years ago) we have seen the price of crude oil perform incredible price swings. No matter the time frame in which we observe price when an extreme price spike takes place due to news/event, statistics show that half if not all the event driven price spike will eventually be negated in the future.
The perfect example of this is the rubber band affect. If you pull an elastic band in one direction, eventually when it breaks or it’s released, the band will retrace back to the norm and then go in the opposite direction. You can see this on the chart from 2008 high of nearly $150 to the 2009 low of $40. Price then lost is momentum and has been somewhat range bound from 2011 – 2014 right in the middle at $95 per barrel.
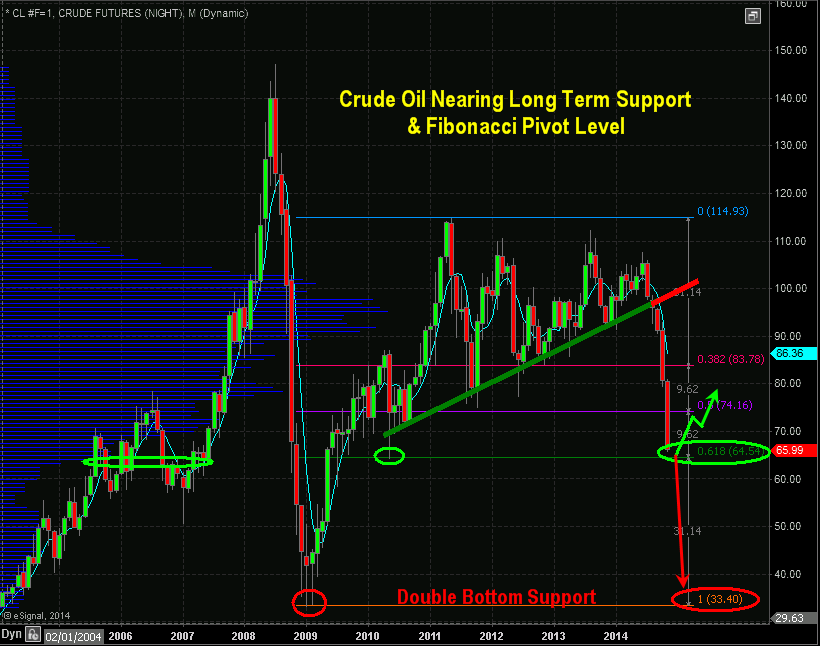
Observing the price chart of oil below there are many technical indicators and patterns at play. The first important pattern to identify is the series of higher lows shown with the green trend line sloping upwards.
A rising trend line that has multiple pivot lows (bounces up the trend line) the price of oil creates what I call a perfect storm for waterfall type selloff. This is exactly what we have seen over the past 3 months.
Each time one of the pivot lows are breached, the stop loss orders are triggered for investors. This causes a flood of sell orders forcing price lower to fall below the next pivot low etc… This may look and sound easy to trade, but keep in mind this is a monthly chart, and short term traders are not trading this long term time frame. Only investors would be focusing on a move that would take months to a year to unfold.
The second key indicator to look at is the 61.8% Fibonacci retracement level. This level typically acts as a support level for a small bounce usually. Because the 61.8% level is also in alignment with a previous consolidation, and a pivot low, both which have been highlighted on the chart, I suspect a bounce around the $65 level should take place.
The final potential bottom could take place near the 2009 low. It is a long way away but anything is possible and what we think is most unlikely to happen is exactly what the market does sometimes.
Crude Oil Conclusion:
In short, I think what crude oil is doing is healthy and needed for several reasons. If I let my bias/option shine through, I feel the big oil and gas companies have been taking advantage of us with their ridiculously high gas prices over the last seven years.
The multi-billion dollar, cash rich corporations need a little wakeup call. And the hair cut in their share price should be great for investors. This allows them to build or re-enter new positions at a better price with a higher dividend yield.
I will be watching the hourly and daily charts for a bottoming/bounce formation in the next week. But any bounce could be short lived as sellers appear to be aggressive still.
Receive my personal trade alerts via email and SMS text alerts at www.TheGoldAndOilGuy.com with a 50% Black Friday Offer Today
Chris Vermeulen

