
Combing Thru Data – Looking For Clues About Volatility, USD & Stocks
We are now seeing that major economies (US/UK/Japan) are not immune from global deleveraging and inflation. As investors seek safety in the US Dollar this may eventually trigger a broader and deeper selloff in U.S. stocks and market volatility will begin to pick up as the VIXY moves up. As the USD continues to strengthen corporate profits for US multinationals will begin to disappear.
Especially in times like these, traders must understand where opportunities are and how to turn this knowledge into profits. Part of what we do at www.TheTechnicalTraders.com is to distill price action into technical strategies and modeling systems. These assist us in understanding when opportunities exist in the US stock market and specific sector ETFs. Our core objective is to protect capital while identifying suitable opportunities for profits in trends.
VOLATILITY MAY HAVE BOTTOMED SETTING THE STAGE FOR A TREND HIGHER
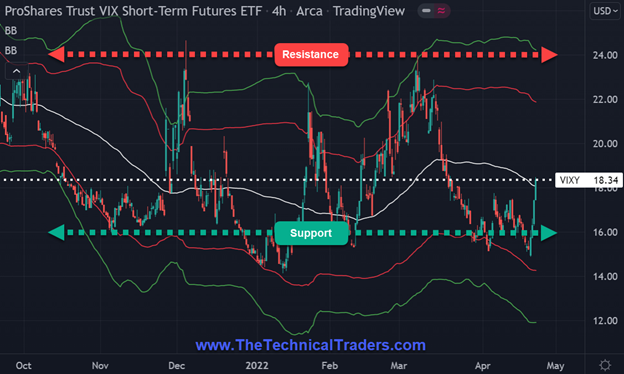
Volatility is beginning to pick up as we see the VIXY moving up strongly from its 6-month base.
Utilizing multiple time frame analysis and then focusing on the 4-hour chart we were able to capture the volatility low earlier than we would have by only using the daily, weekly, or monthly chart.
VIXY – PROSHARES TRUST VIX SHORT-TERM FUTURES ETF: 4-HOUR

THE USD IS UP VS ALL OTHER MAJOR CURRENCIES
The US Dollar is continuing to appreciate as investors and central banks seek safety from geopolitical, inflation, and other market dislocations. The low in the USD was made on January 6, 2021.
1 YEAR RELATIVE PERFORMANCE (USD) – WWW.FINVIZ.COM

UUP – INVESCO DB USD INDEX BULLISH FUND ETF: DAILY

STOCKS MEET RESISTANCE AND ARE SLIPPING AGAIN!
Stocks hit resistance the first week of 2022 after hitting a Fibonacci iteration of 2.1618. Less than two months later the SPY found support at yet another Fibonacci number of 1.618. These Fibonacci levels are based on the range calculation of the pre-Covid high and the Covid March 2020 low.
However, after rallying from the 1.618 level the SPY rolled over to the downside as it hit a 72-bar (12-day) Bollinger Band using a standard deviation setting of 1.618.
Now we will watch closely to see if the price will make a new low for 2022 which may confirm a shift in the overall trend in stocks.
SPY – SPDR S&P 500 ETF TRUST: 4-HOUR

INVERSE ETFS OFFER AN ALTERNATIVE TO TRADITIONAL BUY AND HOLD
Astute traders who want to do more than liquidate part or all their stock holdings may want to consider investing in an inverted ETF. Inverted ETFs provide the ability to take advantage of a downturn in the stock market without the complexities of having to sell individual stocks short.
If our goal as a trader is to make money, we need to adapt and be as agile as necessary. This is one of the reasons why our team continually tracks global money flow according to each country’s stock index but additionally other types of markets and asset classes. Our quantitative trading research is crucial in determining which markets to trade and how to efficiently employ trading capital.
Since we reviewed the SPY uptrend and the potential for a change of trend to the downside; it’s only appropriate to view the opposite side of this trade by looking at the SH inverted ETF.
SH – PROSHARES SHORT S&P 500 ETF: 4-HOUR

UNDERSTANDING PRICE IS A GAME-CHANger
As technical traders, we follow price only, and when a new trend has been confirmed, we change our positions accordingly. We provide our ETF trades to subscribers. Recently, we entered new trades, all of which hit their first profit target levels and then eventually triggered their break-even profit stop loss orders on their remaining position. After booking our profits we are now safely in cash preparing for our next trades. Our models continually track price action in a multitude of markets and asset classes as we track global money flow. As our models generate new information about trends or a change in trends, we will communicate these signals expeditiously to our subscribers and to those on our trading newsletter email list.
Sign up for my free trading newsletter so you don’t miss the next opportunity!
Successful trading is not limited to when to buy or sell stocks or commodities. Money and risk management play a critical role in becoming a consistently profitable trader. Correct position sizing utilizing stop-loss orders helps preserve your investment capital and allows traders to manage their portfolios according to their desired risk parameters. Additionally, scaling out of positions by taking profits and moving stop-loss orders to breakeven can complement ones’ success.
WHAT STRATEGIES CAN HELP YOU NAVIGATE The CURRENT MARKET TRENDS?
Learn how we use specific tools to help us understand price cycles, set-ups, and price target levels in various sectors to identify strategic entry and exit points for trades. Over the next 12 to 24+ months, we expect very large price swings in the US stock market and other asset classes across the globe. We believe the markets have begun to transition away from the continued central bank support rally phase and have started a revaluation phase as global traders attempt to identify the next big trends. Precious Metals will likely start to act as a proper hedge as caution and concern begin to drive traders/investors into Metals and other safe-havens.
Historically, bonds have served as one of these safe-havens, but that is not proving to be the case this time around. So if bonds are off the table, what bond alternatives are there and how can they be deployed in a bond replacement strategy?
We invite you to join our group of active traders and investors to learn and profit from our three ETF Technical Trading Strategies. We can help you protect and grow your wealth in any type of market condition by clicking on the following link: www.TheTechnicalTraders.com
Chris Vermeulen
Chief Market Strategist
Founder of TheTechnicalTraders.com

