When the TSP Outperforms LOOKOUT US INDEXES!!!
Gold, Silver, Copper, Oil, Natural Gas
Get Chris’ Predictions & Trade Alerts: http://www.thetechnicaltraders.com/

When the TSP Outperforms LOOKOUT US INDEXES!!!
Gold, Silver, Copper, Oil, Natural Gas
Get Chris’ Predictions & Trade Alerts: http://www.thetechnicaltraders.com/
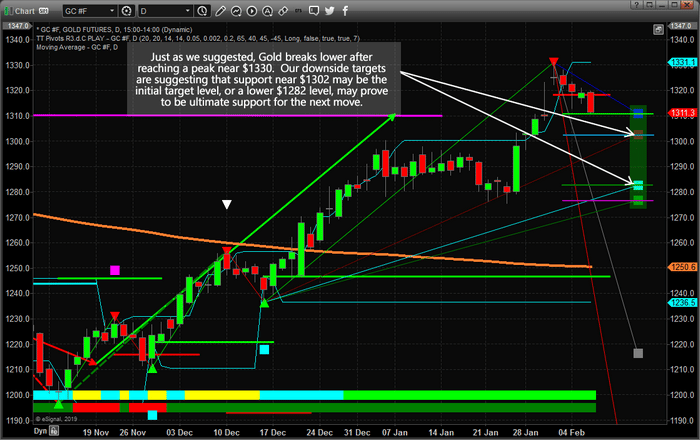
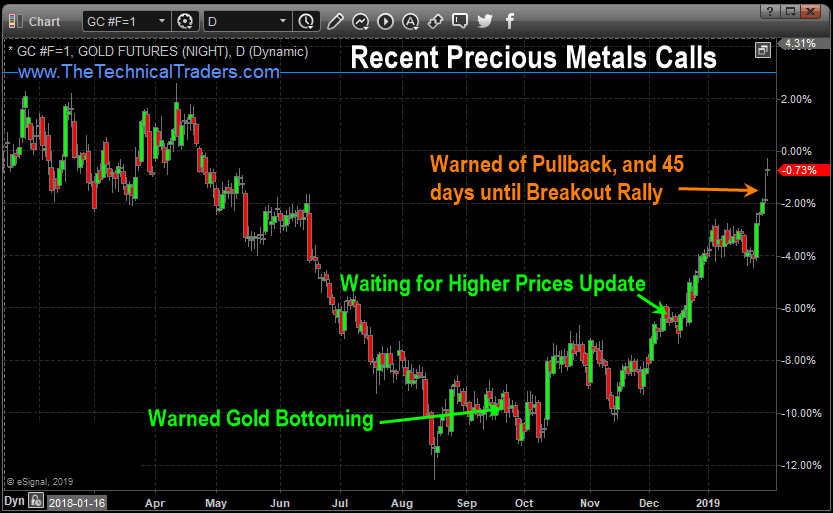
The Technical Traders Ltd. research team has been on top of nearly every move in the metals markets over the past 12+ months. On February 1, we posted this article: Get Ready For The Next Big Upside Leg In Metals/Miners. In this post, we suggested that the recent peak in Gold, near $1330, would likely end and prompt a downside price rotation over the next 45+ days.
Subsequently, on January 28, we posted this article: 45 Days Until A Multi-Year Breakout For Precious Metals. In that post, we highlighted our predictive modeling systems support of a sideways price correction in the precious metals markets that would align with US stock market strength and US Dollar strength.
Today, the price is moving in favor to confirm that our modeling systems and research is correct again. Gold has recently broken lower, below $1315, and appears to be targeting our lower Fibonacci projected target levels. At this point, we believe the Fib level near $1302 will offer minor support and the lower level near $1282 will become major support. We believe the psychological level at $1300 will be tested and broken over the next 30+ days as rotation above $1275 continues to play out. Remember, if our analysis is correct, Gold will provide multiple excellent buying opportunities over the next 30+ days for skilled traders to prepare for the larger upside move.
We believe the downside price breakdown is aligning with general US stock market and US Dollar strength that should last until near the end of March or early April 2019. We believe a moderately deep price rotation in precious metals will allow skilled traders to accumulate positions below $1285~1290 in preparation for the upside breakout move. Read the articles linked above to understand why this is so important for all traders to understand.
The next 2~4 months of trading activity are critical for all investors to understand the dynamics of what is at play across the global markets. Our research suggests we have about 45 days of moderate calm before precious metals begin to breakout to the upside. If you understand the importance of this move, then you’ll understand WHY you need to be prepared for this to happen.
Want to know how we can help you prepare for and profit from these moves? Do yourself a favor and read the free research of our proprietary predictive modeling systems, cycle modeling system, and Fibonacci price modeling systems. These incredible tools we use help our members stay well ahead of these market moves www.TheTechnicalTraders.com/FreeResearch to read all of our public research posts.
Don’t wait till it’s too late for this one. Take a minute to see why you really need to consider having a skilled team of traders and researchers backing you up every day. 2019 is already proving to be a great year for our members as we recently locked in 10.5% with an ETF, and another 8% on stock, and we would love to help you achieve greater success this year as well.
Chris Vermeulen
www.TheTechnicalTraders.com
Chris Vermeulen, Founder of The Technical Traders joins me to share his thoughts on the set up in natural gas and crude oil.
Short-term opportunities are present but Chris outlines a longer-term picture that is more bearish.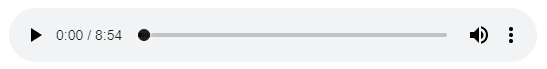
These weeks State Of The Union (SOTU) address presented by President Trump is likely to roil the markets a bit – resulting in some increased market turmoil and rotation over the next 5+ days. Additionally, we believe the tone of this message, as well as the Democratic response to the US President’s SOTU comments, will create a bit of an uneasy forward process for global investors.
Our Adaptive Price Cycle modeling system is suggesting that we would enter a phase of sideways basing over the next 5~10+ days and we believe this analysis is suggesting that uneasy global investors may view the SOTU address and any resulting conflicts as a sign that the US may not have a clear pathway forward. Washington DC acts as a leadership think-tank for the global markets. Whenever there is open conflict, a government shutdown or some increased level of uncertainty, the US stock markets typically become a bit more volatile and choppy while investors settle into forward guidance.
To highlight our thinking/research, we’ll start with this Weekly NQ chart. The current price level is about $7021 below the CYAN Fibonacci projected target level. We believe the technology-heavy NASDAQ will continue to move moderately higher over the next 30+ days – yet we feel the overall markets may rotate a bit lower to form a new momentum base after the SOTU address this week. This means we would be looking for this new momentum base to setup and for new trading triggers to be generated as a momentum breakout happens.
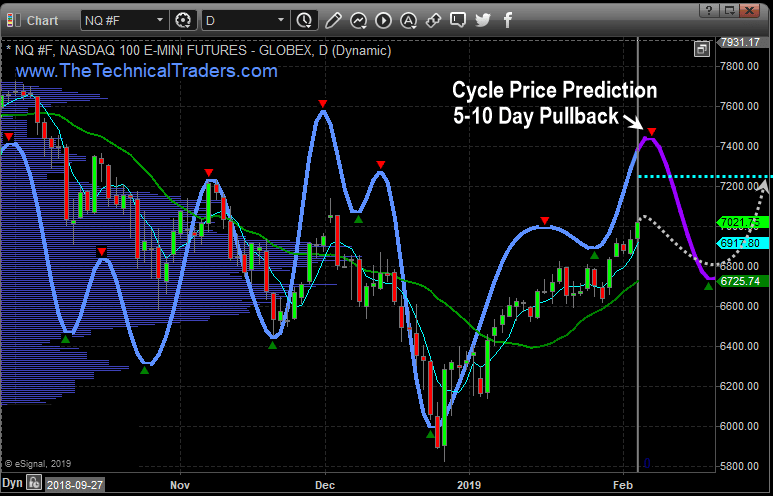
This next chart is the Weekly YM chart and it clearly shows that the current price is already above the CYAN Fibonacci projected target level. This is important because it highlights the fact that the NASDAQ has been under some pricing pressure as the FANG stocks have yet to fully recover from the December 2018 lows. It also shows that the Blue Chips and Mid-Caps have already recovered quite substantially over the past 6~7 weeks.
We would not be surprised to see the YM rotate after the SOTU address this week to levels near the CYAN Fibonacci target/support level (24,435) while setting up a new momentum base – similar to what we expect to happen in the NQ. It makes sense that this support level (24,435) would be a substantial basing level for a new momentum breakout trade to continue higher.
Our overall longer-term analysis of the US markets is that we continue to believe the upside price bias will continue and that a moderate upside “melt-up” as a renewed capital-shift continues to drive investment into the US stock market. Right now, though, we are warning that the US stock markets could be setting up for a period of 5~10+ days of rotation and volatility, after the SOTU address, that may frighten many traders. Because of this, we had our subscribers close out our GDXJ position for a 10.5% gain right at the recent high, and also took partial profits on our ROKU stock pick for a quick 8% gain. So be prepared for some sideways trading and increased volatility for the next week or two.
Visit www.TheTechnicalTraders.com/FreeResearch/ to read all of our most recent research posts. We are confident that you will find our Daily Video, Detailed Market Research, Proprietary Research Tools and Detailed Trading Signals will help you make 2019 an incredibly successful year.
Chris Vermeulen
www.TheTechnicalTraders.com
We are not always correct in our calls about the market. Professional researchers and analysts must understand that attempting to accurately predict the future outcome of any commodity, stock, index or ETF is impossible to be 100% accurate. Yet, we are pleased that our proprietary price modeling and analysis tools continue to provide us with very clear triggers and alert us to price moves before they happen.
Today, we are sharing two recent trades we executed with our members that resulted in some decent profits. The first example is our GDXJ trade. We had been in a Long position since before the beginning of 2019 expecting Gold and Miners to rally. Our price modeling systems suggested that after price reached $1300, we may experience a brief price pause over the next 45 days or so. Thus, we pulled the profits in this trade recently to lock in 10.5% profit and to allow us to re-enter when our modeling systems suggest the price pullback has ended.
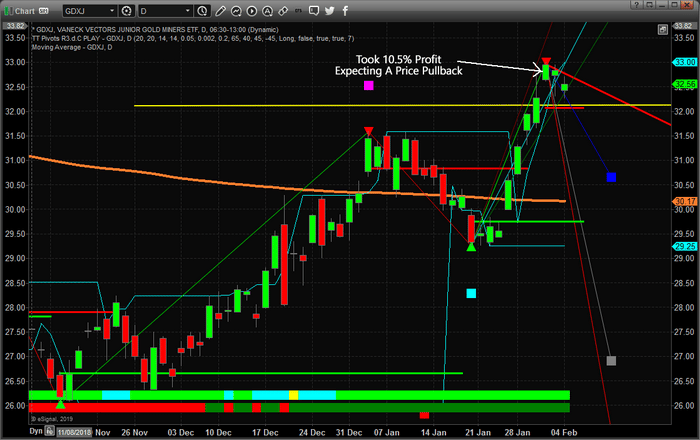
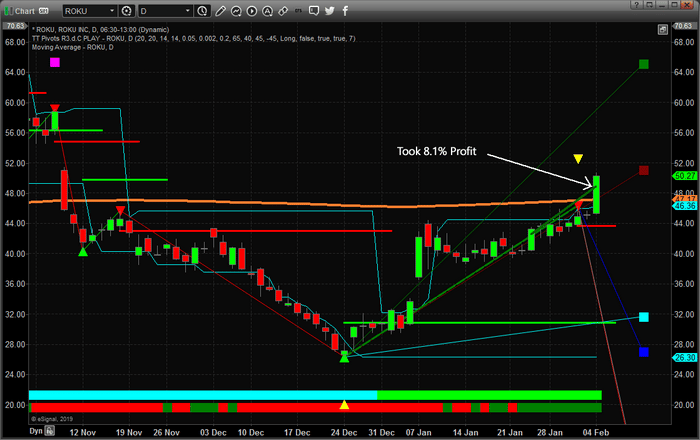
The second example is our ROKU trade. We recently pulled 8.1% profit on a partial profit target execution for our members after a nice upside momentum move. This type of trade falls into our MRM (Momentum Reversal Method) trade trigger category and is supported by a momentum resurgence price move that can typically prompt prices to move +8~30% over fairly quick periods of time (under 20 days).
For almost all traders, we’ve found that understanding general market conditions, finding suitable trading triggers/setups and staying aware of the market dynamics at play in the global markets is very hard to accomplish. This is why we offer our members a very quick and easy way for them to accomplish all of these essential components for success with their membership to Technical Traders Ltd. Wealth Trading Newsletter.
– Our Daily Market Video, which is typically under 10 minutes in length, covers all of the major markets, most commodities, the US Dollar, Bitcoin and many other elements of the markets.
– Combine this video content with our detailed market research posts, which you can read by visiting www.TheTechnicalTraders.com/FreeResearch/, allows our members to not only learn from our video content but also to begin to understand and formulate their own conclusions based on our content.
– Lastly, we add our trading trigger/alerts feature to alert our members to superior trading setups that we find while running our proprietary trading models. We don’t post 40 trades a day hoping our members will find one or two they can make profits from. We are highly selective in our posts and attempt to only post the best opportunities for success.
Over the past couple of months, we have been developing a new members area application. It will allow you to have live access to our morning spike and gap trades and traders chatroom, our Sp500 index momentum, and swing trades, plus our special MRM (Momentum Reversal Method) stock picks on small/mid-cap stocks which also all trade options so if you want to you can trade options on your own around our stock trades.
Last week we made huge progress and this week’s goals are to implement the instant and automated SMS and email alerts sent to you every time there is a new trade, stop, target hit, or we close a position. This will give you more time to see and execute the trades as needed. Keep in mind most swing trades can be entered 1-3 days after the trade alert at the same price or better price simply because we are not that perfect at timing the markets every move.
If you take a minute to review these example REAL TRADES (above) and review the information at www.TheTechnicalTraders.com, we believe you will understand the value and resources we offer our members. Isn’t it time you found the right team of professionals to help you make 2019 an incredibly successful year?
Chris Vermeulen
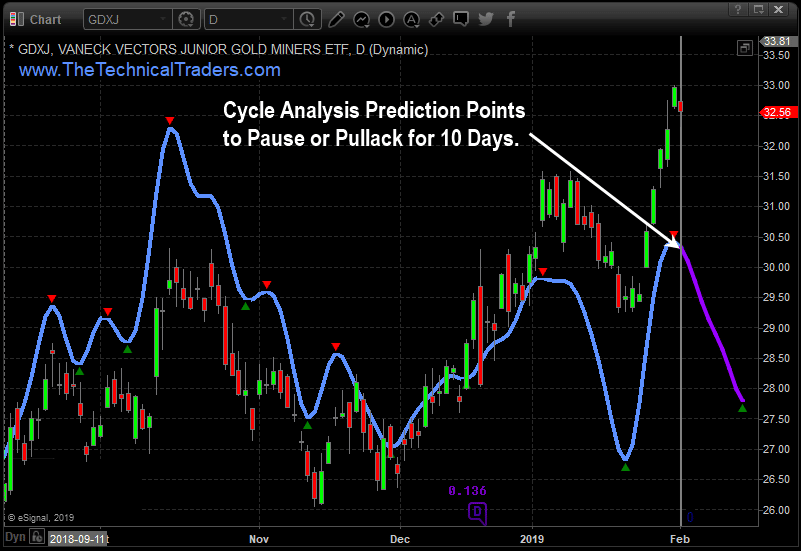
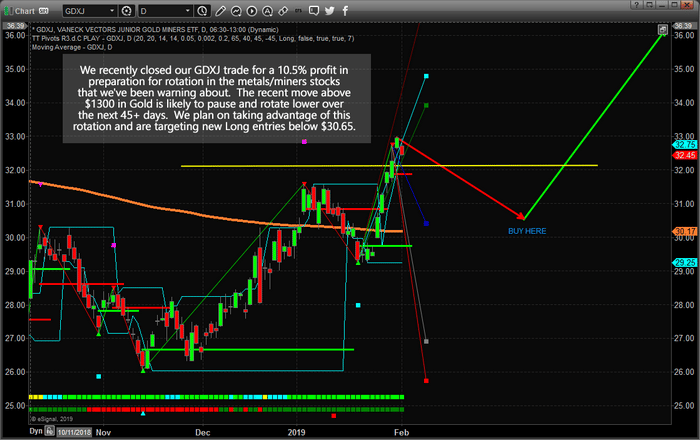
We recently closed our GDXJ trade for a 10.5% total profit with our members. We are preparing for a lower price rotation over the next 45+ days that will allow us to plan for new long. Our research indicates the metals/miners should enter a downside price rotation over the next 45+ days as the US stock markets continue to rally. Give this expectation, it is important to understand how we are timing this move for our members and attempting to take advantage of strategic trade deployment.
With Gold recently breaking above $1300, many analysts have been calling for a continued breakout move to the upside as well as a massive market correction in the US stock market. We’ve been calling for just the opposite to happen – a pause in the metals/miners near this $1300~1320 level.
If our analysis is correct, a renewed capital shift will continue to unfold over the next 30~45 days where foreign capital will move into the US stock market (including technology, financial, medical/biotech, blue chips, mid-caps, and others) as global investors chase the safety and returns of the US Dollar and the US stock market. This process of deploying capital into the US stock market will relieve upside pressure in the metals/miners for a brief period of time – resulting in a price pullback. Our expectations are that the GDXJ price will rotate back below $31 and likely target a support level near $30.50~30.65. This is near where we intend to look for new Long entry trades.
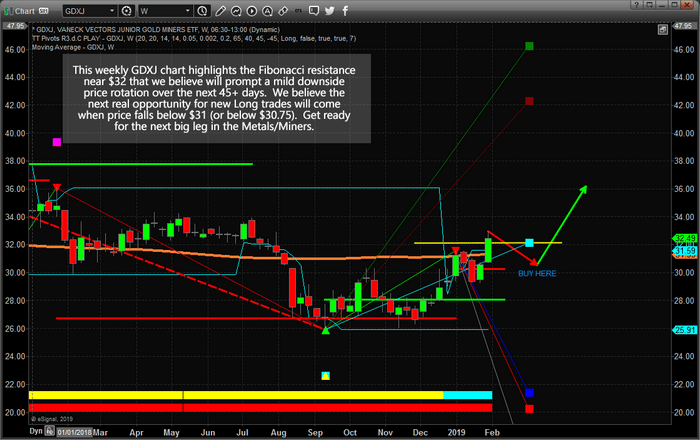
The opportunity of the next leg higher in the metals/miners is exciting. Take a look at this Weekly GDXJ chart showing the upside price targets near $42 and $45. These represent a 37% to 47% upside price objective once this rotation completes as we expect.
In short, if you want to gain access to our proprietary price modeling systems, a dedicated research team, daily video analysis, and help you find and execute better trades, then please visit www.TheTechnicalTraders.com. If you want to know how and when we are trading these markets to help our members, then consider becoming a member and enjoying all the benefits we offer our subscribers. This is going to be an incredible year for skilled traders who can move around and trade the hot pockets of stocks and commodities.
Chris Vermeulen
www.TheTechnicalTraders.com
Over the past 4~5 months, our research team has authored numerous articles and research posts attempting to help traders and investors understand the future market moves. As today is the last day of January 2019, we thought we would highlight some of our research to help you better understand exactly how our unique skills and tools can assist you.
Remember, at the time of the first post, September 17, 2018, the markets were still about 2~3 weeks away from setting up a major top. There wasn’t a single analysis, except our team, that had the foresight and knowledge to make the predictions we did on that day. We still get comments from our members asking us how we did it.
Take a minute to read through this detailed history or our research posts to learn why Technical Traders Ltd. is continuing to be one of the best informative forward research and trading solutions you can find anywhere. We believe our team and proprietary price modeling tools are superior to many others out there and our record stands for itself. We are not perfect, but very few others can call the markets future 5+ months in advance and pretty much “nail it”.
We are currently revamping our Wealth Trade Alert Newsletter members only area to provide our live technical charts and tools so they update throughout the day with our signals, morning index day trades with live chatroom, SP500 index momentum and swing trades, and our special MRM “Momentum Reversal Method” for small and mid-cap stocks.
Keep in mind, these new and exciting new features are being created and we hope to move to the new member’s area and format over the next few weeks.
We help make big trend trading simple for investors and traders to find success and execute better trades in 2019.
September 17, 2018: PREDICTIVE MODEL SIGNALS MARKET TOP
https://www.thetechnicaltraders.com/predictive-trading-model-suggests-falling-stock-prices-us-elections/
December 26, 2018: STOCK MARKET BOTTOMING
https://www.thetechnicaltraders.com/has-this-selloff-reached-a-bottom-yet/
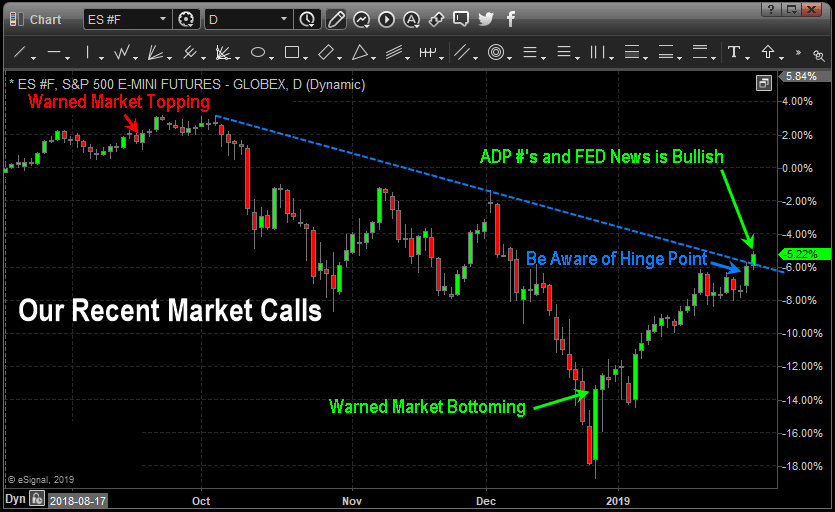
January 30, 2019: US EQUITY MARKET RECOVERY HINGES ON THE NEXT MOVE
https://www.thetechnicaltraders.com/us-equity-market-recovery-hinges-on-the-next-move/
January 30, 2019: ADP NUMBERS AND THE US FED HIT THE LAUNCH BUTTON
https://www.thetechnicaltraders.com/adp-numbers-and-the-us-fed-hit-the-launch-button/
September 23, 2018: WARNED PRECIOUS METALS BOTTOMED
https://www.thetechnicaltraders.com/gold-and-miners-are-about-to-explode-upward/
December 12, 2018: JUST WAITING FOR GOLD & SILVERS NEXT RALLY
https://www.thetechnicaltraders.com/expect-gold-silver-to-pullback-before-the-next-move-higher/
January 28, 2019: 45 DAYS UNTIL A MULTI-YEAR BREAKOUT IN PRECIOUS METALS
https://www.thetechnicaltraders.com/45-days-until-a-multi-year-breakout-for-precious-metals/
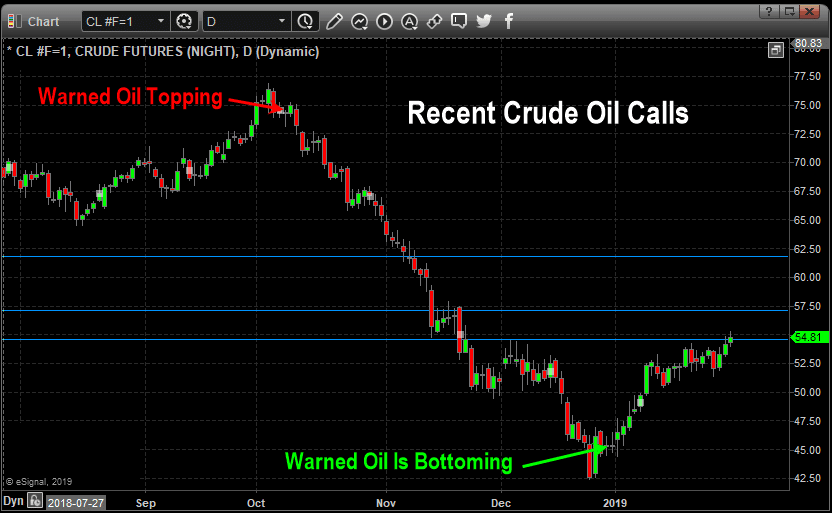
October 7, 2018: PREDICTIVE MODEL SIGNALS OIL TO FALL
https://www.thetechnicaltraders.com/will-oil-follow-historical-patterns/
December 31, 2018: OIL – WHAT TO EXPECT WITHIN THE FIRST 3~5 MONTHS OF 2019
https://www.thetechnicaltraders.com/what-to-expect-within-the-first-35-months-of-2019/
I just want to tell you how much I appreciate your no nonsense. I’ve read other advisors who hedge their bets with so many caveats that you could never actually put on a trade. So far, you have been crystal clear with your analysis and, even better, it has been correct!
JOHN BRIERLYTeacher
I really appreciate how hard you are working for us members… and how we’ve been able to make money recently when I might have been panicking without you. I’m learning a lot from you. Thanks.
TOM ROBERTSAccountant
I am looking to expand my knowledge in trading, and I like your methods. I am new to the game and I’m finding your advice very helpful and very profitable! I almost can’t wait for the updates.
STEVE USHINSKIVideo Editor
 Chris Vermeulen
Chief Investment Strategist
Technical Traders Ltd.
Get ready for a potential blastoff in the US stock market as all-stars are beginning to line up for an incredible upside price rally. The Fed, taking a warning from the markets and the global economy, has decided to leave rates unchanged for now. It appears they have moved to a more cautious stance in an attempt to foster continued economic growth over rate increases. The purpose of this is clear to anyone watching what is happening across the planet – the US is the strongest, most mature economy on the planet. The US fed can’t risk creating another debt/credit collapse at this time. It is better to move in measured steps than to move “all-in” over a short period of time.
Additionally, ADP released their Jobs numbers for December 2018 today with an expected 271k jobs number. This is an incredible number for December. Our interpretation of December employment numbers is that the Christmas hiring has already ended and many companies are have already shipped/supplied product for the holiday season. By December, we expect to see weaker jobs data with the expectation that firms are downsizing payroll while planning for the Spring sales season to get started. This does not take into consideration the weather events that typically plague December.
The only things left for this rally to really blast off would be strong earning data and some resolution to the China trade issues. If either of these “booster rockets” hit the news cycles over the next 30 days, we could easily see the US stock market rally toward all-time highs in a matter of weeks – not months.
Pay attention to the way price is setting up and take special note of the fact that the US economy and stock market are really the biggest, and safest location on the planet, right now, for any capital. As long as these numbers keep pouring in like this and the US Fed doesn’t hit the “panic button”, there is a very good chance that the US markets will continue to rally until some type of foreign market event deflates this move.
Have you been suckered into shorting this rally over the past few weeks?
We have been expecting this rally since the end of December and we do feel it will continue to trade sideways or higher for a couple more months, at which time we will need to reevaluate the state of the market. The Feds move was bullish for stocks and it could be enough to send the market substantially higher, but it also means they know the economy is not as strong as they thought and didn’t feel it would be good to raise rates.
The chart below shows what could happen if stocks can rally and close above last weeks high. It could spark another run-up in stock prices to new highs.
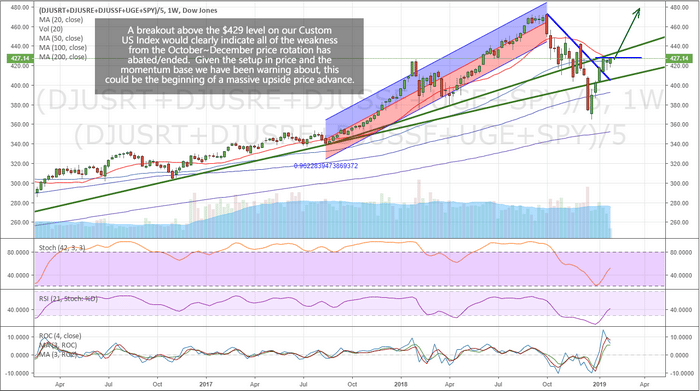
Overall, the stock market is at a critical tipping point much like the December 2000 market top, April of 2008 market top, and the two continuation moves during October 2011 correction and rally, October 2015 correction and rally. What happens over the next couple of months will determine where your long-term investments should be placed.
Visit http://www.thetechnicaltraders.com to see how we’ve been calling these moves. We’re not perfect at making calls – that would be completely unreasonable to think we can predict the future 100% of the time. But we are confident that our daily videos, proprietary price modeling tools, and detailed global market research will provide you with the advantage you need to create more success – Join Now!
Chris Vermeulen
www.TheTechnicalTraders.com
The research team, at The Technical Trades Ltd., has been calling this market move quite accurately. We made predictions on September 17, 2018, that called for a -5~8% downside market rotation, followed by price support just before the November 2018 US elections. After that, we called for a deep “Ultimate Low” price rotation to setup followed by a strong price rally. Even though we under-estimated the ultimate low-price rotation which was much deeper, our trend predictions from 120 days earlier are playing out quite accurately.
Currently, we are writing this message to all our followers to inform them that the Feb 1 Jobs report, as well as other critical earnings and economic data, are the “unknown factors” that have stalled this upside market move. At this time, it is our belief that capital has already started re-entering the US stock market and that a good portion of these investors are waiting for further evidence that a resurgence of price appreciation will continue without any new crisis events unfolding. Our September 17, 2018 analysis suggested that the US markets would find support after a “revaluation event” and continue an upward price bias. As this point, we believe we have reached the “momentum launchpad”.
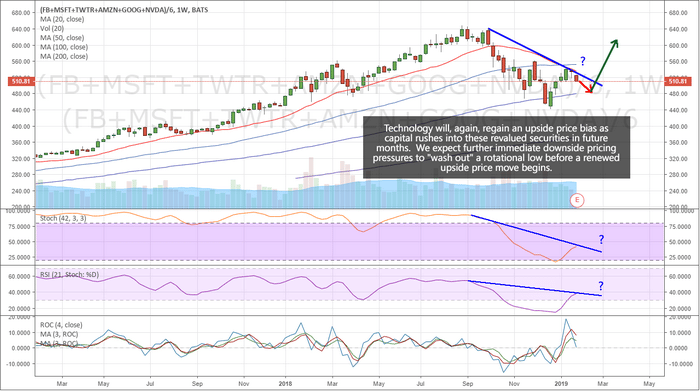
This first chart shows our Custom Technology Index on a Weekly basis. Our opinion is that Technology will likely continue to rotate a bit lower over the next few weeks, setting up a support level near or above December 2018 lows. This “setup” will likely prompt a new momentum base for Technology and the broader US equities markets to begin a renewed upside price rally. It makes sense that earning data, forward expectations, geopolitical news and renewed future guidance would prompt a price rotation near these current lows before capital comes rushing back into this sector attempting to ride the next wave higher.
I should note that we have been getting bearish signals on many of the leading tech stocks this week and when the majors sell off it pulls the indexes down as well. Tech stocks lead the bull market but are now underperforming and the smart money is now flowing into new sectors of the market with precious metals being the market leader. Its traders market now meaning you can’t just go buying big brand name stocks and make money, rather you need to be nimble and move to sectors and stocks that have investors money pouring into them.
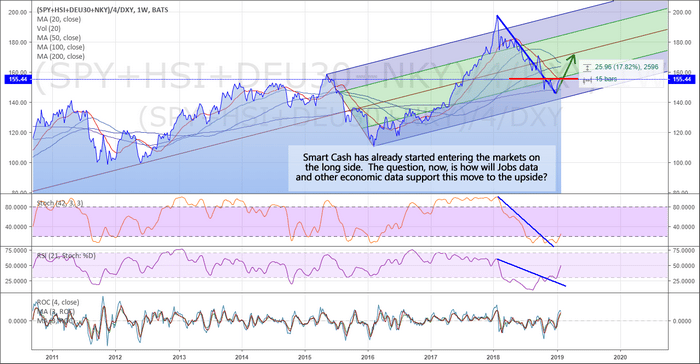
Our Smart Capital Index, shown below on a Weekly basis, highlights the recent resurgence in buying in the US markets as well as highlights the current resistance near the RED line on this chart. This level represents a lower boundary that is acting like a temporary ceiling. A decent jobs number, continued strong earnings and economic data, as well as moderately strong future guidance, should see this level breached in early February or early March. In other words, even with reduced forward earnings guidance and income, the US equities markets are still the only game in town for global capital to avoid currency, economic and political risks that seem to be everywhere.
You can see from this Smart Capital Index that we’ve seen a massive revaluation event unfold from January 2018 to January 2019. Even though the US markets stayed relatively flat throughout this time, comparatively, our global Smart Capital Index showed the global markets were revaluing equity investments with a tremendous -26% price decline. That’s right, over the past 12 months, the global equities markets have declined by over 26% in a revaluation event that was initiated by global market concerns in China, Asia, Europe, and the Emerging Markets.
Our opinion is that a “reversion event” will likely take place over the next 12+ months where the strongest economies in the planet will recover to near or above the middle/upper levels on the Smart Capital Index chart. This would represent an 18~30% price recovery on this chart – or a 20~30% price recovery from December 2018 price lows for the US major indexes.

We have to remember that the US markets have become a leader in global markets and a safe-haven for global investors. Even though our Smart Capital Index has shown a massive price decline of -26%, the Dow Jones only decreased by -18% over that same time-span. Thus, if we are expecting a +18~30% price recovery on this chart, the Dow Jones may easily recover by 20~30% or more throughout this event.
The next 2~4 weeks will likely play out where Technology rotates lower and sets up a momentum base before starting to move higher. Our opinion is that the US Major Markets will likely base as well over this time. We believe a renewed buying interest will begin after February 16th as global investors continue to seek returns and safety for the remainder of 2019. We strongly believe the continued capital shift into the US markets will take place as soon as this momentum base sets up and price support is clearly evident to traders. This means we have about 2~4 weeks to plan for and set up strategic trades in preparation for this move to the upside.
Want to learn how we can help you find and execute incredible trading opportunities in 2019? Want to learn how our incredible proprietary price modeling systems can help you stay ahead of these market moves? Our researchers continue to call market moves 60, 90, 120+ days in advance. Visit www.TheTechnicalTraders.com to learn more about what we do and how we can help you create greater success.
Chris Vermeulen
Today is the day we want to warn our followers that we expect the precious metals to continue to base with a fairly narrow price range for about 45 to 65 more days before upside pricing pressures start to take hold of the markets. There has been quite a bit of chatter about Gold breaking above $1300 recently. Many people have been expecting it to move much higher fairly quickly. We don’t believe that will be the case – but expect it have another significant rally in April, May or June.
Back in early October 2018, we shared this chart with all of our followers suggesting that Gold and precious metals would rally to above $1300 near December/January using our Adaptive Dynamic Learning predictive modeling system. We’ve been suggesting to our followers for many months that Gold, Silver, and miners would begin a new upside price swing, yet we knew the big breakout moves were still many months away.
Pay very close attention to the DASH lines on the chart and the GREEN and RED arrows we drew to help our followers understand what we expected to see happen in the future.
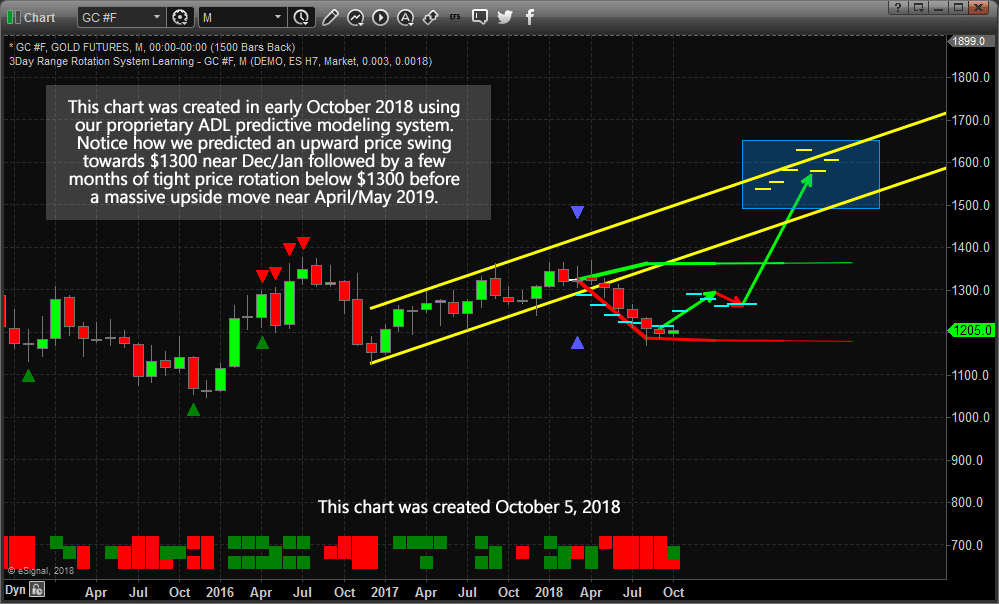
Now, take a look at the current Gold chart below with the same ADL levels displayed on it. Notice how price moved towards the DASHED lines almost perfectly in alignment with our predictive modeling results? Yes, the move in December was a bigger upside swing compared to the previous few months, but that is what happens when a “price anomaly” sets up with the ADL system. When the price falls “out of alignment” with the ADL predictions, we call this a “price anomaly”. This is when the price may quickly rally or sell-off, depending on the direction of the anomaly, to attempt to catch up to the mathematically predicted price levels.
Currently, we expect the price of Gold to stay between $1250 and $1320 for the next few months while it consolidates towards the $1260~1275 range near early April or early May 2019. And that will be all she wrote, folks. Because once price settles near this level near the April/May timeline, this should be the basing formation that will launch massive new momentum to the upside. Our opinion is that it would be best NOT to wait till the last minute to prepare for this move. Even though we expect this move to start near April/May of 2019, it could start to melt-up earlier than we expect – this is why we are warning you today that we have about 45 days left to plan and prepare for this trade. Subscribers entered a long GDXJ position down near the lows at $27.52 a while back slowly preparing for this major market bottom.
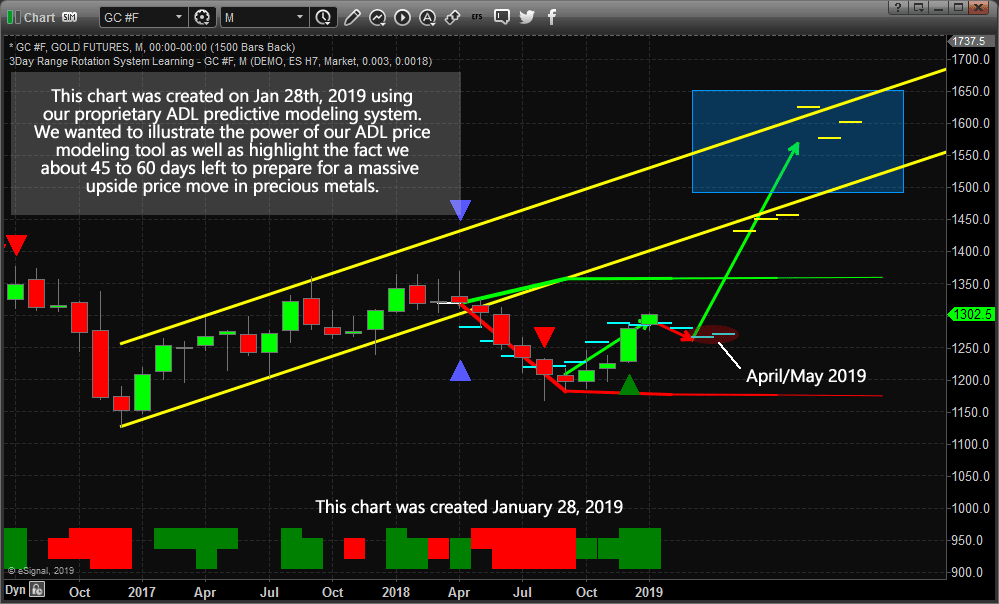
If our analysis is correct, the US markets will settle into a melt-up format where global capital continues to pour into the US stock market in an attempt to avoid risks associated with global market slowdowns and events. This “capital shift” will continue to play out for the first 2 quarter of 2019 without much interruption. Our ADL predictive modeling system is suggesting that by May/June of 2019, precious metals should start to rally above $1400 and that means something is going to cause fear in the markets. It could be the US Presidential election cycle spinning up or it could be something external – we don’t know yet. We do know that the Brexit date, March 29, 2019, is likely to spark some renewed fears in the global markets and we are eagerly watching the news cycles to see what is next.
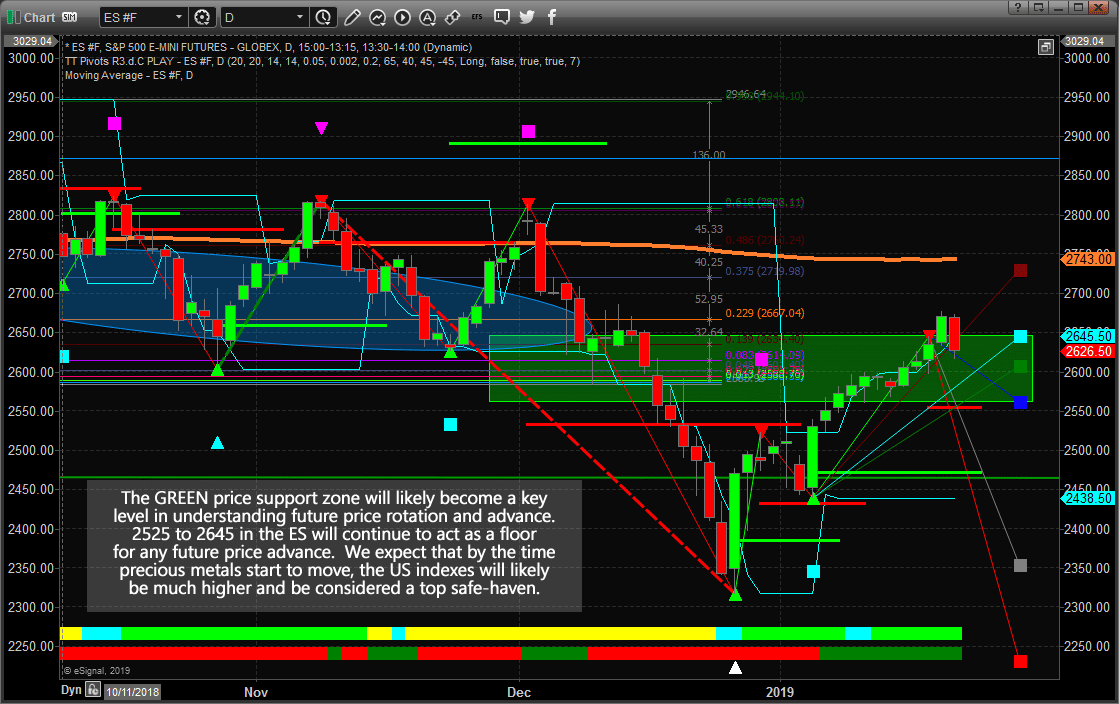
The current support levels in the ES is between 2525 and 2645. We recently posted a public article sharing our research regarding our opinion that rotation near 2670 was likely and that the GREEN support zone should act as a floor for current price rotation. Our Fibonacci price modeling system is suggesting there is a vast array of support in this zone where the price should base, build power and begin a continued upside “melt-up” over the next 60~90+ days.
Why is it important to understand that this stock market may continue to rally as Gold and precious metals begin a breakout upside move? It is important to understand how fear rotates through the markets as a result of “origin”. The origin of the event or crisis that is generating this fear in the markets tends to shift perception as to the extent this fear/event will reach other economies. With the 2008-09 credit market crisis, the origin was the US and global financial institutions – the biggest institutions on the planet. We believe the new crisis event may be “regional” to Asia/China and Europe. Thus, the origins and reach of these events may be more isolated than last time.
Also, we know that the once leaders of a market (tech) become the dogs, and the unwanted assets become market leaders. Commodity/resource stocks (precious metals) tend to outperform the USA stock market in the final few months before the bull market ends and that could be what is happening right now. Tech stocks are lagging while the precious metals sector is one of the strongest.
We believe 2019 is going to be the year where skilled traders can make a fortune if you know what you are doing and can see these moves in advance. Our team of traders and researchers at www.TheTechnicalTraders.com are dedicated to helping you find and execute better trades. Visit our web site and see how we can help you build for a greater future. I will drop one little hint before the news hits the wires, we are building a new client services portal that will blow your minds in terms of ease of live intraday analysis, trading opportunities from day trading, to swing trades, and even our own long term investment signals). This new client portal will allow you to more actively engage with our team and fellow traders of our service. Get started now as we are only a few weeks away from launching these new member tools.
Chris Vermeulen