Our research continues to support a Bullish price bias over the next 30+ days, very likely reaching to new all-time highs again, before June/July 2019. For many months, other researchers have continued to predict “doom and gloom” with warnings of Treasury yield inversions, global collapse events, and other crisis events. Yes, we believe continued price rotation will drive future price swings and they could be volatile moves – yet we believe any crisis event will actually become an incredible opportunity for long traders to BUY into the markets at extreme lows.
Recently, our researchers focused on OIL and the Transportation Index as key elements suggesting this upside move is far from over. Oil has moved from below $55 ppb to well above $60 ppb. We believe this move will continue higher to target the $64 ppb level were resistance is likely to be found. We do believe that some price rotation in Oil is likely to happen in the Summer months – when travel increases and Summer blend gas hits the markets. Winter has been uniquely difficult this year and the rise in Oil prices, where OPEC and foreign market events have attempted to push prices above $50 ppb, is warranted given global economic activities.
While Oil continues to climb, the Transportation Index is also rallying above recent resistance near $10,500 and pushing higher targeting the $11,250 level. This is important because the Transportation Index typically leads the US economy by about 3~6 months and is a key indicator of investors future expectations for the US and global economy. Any push above $11,000 in the Transportation Index would likely mean we are going to attempt to reach all-time highs near $11,634. A move like this would likely push the US Stock Market Indexes well above recent all-time highs as well.
Much of our recent analysis has been an attempt to relate the opportunity that exists over the next 30~60 days in the US Stock Market. For well over 12 months, we’ve been suggesting a capital shift is taking place where the US stock market, and the US Dollar, are uniquely positioned to become safe-haven investments for foreign investors. We believe this process is still taking place and we believe the US market could continue to push up to new all-time highs before another rotational move sets up. Our most recent research suggests a peak may form near June/July 2019 that should concern traders. Until then, we believe the upside price bias will continue and we still believe new all-time highs are about to be reached.
As of today, we have technical confirmation that a renewed upside price move is taking place and we continue to watch the precious metals for any signs of a base/momentum bottom. Follow our research and learn how we can help you find and execute better trades.
Take a minute to find out why Technical Traders Ltd. is quickly becoming one of the best research and trading services you can find anywhere. We are about to launch a new technology product to assist our members and we continue to deliver incredible research posts, like this one, where we can highlight our proprietary price modeling systems and adaptive learning solutions. If you want to stay ahead of these markets moves and find greater success in 2019 and beyond, then please take a minute to see how we can help you. Once this June/July peak begins, you won’t want to miss the next big move… Join www.TheTechnicalTraders.com today.
Chris Vermeulen
https://thegoldandoilguy.com/wp-content/uploads/2019/04/Featured-Image.png387700adminhttp://www.thegoldandoilguy.com/wp-content/uploads/2014/11/tgaoglogo.pngadmin2019-04-03 15:58:452019-04-03 15:58:45Why Are The Markets Ignoring The Treasury Inversion?
The Euro Futures chart is highlighting recent support and our proprietary Fibonacci price modeling systems are suggesting that a current support zone may be setting up for a decent upside move to near 1.15. Momentum has stalled to the downside after the Brexit kerfuffle. It is our opinion that this move to near 1.125 will likely hold as support and prompt an upside price move towards the 1.15 price level.
Volatility within the ZE is normal and this type of price rotation appears to continue. An upside bottom/base near 1.125 may prompt a larger upside price swing in the Euro Futures because it relates a “higher low” price formation following Fibonacci Price Theory. This set would indicate that a “lower low” attempt has failed and would suggest that the Euro Futures price would now attempt a new Higher High (above 1.155).
Skilled traders should watch for any breakout above 1.134 as confirmation of the upside price rally and target 1.15 or higher. This could also drive the US Dollar a bit weaker over this same time-span. Might be an excellent setup for quick profits.
Do you want to find a team of dedicated researchers and traders that can help you find and execute more winning trades in 2019 and beyond visit our trade alert newsletter at www.TheTechnicalTraders.com or learn our trading techniques through our Trading Courses today?
Chris Vermeulen
https://thegoldandoilguy.com/wp-content/uploads/2016/10/euro-crisis.jpg22503000adminhttp://www.thegoldandoilguy.com/wp-content/uploads/2014/11/tgaoglogo.pngadmin2019-04-02 22:40:552019-04-02 22:40:55Euro Dollar Price Bottoming Setup
While we have recently suggested the US stock market is poised for further upside price activity with a moderately strong upside price “bias”, our researchers continue to believe the US stock markets will not break out to the upside until the Russell 2000 breaks the current price channel, Bull Flag, formation. Even though the US stock markets open with a gap higher this week, skilled traders must pay attention to how the Mid-Caps and the Russell 2000 are moving throughout this move.
As we continue to advise our clients that the upside pricing cycle in the US stock market is being underestimated, see this research post: we also believe that increased volatility and price rotation will continue to drive larger rotations in price before the final breakout upside move takes place. We want to continue to warn traders that we still don’t have any confirmed upside breakout with price continuing to stay within this price channel in the Russell 2000. Eventually, when and if the price does breakout to the upside, we will have a very clear indication that continued higher prices and a larger upside move is happening. Until then, we need to stay cautious about the types and levels of rotation that continue within the markets.
Recently, volatility has started to increase as can be seen in this VIX chart. If the Russell 2000 is not able to break this trend channel with this current upside price move, then we fully expect continued price rotation in the US stock markets and another increase in the VIX as this rotation takes place. The NQ recently rotated downward by nearly 4% while historical volatility continues to narrow. When volatility diminishes in extended price trends, we’ve learned to expect aggressive price rotation can become more of a concern. We expect the VIX to spike above 16~18 on moderate volatility as we get closer to the cycle inflection date near June/July 2019.
Overall, our researchers believe the upside price bias in the US stock market will continue for another 30+ days as our research and predictions regarding precious metals and the longer term equities price cycles continue to play out. Skilled traders need to be aware that this upside price bias may include larger price rotation and volatility as we get closer to the May/June/July 2019 cycle inflection points. Stay aware of the risks as 4~6%+ price rotations should be expected over the next 30+ days throughout this upside price bias.
Do you want to find a team of dedicated researchers and traders that can help you find and execute better trades in 2019 and beyond? Please visit www.TheTechnicalTraders.com to learn how we can help you prepare for the big moves in the global markets and find better opportunities for greater success in the future. Our team of researchers and traders continue to scan the markets for new trades and unique opportunities.
Chris Vermeulen
https://thegoldandoilguy.com/wp-content/uploads/2019/04/chart1.png387700adminhttp://www.thegoldandoilguy.com/wp-content/uploads/2014/11/tgaoglogo.pngadmin2019-04-01 22:22:062019-04-01 22:22:06Waiting for the Russell 2000 to Confirm The Next Big Move
If you want to join a group of professional traders, researchers, and friends, take a look at our trading newsletter to learn how we can help you find and execute better trades each month. We believe 2019 and 2020 will be incredible years for skilled traders and we are executing at the highest level we can to assist our members. In fact, we are about to launch our newest technology solution to better assist our members in creating future success.
Our team has 53 years of experience in researching and trading makes analyzing the complex and ever-changing financial markets a natural process. We have a simple and highly effective way to provide our customers with the most convenient, accurate, and timely market forecasts available today. Our stock and ETF trading alerts are readily available through our exclusive membership service via email and SMS text. Our newsletter, Technical Trading Mastery book, andTrading Coursesare designed for both traders and investors. Also, some of our strategies have been fully automated for the ultimate trading experience.
RECENT CLOSED TRADES
Chris Vermeulen
Technical Traders Ltd.
https://thegoldandoilguy.com/wp-content/uploads/2019/03/video-player.png575960adminhttp://www.thegoldandoilguy.com/wp-content/uploads/2014/11/tgaoglogo.pngadmin2019-03-31 12:32:202019-03-31 12:32:20April’s Stock Market, Gold, Oil, and Natural Gas Price Predictions and Forecast
Think of this research post as an early warning that June and July 2019 are likely to be a very critical price inflection point based on our proprietary price cycle analysis tools. Back in October 2018, we predicted the downside price rotation almost perfectly going forward 4 to 5 months. We predicted nearly every move that occurred in the US stock market all the way to and through the ultimate low that occurred on December 24, 2018. You can read that post here.
Now, our predictive modeling systems and cycle systems are predicting a June/July 2019 cycle inflection date that will likely coincide with, possibly, new market highs as well as increased bullish price activity throughout the global stock markets until we get nearer to this date. This June/July 2019 date becomes even more critical as we begin to understand our other predictive modeling systems are suggesting that precious metals will begin an upside price advance near late April or early May 2019. When we combine this analysis and start to consider the broader conclusion, it leads us to believe the global stock markets could be poised for a bit of rotation after May or June of 2019 – possibly setting up a bigger price sell-off throughout the end of 2019. Only time will tell.
This Monthly DOW Industrial chart highlights our cycle inflection points/dates in vertical lines. The next, pending, cycle inflection point is June/July 2019 on this chart. We believe continued upside price bias will prevail over the next few months resulting in lower Gold and Silver prices. As we near these June/July dates though, we could see an increase in volatility as well as a decrease in US Dollar valuation. This would align with a “risk on” transition away from equities and into protection assets like Gold and Silver.
Our Adaptive Dynamic Learning (ADL) predictive price modeling system is suggesting that an upside price bias will continue over the next 2~3 months headed into this June/July cycle trigger. The ADL is also suggesting that the US stock market may reach near all-time highs just before the cycle inflection date hits. We do believe that some moderate price rotation is likely over the next 60 to 90+ days as price rotation is a key element of price advance or decline. We are suggesting that, for right now, traders should continue to expect moderate upside price bias, with some expectation of price zig-zagging its way up, over the next 2~4 months.
Should our cycle inflection date prompt a market reversal, we will likely know more about the risk factors that could prompt this move at least 20~30 days before the event begins to unfold. We are posting this research post to alert you to a cycle trigger/inflection point that is 3~4 months away that could become a major event in our future. As we’ve suggested in this article, we don’t believe this inflection point will change the way we trade next week or the week after that, but we do expect the closer we get to this critical inflection point – the more important it will become for skilled traders.
If you want to join a group of professional traders, researchers, and friends, take a look at our trading newsletter to learn how we can help you find and execute better trades each month. We believe 2019 and 2020 will be incredible years for skilled traders and we are executing at the highest level we can to assist our members. In fact, we are about to launch our newest technology solution to better assist our members in creating future success.
Our team has 53 years of experience in researching and trading makes analyzing the complex and ever-changing financial markets a natural process. We have a simple and highly effective way to provide our customers with the most convenient, accurate, and timely market forecasts available today. Our stock and ETF trading alerts are readily available through our exclusive membership service via email and SMS text. Our newsletter, Technical Trading Mastery book, and our Trading Courses are designed for both traders and investors. Also, some of our strategies have been fully automated for the ultimate trading experience.
Chris Vermeulen
Technical Traders Ltd.
https://thegoldandoilguy.com/wp-content/uploads/2019/03/chart1-2.png440700adminhttp://www.thegoldandoilguy.com/wp-content/uploads/2014/11/tgaoglogo.pngadmin2019-03-31 11:57:492019-03-31 11:57:49Proprietary Cycles Predict July Turning Point for Stock Market
As we’ve been suggesting for months, expect continued moderate price weakness in Gold and Silver through most of April 2019 and possibly into early May 2019 before a strong price rally will setup and push Gold prices well above $1500 before the end of 2019. Our Adaptive Dynamic Learning predictive price modeling system has been calling for this move for many months (see the chart below). This advanced predictive price modeling system is suggesting that in May/June of 2019, we will likely see a bigger price rally unfold in Gold and Silver which may be paired with some type of geopolitical or global economic event. See this article for more details.
Gold rallies on fear (in most cases) and the only reason for Gold to really as our ADL predictive modeling system is suggesting is that some renewed level of fear could enter the global markets. This could be from any type of global crisis event or even a regional crisis event (think Brexit, EU crisis or some other foreign nation crisis). We believe skilled traders should be actively seeking to identify buying opportunities below $1295 in Gold as we only have about 20 days left before our original bottom/base date of April 21, 2019.
This Gold Monthly chart, below, highlights the ADL predictive modeling systems expectations as well as the three support levels that we believe all Gold traders should be targeting. Gold is currently within the first target level and an opportunity to buy below $1295 would be an excellent starting position. Further, any additional opportunity to buy below $1250 should be an incredible opportunity – if it happens. Lastly, our lowest support level is below $1165. Although unlikely, if Gold retraces to below this level, then please don’t miss this opportunity to get into additional long positions.
Our ADL predictive price modeling system is suggesting that May & June 2019 will start a bullish price rally in Gold and Silver that should push prices well above $1500 by October/November 2019 – possibly much higher. Overall, we believe this could be the beginning of a much bigger upside leg in Precious metals and all traders need to be aware of this future price move.
We’ve been suggesting this could be the “move of a lifetime” setting up in the metals because it will likely pair or align with some type of broader global stock market move to the downside. Our opinion is that May/June are dates that all traders should consider developing very protective positions as the markets shake up and Gold begins this incredible run higher.
Take a minute to visit www.TheTechnicalTraders.com to learn how we help our members find and execute better trades while keeping them aware of market trends, cycles and key insights using our proprietary predictive price modeling utilities. We are certain you will find our research above and beyond anything else you’ve seen anywhere on the planet. Please consider joining our other hundreds of members in developing better skills and finding incredible opportunities for future success while trading with www.TheTechnicalTraders.com.
Chris Vermeulen
https://thegoldandoilguy.com/wp-content/uploads/2019/03/Chart_19-03-30_GC_ADL.png506700adminhttp://www.thegoldandoilguy.com/wp-content/uploads/2014/11/tgaoglogo.pngadmin2019-03-30 21:40:552019-03-30 21:40:55ADL Predictions For Price of Gold
Our research team, at Technical Traders Ltd., has been all over the precious metals markets for the past 16+ months. We’ve been so deep into research and study with regards to price action and technical/fundamental data, that we’ve been able to call market moves many months in advance.
Recently, over the past few months, we’ve been warning that an April 21~24 date is likely to set up an ultimate price bottom in the precious metals market. It could prompt a broader upside price swing that should eventually lead to a much bigger upside breakout move. On March 8, 2019, we posted this article that clearly outlined our thinking at that time saying a bounce to $1315-1320 before heading down to $1255.
Take a minute to read that article and consider this current downside price action as a gift the precious metals markets are allowing for all of us. This is the move that we’ve been warning about for months – the retracement from the $1315~1320 level that should bottom out near $1240~1265 and will ultimately become the “momentum base” for the future upside move. Precious metals are starting a move that we predicted many months ago. Our researchers believe Gold will trade below $1275 for a brief period of time (likely just a few days or weeks) before setting up a broad-based momentum bottom. Our objective is to “leg into” this setup with a series of long trades for the ultimate upside breakout.
Our research suggests that near the end of April 2019 or in early May 2019, Gold prices will likely begin a strong upside price move that will quickly target the $1500+ price level. We believe this current price swing will set up as the last real opportunity for skilled traders to accumulate long positions in precious metals while we wait for the April/May breakout move. Any opportunity to buy near the lower range of our Buy Zones would be an excellent entry position given our future prediction that a massive upside breakout move is just 20~30 days away from starting.
This Daily Gold chart shows just how deep the Buy Zone is for Gold. Any price activity below $1275 would be a solid entry for skilled traders. Any further opportunity to add to that position below $1265 is even better. Ultimately, we believe the $1240 to $1250 level will hold as support for the momentum bottom.
This Weekly Gold chart highlights our Buy Zone in broader price perspective. As you can see, the $1250 level corresponds to a price peak back in October/November 2018. We believe this level will act as long-term support and that price will bottom between $1240 and $1265 before the upside price swing begins.
This last Weekly Silver chart highlights the fairly narrow Buy Zone in silver that will allow traders to accumulate long position near of just above $16.50. We believe this $16.50 level will become key support throughout this April 2019 lower price rotation. Remember, near the end of April or in early May, we strongly believe a new upside price move will take place that will blow through recent highs and prompt a 12 to 25% upside price move. Our target for Gold is above $1500 (likely $1575 to $1675). Our upside target for Silver is $17.50 to $19.50 with this first upside leg. Our opinion is that this initial upside leg could be the start of a much larger and much more profitable price advance – lasting many months.
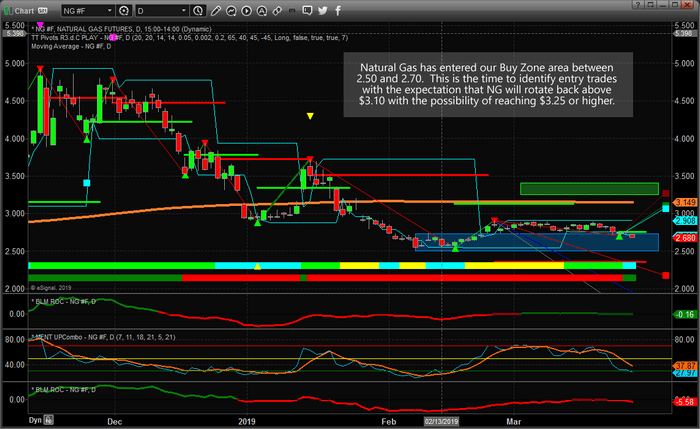
Recently, we warned that Natural Gas may set up another opportunity for traders to buy into a support zone below $2.70 with a selling range near or above $3.00. Our upside target zone is between $3.25 and $3.45. The price of Natural Gas has recently fallen below $2.69 and we believe this could be the start of a setup for skilled traders to identify key buying opportunity in preparation for a quick +8% to +15% upside swing.
Historically, March and April have been pretty solid months for Natural Gas. Let’s go over the historical data using three different seasonality charts which all point to higher prices.
Taking a look at the data, above for both March and April it appears we should have a positive price outcome over the next 20+ trading sessions. Thus, we can determine that the likelihood of a positive price swing between now and the end of April is highly likely.
When we take a look at the chart data to see how our BUY and SELL zones are setting up, it becomes clear that any opportunity to BUY into the lower support channel, with a moderate degree of risk, could result in a very nice profit potential of between $0.35 to $0.70 on data that supports the Bullish potential as a 200%~220% advantage over downside potential.
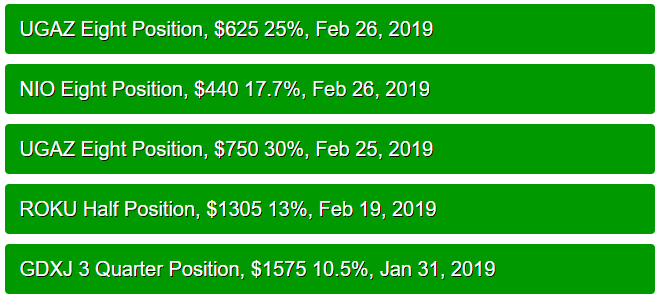
Take a look at the data that we are presenting and try to understand that these types of historical price triggers are not foolproof, yet they do provide a clear advantage. They allow us to see if and when there is any type of advantage to our decision making and if we can identify any real opportunity for future success. We believe any further downside price activity in Natural Gas will result in additional opportunities for Long trades with $2.45 being our absolute low entry target. Our upside exit target would be any level above $2.95, or higher, and our ultimate target objective would be $3.15 or higher. Our last trade in natural gas (UGAZ) gave us 30% return in just two weeks in February!
This could be another opportunity for a trader to target a quick 8% to 15% swing trade in Natural Gas over the next 20+ days. Time to put Natural Gas on your radar again!
Are you ready for this next move? Want to know how we can help you find and execute better trades? Visit www.TheTechnicalTraders.com to get our, technical indicators, market analysis, daily videos and trade alerts.
Chris Vermeulen
Technical Traders Ltd.
https://thegoldandoilguy.com/wp-content/uploads/2019/03/seasonal2.png573838adminhttp://www.thegoldandoilguy.com/wp-content/uploads/2014/11/tgaoglogo.pngadmin2019-03-27 21:40:262019-03-27 21:40:26Natural Gas Sets Up Another Buy Opportunity
Our research team believes the upside pricing potential of the US market could be under-estimated by global traders and investors. We’ve been pouring over the charts and data trying to substantiate our hypothesis with our proprietary price modeling systems and technical analysis systems for the past few days. Our results suggest the US stock market, in comparison to the global markets, could still be under-priced at current levels based on investor sentiment and this could be just the beginning of a super cycle rally we have seen happen one before.
Last year during the price rotation in February 2018, we hypothesized the current rotation was not the end of a 5-Wave Elliot Wave formation. We believe the January 2018 highs are potentially the end of Wave 3 which is part of a much larger Wave A upside price swing. Our research suggested that the retracements in 2010 and 2011 were not sufficient to qualify as any type of traditional Elliot Wave structure, thus the retracement in 2015 qualified as a Wave B formation. This presented an upside Wave A size of +366%, or +$89.66, on the QQQ chart. The Wave C move, from the lows of 2015 to the highs of 2018, presented an upside Wave C size of +121%, or +$102.77. Given these Wave A and C sizes, we believe the upside potential of a final Wave E (the last wave higher) in the US stock market could be at least 100% to 161% the size of the last Wave C formation.
This presents a very interesting possibility that our most recent article about the Treasury Yield Inversion and the concerns about a pending recession may be setting the wrong tone for traders. Yes, the 2020 Presidential election cycles typically result in some price rotation and sideways trading for US stocks. This may hold true over the next 16+ months before the elections and there may not be much we can do about it other than trade these price rotations. After the elections, though, we believe the upside price potential for the US stock market could be incredibly under-estimated. How under-estimated, you ask? The upside potential could be as large as +20% to 25% or more.
The red box on this Weekly NQ (NASDAQ) chart highlights the Fibonacci and Elliot Wave target levels when we presume a 100% upside price leg. Please remember the upside leg could be as large as 161%, 200% or more on this final Wave E (or Wave 5). The projected upside target levels on the NQ are near 9250 (or higher).
The same types of price projection points (or targets) using the Fibonacci and Elliot Wave theories predict a similar upside target level on this Weekly YM (DOW JONES) chart. Current price rotation suggests an upside target near $31,000 for the YM (or higher) before this upside move completes.
Remember, the US Presidential election cycles typically mute price rotation a bit and present a bit of sideways trading. We’ve highlighted our expectations on the following Custom Market Cap Chart we follow that helps us determine where price levels are in relation to historical norms. You can see from this chart that we are currently sitting right at the historical middle pricing level going back almost 8 years. We would expect a moderate upside pricing bias to continue as we head into the US election cycle with mild price rotation. After the election cycle is complete, which is highlighted on this chart, we assume market price capitalization would be below historically normal levels and poised for an upside move (assuming a new US President is not elected with plans/policies to disrupt current GDP and economic growth factors).
Typically, Wave E (or Wave 5) formations can be relatively short in structure, or at least as long as Wave A or Wave C. It is most common for Wave E formations to at least be as long as Wave C and in many cases, Wave E can extend well beyond Wave C length.
We believe the next 16+ months will test the abilities and skills of truly skilled traders. We believe price rotation and sector rotation will be key to finding and executing proper trades. All the while, remember that a biased upside price trend will likely continue. As we get into the final 4~5 month’s price to the US elections, be prepared to identify and set up some exceptional trading opportunities. If our research is correct, this last move higher will begin somewhere near January 2021 and the upside move could last until our cycle peak date of 2027 which may sound crazy, but I will share you with a super cycle higher that could happen, and we have seen this before. Stay tuned for the Part II of this Special Report
Find out how our research and trading team can assist you in finding and executing better trades throughout all of these moves. We are about to launch our newest technology solution for our members at www.TheTechnicalTraders.com and we believe we provide some of the best research, daily video analysis and trading triggers you can find anywhere on the planet. We like to keep things simple and manageable for our members. We issue 2~3 trades a week (max) and we target 5~25% swings in ETF and stocks. We also provide incredible insight into the markets which allows you, the skilled trader, to make your own trading decisions while being better informed and understanding current market dynamics.
https://thegoldandoilguy.com/wp-content/uploads/2019/03/supercycle.png431678adminhttp://www.thegoldandoilguy.com/wp-content/uploads/2014/11/tgaoglogo.pngadmin2019-03-26 22:06:222019-03-26 22:06:22Are Investors Blind To The Equities Upside Super Cycle?
With so much news hitting the wires regarding the Treasury Inversion level and the “potential pending recession”, we wanted to shed a little insight into this phenomenon and what we believe the most likely outcome to be going forward. Our researchers, at Technical Traders Ltd., believe the Treasure inversion is a reactionary process to overly tight US Fed monetary policies, consumer demand factors and outside cycle forces. There is very little correlation to inverted Treasury levels and causation factors other than the US Fed and global central banks. We believe consumers and consumer sentiment also play a role in setting up the conditions that prompt yield inversion. The one aspect we believe everyone fails to consider is the uncertainty that is associated with major US election cycles.
The US Fed is obviously a driving force with regards to yields and consumer expectations. In the past, the US Fed has rotated FFR levels up and down by enormous amounts (in some cases 200 to 500%+ over very short spans of time. Consumers, you know those people, the ones that are the actual driving force of the local and state level economies, have been the the ones having to deal with wildly rotating FFR levels and the consequences of their debt rotating from 4~7% average interest rates to 8~25%+ average interest rates over the span of just a few years.
Take a look at this chart that highlights the current and previous US Federal Reserve FFR rate changes. It is quite easy to see that consumers and business, on the receiving end of these changes, often swing from one extreme to another as the US fed makes these dramatic moves. And, yes, that last 2400% number is correct. The FFR went from 0.06% to 2.4% over the past 3+ years – do the math yourself if you don’t believe us.
Let’s talk about how the US economy operates as a host to the global economy for a second. When the US economy is booming, it exports growth, opportunity, and activity to the rest of the world. When the US economy is contracting, it exports contraction, diminishing opportunity and slower economic activity to the rest of the world. This may be a bold statement to make, but it is true. For the past 80+ years, the US economy has been the “mothership” of the global markets in terms of creating and exporting growth and opportunity for foreign nations.
The US Fed, therefore, has an incredible responsibility to safely navigate the current and future global expectations with regards to FFR levels and yield levels as the global economy expands and contracts with political, trade and social issues. It is a very difficult process to navigate for anyone.
US Presidential Election cycles also play an important role in how these expansion and contraction cycles take place. Anyone with any understanding of Music understands each note includes an “Attack” and “Decay” process. The same thing takes place in economic cycles. Within the Attack phase, the economy builds strength, capability, and output, just as the musical note does. Within the Decay process, the economy begins to wain in strength, capability, and output, just as the musical note does. The process within the global economy is very similar to an orchestra of musical instruments playing difference components of the music output. Some play loudly and dramatically, others play softly and more demure. The outcome is a finely balanced and enjoyable musical presentation. The global economy is very similar to this and right now we are starting to see a slower, softer period of economic activity throughout the global economy.
Currently, the US is starting a new Presidential Election cycle where dozens of Democrats are lining up against President Trump. This is sure to be a battle that will rival “Rocky II” in terms of scale and scope. It is also starting far earlier than most normal mid-term Presidential election cycles. This is one of the biggest reasons we believe the Treasury yields may stay rather muted for the next 12+ months while the end of the “attack phase” plays out for the global economy. Eventually, the “decay phase” will begin within the global economy and we’ll start the process of waiting for the US Fed and central banks to rally opportunity with lower rates and possibly QE ventures.
We’ve highlighted the US Presidential Election “run-up” cycles (the hyperbole 16-month process that takes place before the actual elections) in BLUE on these charts. It is fairly simple to see that the combination of the US Fed rate levels, US political controlling party policies and consumer sentiment related to these policies and economic factors have driven yields higher or lower throughout the past 50+ years. In fact, the US and the Globe have recently transitioned from more of a regionally localized global economy to more of a centrally functioning global economy. One thing has not changed, though, the US is still the largest of the global economic drivers and will continue to be for the foreseeable future.
When we take into consideration how these yield contractions have resulted in asset price changes in the US stock market, we need to compare these moves in yield with the expectations of traders, investors, and capitalists throughout the world. Remember, the US stock market is currently, and has been, a pool asset valuation protection for global investors throughout the planet. Over the past 40+ years, the US economy has exported opportunity and capacity throughout the globe while global investors have continued pour capital into US stocks, Bonds and Debt because of the strength of the US Dollar.
Our expectations are that the yield inversion, much like the inversion near 1980/1990 is the precipice of a renewed economic expansion as the planet develops new 21st-century trade, economic and political ties while shedding the 19th-century shackles that are currently binding it to obligation and debt originating from the 1960s through 1980s. This transition period may be fraught with some dramatic price swings in assets, stocks and economic output levels. Yet, we believe the outcome of this process will be a fantastic opportunity for skilled traders to find and execute tremendous upside pricing opportunities once it completes.
We have been completing a series of market cycle research that focuses on the alignment and timing of core global cycles. By our research, 2027 and 2048 are key years for the global markets. We believe 2027 will likely be a breakout year where the global markets align for an incredible upside price increase and we believe 2048 could be the year that the global economies exhibit some type of “metamorphosis” in terms of capacity and function.
In short, we believe these current inverted yields are nothing more than a “symptom” of the current political and US Fed FFR interest rate climate in combination with the current global economic output capacity and consumer sentiment. To put it simply, after the US Fed raised rates by 2400%+ and the current trade and political issues are still unresolved – where do you expect yields to be moving? Right, into further contraction while the US Fed tightens monetary policy and consumers react by tightening their spending.
Once the trade issues are resolved and the US Fed adopts a bit of easing in terms of current rates, we may continue to see have another year of wild and choppy market condition much like 2015, and 2018, but that all depends on what type of resolution there is with the current trade issues.
We’ll keep you informed of our research and longer-term date cycles as we continue to extract more concrete data from our research. If you like our research and can clearly understand the value of having a team of dedicated market technicians and researchers working for you to help you find and execute better trades, then please visit www.TheTechnicalTraders.com to learn how we can help you. This US presidential election cycle is going to have top billing for the next few months – get used to it and get used to the fact that the markets and yields will likely do what they always do within these cycles – muted price rotation where underlying fundamentals and consumer sentiment will likely drive future pricing. Stay tuned and watch precious metals.
https://thegoldandoilguy.com/wp-content/uploads/2019/03/chart1-1.png282700adminhttp://www.thegoldandoilguy.com/wp-content/uploads/2014/11/tgaoglogo.pngadmin2019-03-25 21:00:522019-03-25 21:00:52Treasury Inversion and Political Fed Cycles