August 8th
I find it amazing how many traders do not use volume as a factor in their trading decisions. I believe it’s always important to track the volume no matter which time frame you are trading simply because it tell you how much interest there is for that investment at that given time and price level. If you use volume and understand how to read it when located at the bottom of the chart which is the standard way of reading it then your well ahead of many traders and just may find this little volume indicator helpful.
Price and volume are the two most important aspects of trading in my opinion. While news and geopolitical events cause daily blips and in rare occasions change the overall trend of an investment, more times than not its better to just trade the underlying trend. Most news and events cannot be predicted so focusing on the price action and volume helps tell us if investors are bullish or bearish for any given investment.
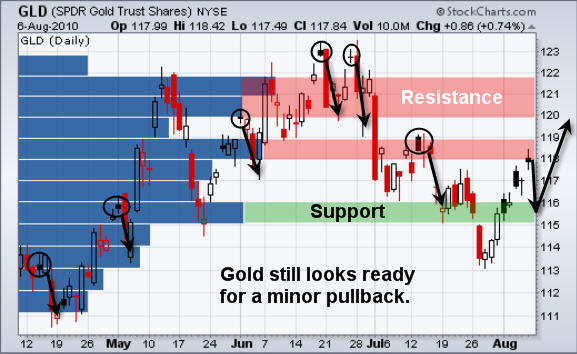
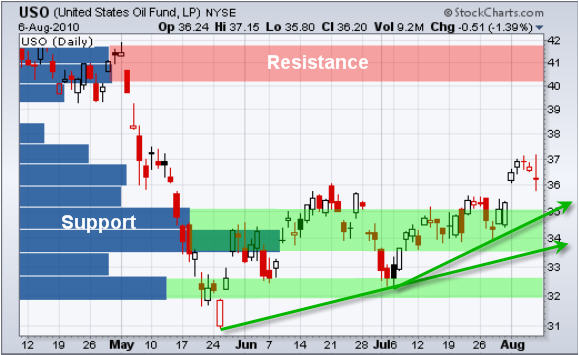
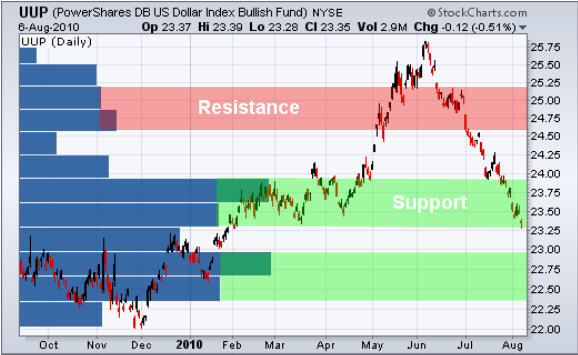
Below are a few charts showing the volume by price indicator in use. Reading this indicator is simple, the longer the blue bars the more volume had traded at that point. High volume levels become key support and resistance levels.
SPY – SP500 Exchange Traded Fund
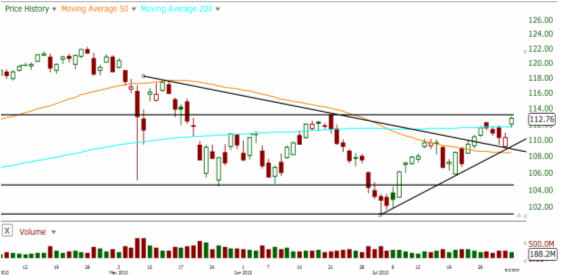
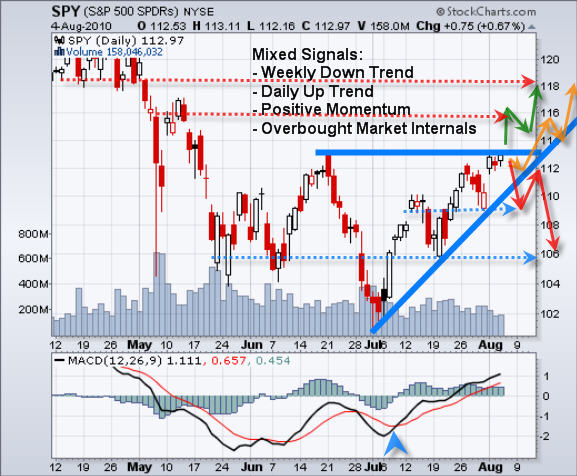
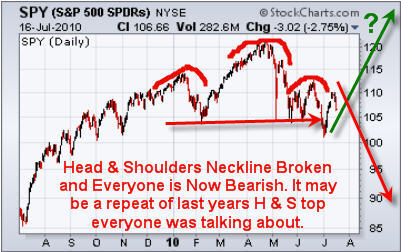
As you can see on the chart below and I have pointed out key support and resistance levels using the volume by price indicator. The thin red resistance levels would be areas which I would be tightening my stops and or pulling some money off the table.
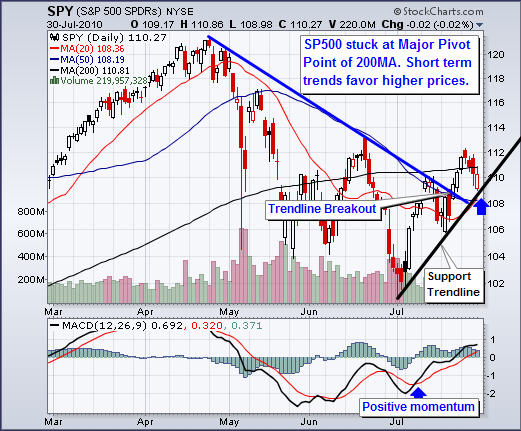
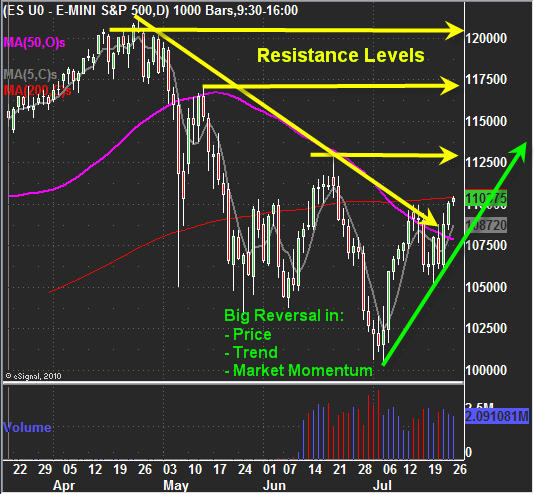
The SP500 is currently trading at the apex of this wedge. The market internals as of Friday were still giving a bullish bias which should bring the index up to resistance once more on Monday or Tuesday. From there we will have to see if we get another wave of heavy selling or a breakout to the upside.
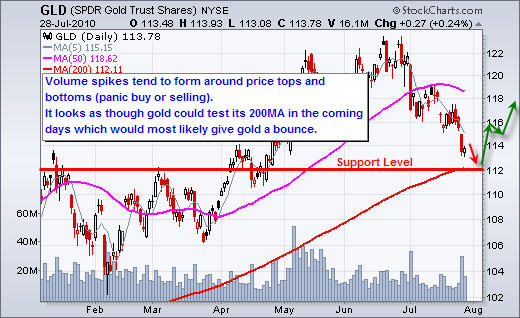
GLD – Gold Exchange Traded Fund
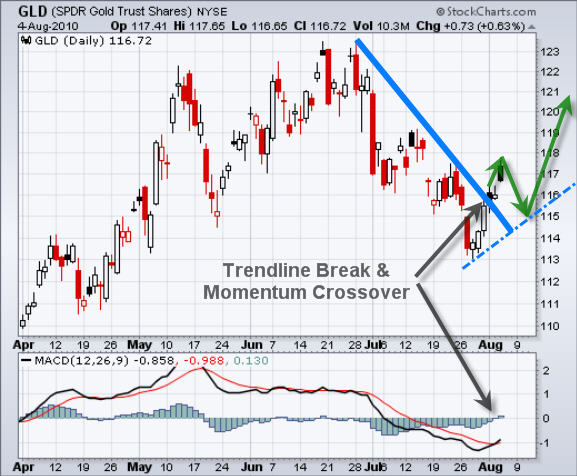
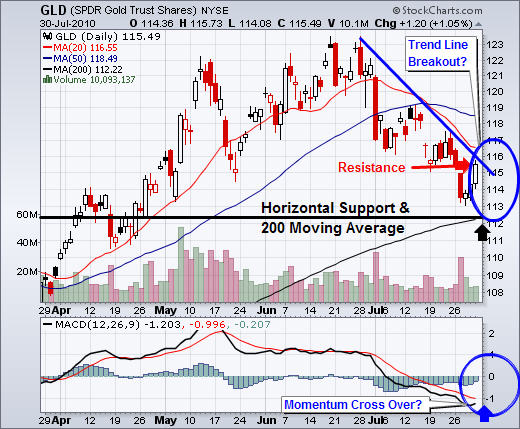
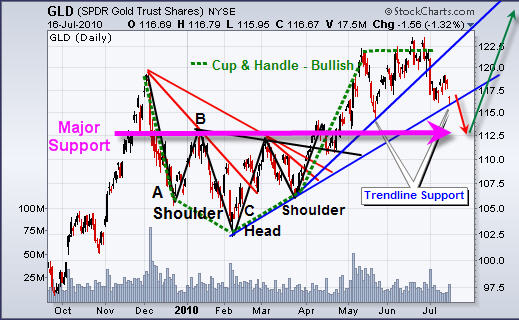
Gold has the opposite volume to price action as the SP500. We are seeing a lot more over head resistance and that’s going to make it tough for gold to make a new high any time soon.
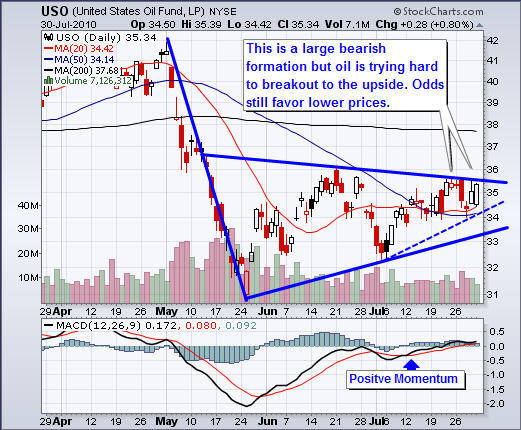
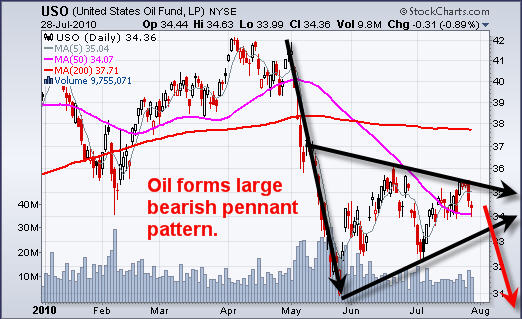
USO – Crude Oil Trading Fund
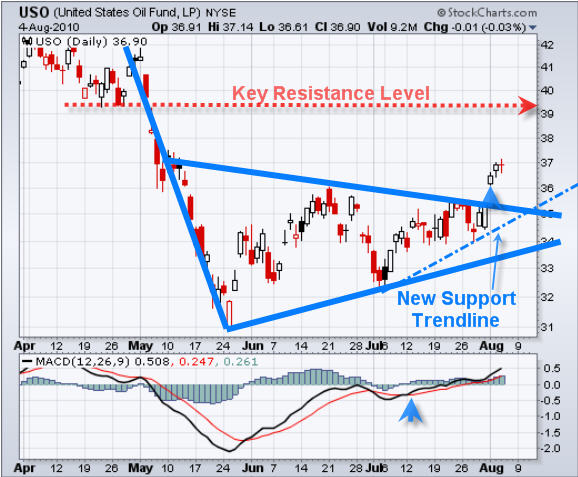
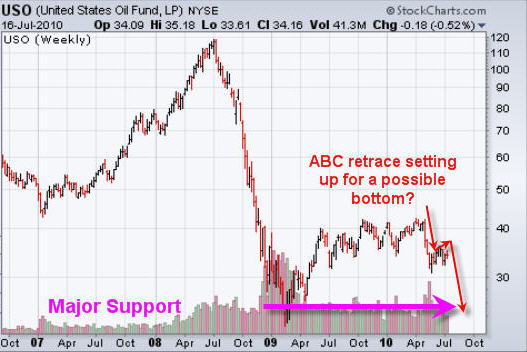
Crude oil broke out of is rising wedge last week and has started to drift back down as traders take profits. Many times after a breakout we will see prices dip down and test that breakout level before continuing in the trend of the breakout. I should point out that there is a large gap to be filled from last Monday’s pop in price and we all know most gaps tend to get filled.
UUP – US Dollar Exchange Traded Fund
The dollar has been sliding the past 2 months and it’s now trading at the bottom of a major support level. If the dollar starts to bounce it will put some downward pressure on stocks and commodities.
Weekend ETF Trend Conclusion:
In short, I feel the market has a little more life left in it. I’m expecting 1-2 more days of bullish/sideways price action, after that we could see the market roll over hard. It’s very likely the US dollar starts a significant rally which will pull stocks and commodities down.
With the major indices and gold trading at key resistance levels, traders/investors ready to hit the sell button, and the dollar at a key support level I think its only a matter of time before we see a sharp snapback. That being said there is one scenario which is bullish and could still play out. That would be if the US dollar starts to flag and drift sideways for a week or so, and for stocks and commodities to also move sideways before taking another run higher. Watching the intraday price and volume action will help us figure out if buyers are sellers are in control this week. Anyways that’s it for now.
If you would like to receive my ETF Trading Alerts visit my website at: http://www.thegoldandoilguy.com/specialoffer/signup.html
Chris Vermeulen
GET THESE REPORTS SENT TO YOUR INBOX FREE


