
Bitcoin Price Collapse Continue For Many Months
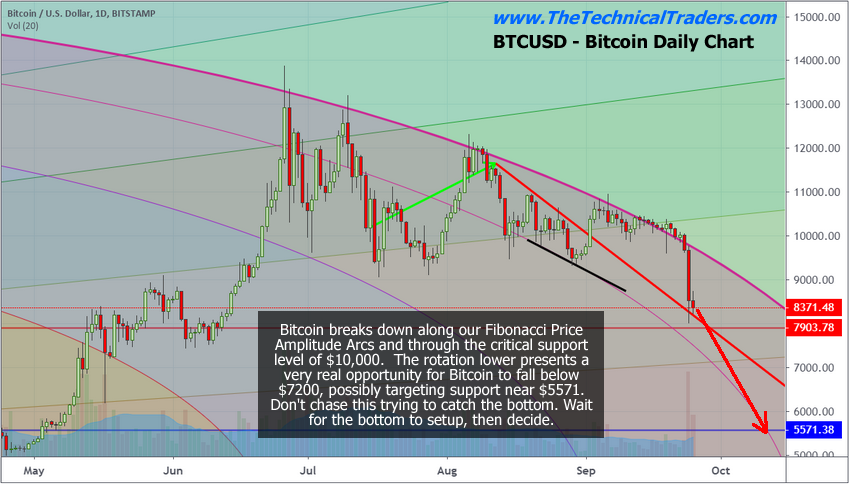
The recent price collapse in Bitcoin may be the start of a much bigger price trend in the Cryptos. The support level near $9000 has been breached and the current resistance arc, see the MAGENTA Fibonacci Price Amplitude Arcs on these charts, are clearly acting as a major contracting price resistance level. Our research suggests price will find support near $7900, then $5571, then possibly just above $2000. But first, be sure to opt-in to our free market trend signals newsletter
The Fibonacci Price Amplitude Arcs are a proprietary modeling tool we use to measure and track how price may react based on previous price swings. They are the visual deployment of two unique theories; Fibonacci price theory and Tesla’s Mechanical Resonance theory. The basis behind our thinking when we created this proprietary tool was that Fibonacci price theory suggests that all price movement is related and structured to previous price movements and that Tesla’s theory that everything we touch, see and know to exist is the result of ENERGY suggested to us that ENERGY may be one of the most important components in understanding price movement.
Energy is typically measured in Volts and Amps. We adopted a different approach to this thinking, we used Sound structures and energy as the basis for our proprietary analysis: attack, intensity, decay, sustainability, amplitude, and frequency, as well as pressure and velocity.
“In Physics, sound energy is a form of energy. Sound is a mechanical wave and as such consists physically in oscillatory elastic compression and in oscillatory displacement of fluid. Therefore, the medium acts as a storage for both potential and kinetic energy.”
source : https://en.wikipedia.org/wiki/Sound_energy
Imagine trying to unlock the concept that Time and Price are a fluid environment where energy (price movement over time) creates a lasting and dynamic method of storing energy, displacing energy and developing kinetic energy that could interact and displace future price trends, rotations, swings?
How in the world would you attempt to identify or study these types of price energy waves to attempt to develop a system of successfully using these tools for trading and analysis?
You do exactly what we did – you try to apply your best researchers to the task and attempt to validate your research across various platforms, symbols, and sets of data.
With more than 54 years of experience in the markets and have studied almost all types of price theory, technical analysis, and other types of market price, technical, and fundamental analysis techniques. We put our skills to the test every day in order to find and execute the best trades. If you want to see more of our trading indicators and tools click here.
BITCOIN FIBONACCI PRICE AMPLITUDE ARCS
These Fibonacci Price Amplitude Arcs, as we call them, are what we believe to be the hidden price energy wave that exists behind the linear constructs of the charts we are used to seeing. They work by creating breakouts and channels that price must react to. In this case, the Magenta price arc is acting as a contracting ceiling for the price (resistance) and price should continue to stay below the MAGENTA price arc until it reaches a point where enough energy exists to break through that arc.

WEEKLY BITCOIN CHART
This Weekly Bitcoin chart provides a better example of how our proprietary Fibonacci Price Amplitude arcs are deployed. In this example, we can clearly see the bottom that formed in late 2018 and the peak that formed in late June 2019. We can see two HEAVY Fibonacci Price Amplitude Arcs: one MAGENTA and the other one GREEN. These are what we believe are the major amplitude arc levels. The others are minor levels.
Each peak or valley on this chart sets up a new Price Amplitude energy pattern. Some are more relevant than others in term of how price will react to them. All of them are important to understand and to help us relate to how price may move in the future, yet we try to stick with the most important Fibonacci Price Amplitude Arcs when we share charts with our readers. You’ve probably seen some of our other research charts with lots of arcs and lines drawn all over them – those are part of our research team’s work to dig into the hidden energy layer that exists behind price activity on every chart.
This Weekly Bitcoin chart suggests that price will continue to attempt to test various support levels while staying within the Magenta price arc. We believe the $5571 level is the likely target at this time.

Don’t chase this move lower in Cryptos. Wait for the bottom to setup and form before looking for the next move higher. If price breaks below $5571, then we could see a target level near $2100 very quickly. If price is unable to generate enough energy to break the Magenta price arc, time will eventually push price into the next arc series where a broader price range/rotation may be in the future.
5 OTHER CRUCIAL WARNING SIGNS ABOUT THE US MARKETS TOPPING AND THE GOLD AND SILVER BULL MARKET
In early June I posted a detailed video explaining in showing the bottoming formation and gold and where to spot the breakout level, I also talked about crude oil reaching it upside target after a double bottom, and I called short term top in the SP 500 index. This was one of my premarket videos for members it gives you a good taste of what you can expect each and every morning before the Opening Bell. Watch Video Here.
I then posted a detailed report talking about where the next bull and bear markets are and how to identify them. This report focused mainly on the SP 500 index and the gold miners index. My charts compared the 2008 market top and bear market along with the 2019 market prices today. See Comparison Charts Here.
On June 26th I posted that silver was likely to pause for a week or two before it took another run up on June 26. This played out perfectly as well and silver is now head up to our first key price target of $17. See Silver Price Cycle and Analysis.
More recently on July 16th, I warned that the next financial crisis (bear market) was scary close, possibly just a couple weeks away. The charts I posted will make you really start to worry. See Scary Bear Market Setup Charts.
CONCLUDING THOUGHTS:
In short, you should be starting to get a feel of where stocks are headed along with precious metals for the next 8-24 months. The next step is knowing when and what to buy and sell as these turning points take place, and this is the hard part. If you want someone to guide you through the next 12-24 months complete with detailed market analysis and trade alerts (entry, targets and exit price levels) join my ETF Trading Newsletter.
Be prepared for these incredible price swings before they happen and learn how you can identify and trade these fantastic trading opportunities in 2019, 2020, and beyond with our Wealth Building & Global Financial Reset Newsletter. You won’t want to miss this big move, folks. As you can see from our research, everything has been setting up for this move for many months.
Join me with a 1 or 2-year subscription to lock in the lowest rate possible and ride my coattails as I navigate these financial market and build wealth while others lose nearly everything they own during the next financial crisis.
As a technical analysis and trader since 1997, I have been through a few bull/bear market cycles. I believe I have a good pulse on the market and timing key turning points for both short-term swing trading and long-term investment capital. The opportunities starting to present themselves will be life-changing if handled properly.
FREE GOLD OR SILVER WITH MEMBERSHIP!

Kill two birds with one stone and subscribe for two years to get your FREE PRECIOUS METAL and get enough trades to profit through the next metals bull market and financial crisis!
Chris Vermeulen – www.TheTechnicalTraders.com


