
Adaptive Predictive Modeling Suggests Weakness Into 2020
Our Adaptive Dynamic Learning (ADL) predictive modeling system is suggesting the Transportation Index will fall to levels near $10,000 over the next 2 to 3 weeks which would indicate moderate price weakness in the US stock market and the global stock market.
Our ADL predictive modeling system attempts to model future price activity by finding and mapping critical price and technical elements within the historical price action. In a way, this is like mapping the future by attempting to learn from the past. You can get all of my trade ideas by opting into my free market trend signals newsletter.
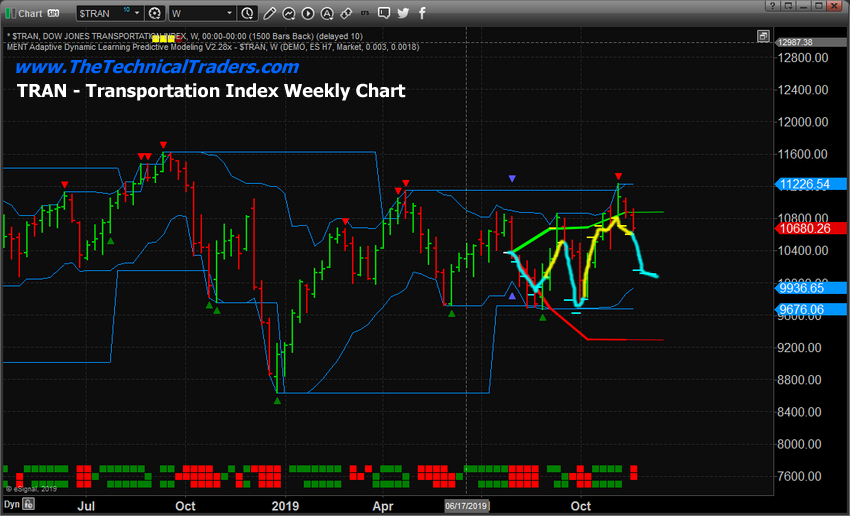
WEEKLY TRANSPORTATION INDEX CHART #1
This first Weekly Transportation Index chart highlights the ADL predictive modeling results since the end of July 2019. Notice the CYAN and YELLOW lines drawn on this chart showing what the ADL predictive modeling system suggested would happen over time. This Technical ADL pattern consisted of SIX historical reference points and suggests the last three weeks’ price levels have a 63 to 84% probability rate. This would indicate a fairly strong probability that prices will fall as the ADL predicts.

WEEKLY TRANSPORTATION INDEX CHART #2
This second Weekly Transportation Index chart highlights the ADL predictive modeling results from early September 2019. The results are quite similar across these two charts. Although the September results highlight a bit more potential price rotation than the earlier July ADL results.
This September ADL predictive modeling chart suggests the TRAN price will fall dramatically to levels below $10,000, then recover a bit. After that, the price will continue to settle near the $9,700 to $10,000 level throughout the end of 2019. This downside price move in the Transportation Index suggests the US and Global markets will experience some extended price weakness over the next 3 to 6+ weeks.

The decline in the Transportation Index suggests an overall weakness in the global economy. If that translates into true price action in the global markets, we could see a series of lower lows set up in the US Stock Market over the next 4 to 6+ weeks.
General price weakness may become a waning anthem for the global stock market headed into the start of 2020. Take a look at this NQ (Nasdaq) Weekly ADL chart to see what our predictive modeling system is suggesting will happen over the next 60 to 10+ weeks.

If our ADL predictive modeling system is correct, the NQ will fall to price levels near or below $7,700 over the next 2 to 4+ weeks before attempting to settle near $8000 near the end of 2019. A couple of days ago I shared an interesting article talking about the VIX ready to rocket higher which is linked to this pending decline. As a word of warning, the price can, and often does, move beyond the ADL predictive levels on extended/volatile price swings. So be prepared for what may happen as price rotates.
As we are nearing the US Thanksgiving holiday weekend, we wanted to alert you to the fact that we’ve created incredible Black Friday membership subscription options for all of our followers to take advantage of. These special savings rates will run through the end of November – so don’t miss out by joining the Wealth Building Newsletter right now!
Chris Vermeulen
Technical Traders Ltd.


