March 8th, 2019 may gain some level of infamy over the next few decades. There were two big numbers released on this day, the current Chinese economic data and the US Jobs data for February 2019. Both numbers fell drastically lower than analysts expected and the global stock markets dropped in pre-market trading by more than 1%. Yet, something very interesting transpired through the trading day – a recovery rally.
The Chinese economic data was particularly devastating. It leads our researchers to ask a very critical question, “is this going to be an orderly contraction or is this contraction going to extend into more chaos?” Our research team believes the economic contraction in China will extend out into much of Asia and nations participating in the Belt Road Initiative (BRI) over the next 3~6+ months. We believe a natural progression of “protectionist processes” will begin to take place throughout many of these nations as the money spigot from China dries up. We believe this credit contraction and economic downturn will result in an extended repositioning of priorities, assets, and valuations throughout most of SE Asia and India. It could extend into certain areas in Europe and Arabic nations.
 (Source: Bloomberg Finance L.P.)
The economic data released by China points to a very real and excessive economic contraction. YoY Exports reported as -16.6% vs. expected +6.6%. YoY imports reported at -0.3% vs. +6.2%. Trade Balance reported as $4.12B vs expected +26.20B. Think about these numbers. In some cases, these values represent a -300 to -700% decrease from expected levels. A recent Bloomberg article suggests the China GDP levels were inflated for the past 9 years or more (https://www.bloomberg.com/news/articles/2019-03-08/china-s-gdp-growth-pace-was-inflated-for-nine-years-study-finds)
As these new economic numbers work through the news cycle, we’re confident that a fairly large group of global investors are going to catch quite a few investors/traders off guard. The recent rally in the Asian/Chinese equity markets has prompted a bit of complacency and upward price expectations by investors. The rally, shown below, from early 2019 till now resulted in a +17.7% increase over a period of about 60 days. We are confident this upside move attracted the attention of many global investors who likely piled into the trade expecting a US/China trade deal over the past 2 weeks to relieve any upside pricing pressures. Now that the data is showing greater risk in the Chinese markets and how that may extend out to other regional markets becomes the top consideration for these investors.
The fact that the Chinese markets may contract by at least 8~15% over the next few weeks must concern larger investment firms and traders. Depending on their leverage, this could be a complete disaster for some. Any extended protectionist move by China and/or additional pressures on the credit/debt balance could push a new wave of defaults and extended downward pricing pressures. Our researchers believe a move targeting recent October/December 2018 lows is not out of the question.

Custom Index – Custom Index chart by TradingView
As we’ve been suggesting in our recent research posts, we believe a new capital shift is taking place. We believe investors were willing to take a risk to jump back into certain market segments where new valuation levels presented some clear opportunities (China, Europe, and others). Yet, we also know that extended risks could quickly change this stance. As renewed fear enters the global markets, it is very likely that a renewed “revaluation event” will take place and investors will start to scramble for safety. This is the capital shift that we have been warning about – a dramatic shift of investment capital away from emerging markets and foreign opportunities move into US Blue Chips and Mid-Caps because of the true US Dollar based safe-haven investments.
Should our expectations of this dramatic capital shift accelerate over the next few months, we’ll likely see the current downward price rotation in the US stock market end sometime in early April as global capital resettles into the US equities.
In the next segment of this research post, we’ll share some critical data that may become a catalyst for the capital shift that we believe is currently taking place.
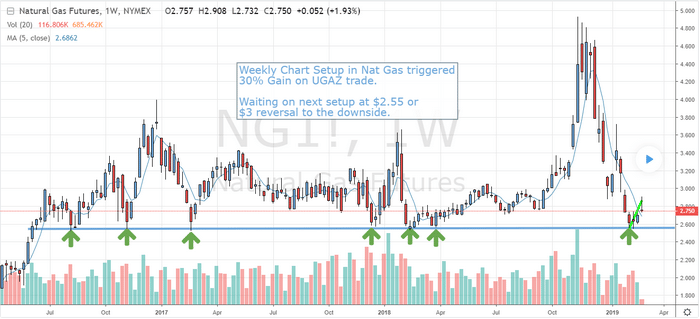
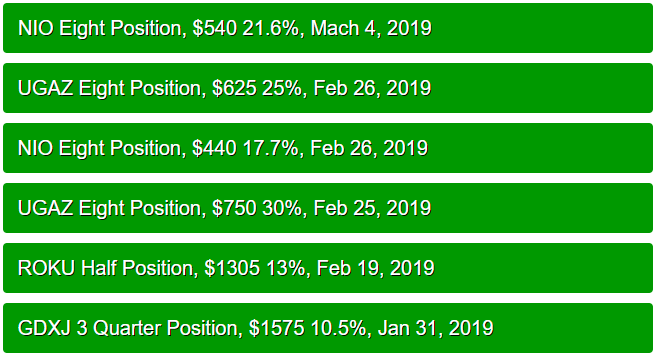
If you want to join a group of professional traders, researchers, and friends, take a look at our trading newsletter to learn how we can help you find and execute better trades each month. We believe 2019 and 2020 will be incredible years for skilled traders and we are executing at the highest level we can to assist our members. We recently close some nice positions UGAZ 30%, NIO 21.6%, ROKU 13%, GDXJ 10.5%. In fact, we are about to launch our newest technology solution to better assist our members in creating future success. In fact, we are about to launch our newest technology solution to better assist our members in creating future success.
Our team has 53 years of experience in researching and trading makes analyzing the complex and ever-changing financial markets a natural process. We have a simple and highly effective way to provide our customers with the most convenient, accurate, and timely market forecasts available today. Our stock and ETF trading alerts are readily available through our exclusive membership service via email and SMS text. Our newsletter, Technical Trading Mastery book, and 3 Hour Trading Video Course are designed for both traders and investors. Also, some of our strategies have been fully automated for the ultimate trading experience.
RECENT CLOSED TRADES
Chris Vermeulen
Technical Traders Ltd.


 Chris Vermeulen, Founder of The Technical Traders shares his thoughts on the recent pullback in gold. There is a debate over sentiment (which remains strong) vs momentum (which is negative) and which one will carry the market in the short term. We also look at the USD and the tech sector in terms of just how much more they can run.