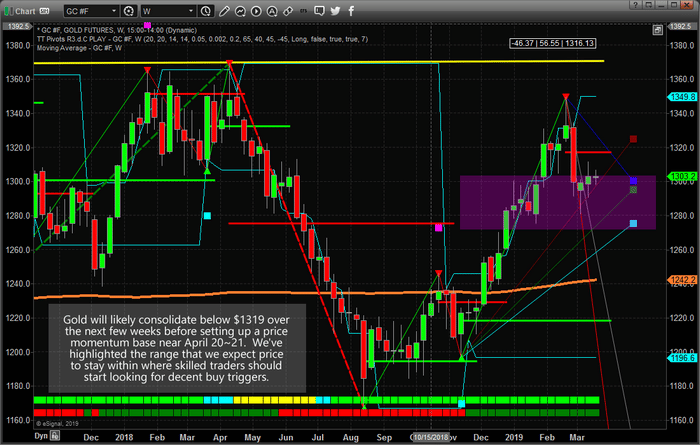
Our research team, at Technical Traders Ltd., believes Gold will continue to base below $1320 for at least another 3~5 weeks before setting up a momentum price base. Our research suggests general weakness in the US stock market over the next few weeks/months as a Head-n-Shoulders pattern unfolds. Interestingly enough, our research also suggests Gold may continue to base below $1320 (likely below $1300) for at least another 2~4 weeks before forming a rounded bottom type pattern as a base.
This would likely result from a mild price rotation in the US major indexes and possibly weakness in the US Dollar. Weakness in the US Dollar and Equities Markets may be just enough impetus to cause Gold to rotate into the Momentum Basing pattern we have been expecting since January 2019. We’ve highlighted the price range, on the chart below, in purple. We believe the price of Gold will re-enter this range at least once or twice over the next 2~4+ weeks to set up a basing pattern. After April 21, we believe the basing pattern should be complete and a new upward price swing should begin.
We expect to attempt to target opportunities below the $1300 price level in Gold to accumulate a LONG position ahead of the upside breakout. The opportunity for prices to stay below $1320 and for skilled traders to pick entry levels that are suitable for their futures should not be underestimated. The next upside price leg in Gold will likely see prices well above $1450.
Take advantage of any price levels below $1290 because this may be the last time you see them for a while. We have also been sharing our stock market forecast looking forward 1-3 weeks from now which goes against everyone’s bias/sentiment including yours likely, but its something you should think about because you could give back a lot of profits if you don’t act now!
Please take a minute to visit www.TheTechnicalTraders.com to learn how we can help you find and execute better trades in 2019. We have already positioned our clients for this move and we believe we can help you stay ahead of these markets. 2019 and 2020 are going to be incredible years for our subscriber the Wealth Building Trading Newsletter.
Chris Vermeulen
https://thegoldandoilguy.com/wp-content/uploads/2019/03/Chart_19-03-18_GC_W_Fib.png445700adminhttp://www.thegoldandoilguy.com/wp-content/uploads/2014/11/tgaoglogo.pngadmin2019-03-20 12:42:212019-03-20 12:42:21Gold To Continue To Base Below $1320 For Weeks
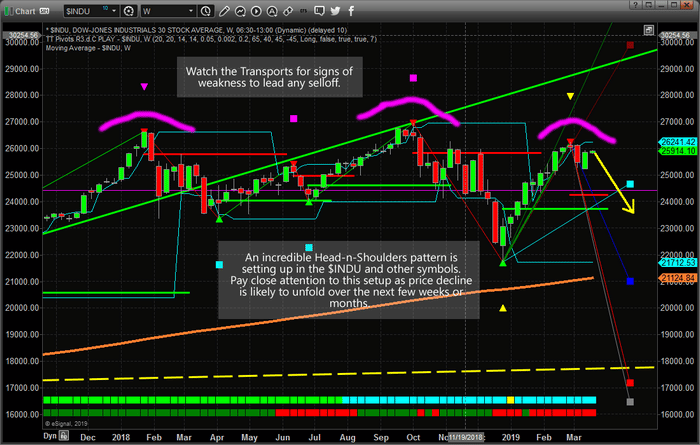
Our research team believes a moderately mild price rotation will unfold over the next 30 to 60 days where the US Stock Market will rotate downward. Particularly, the $INDU (Dow Jones Industrials) should move lower towards the $23,000 to 24,000 before finding support based on the longer term weekly chart. Keep in mind we are not saying the price is going to fall. We are stating price could correct in a big way if recent support levels are broken. If so, then 23,000-24,000 levels should be reviewed.
We have been warning about a specific price pattern that we believe is currently in the process of setting up in the US Stock Market. This pattern is a “Falling Wedge” pattern. We’ve seen a few of these over the past 5+ years in downward retracing price swings. They typically act as a means for the price to explore a “momentum base” setup before breaking out to the upside. You can read our previous research here.
Price weakness could begin to drive market prices lower over the next few weeks as this right Shoulder acts as critical resistance. If you have not already prepared for this move, please try to understand the importance of this long term price pattern. Head-n-Shoulders patterns are typically viewed as major resistance and a classic topping formation. Our belief that the downside price swing from the right Shoulder is based on our predictive modeling systems results. We believe this move will drive prices lower before support is found and our downward sloping wedge pattern sets up. This wedge pattern will likely break to the upside during the Summer months.
This Head-n-Shoulders pattern is something all traders need to pay attention to. This is a critical resistance/top formation that should drive prices lower over the next few weeks/months. If you have not protected your long trades well enough or you have recently deployed a bunch of capital into the markets, we strongly suggest you develop a “Plan B” as we are likely to see a 5~10% correction before this downside swing is over.
Our team has 53 years of experience in researching and trading makes analyzing the complex and ever-changing financial markets a natural process. We have a simple and highly effective way to provide our customers with the most convenient, accurate, and timely market forecasts available today. Our stock and ETF trading alerts are readily available through our exclusive membership service via email and SMS text. Our newsletter, Technical Trading Mastery book, and 3 Hour Trading Video Course are designed for both traders and investors. Also, some of our strategies have been fully automated for the ultimate trading experience.
RECENT CLOSED TRADES
Chris Vermeulen
Technical Traders Ltd.
https://thegoldandoilguy.com/wp-content/uploads/2019/03/Chart_19-03-18_INDU_W_HnS.png445700adminhttp://www.thegoldandoilguy.com/wp-content/uploads/2014/11/tgaoglogo.pngadmin2019-03-19 15:34:282019-03-19 15:34:48Dow Jones Head-N-Shoulders Pattern – Be Aware
This research post highlights what we believe to be a unique price anomaly setup in many of the US major markets this week. Our research suggests that April 21, or near this date, will be an important price inflection point base level for the US stock markets. We believe a unique price base will begin to form near this date and a bigger price move in May/June 2019 will unfold.
Our Advanced Dynamic Learning (ADL) price modeling system is suggesting the rotation in the US stock market may stay somewhat muted before this move on April 21 begins. The ADL predictive modeling system is one of our proprietary price modeling utilities that our research uses to identify key levels of future support and resistance as well as to watch for “price anomalies” that setup. Price anomalies are where the current price level of any symbol is greatly diverted from the ADL predictive price level. When this happens, the price will usually “revert” back to near the ADL levels at some point in the immediate future – sometimes setting up a great trading opportunity.
This Daily YM chart shows a current price anomaly in the YM of about 1000 points. This is a pretty big range for skilled traders that are capable of identifying the right trade. The ADL system is suggesting that YM will rotate lower between now and the end of April by at least 800~1000 pts.
The next, Weekly, YM chart showing the ADL price modeling system is confirming the Daily ADL chart. Both are showing a lower price rotation over the next few weeks. Additionally, the Weekly ADL chart is showing a deep price low near May 1, 2019. This aligns perfectly with our earlier analysis that May/June would start a bigger price rotation in the US stock market, global equities markets and precious metals. More on precious metals forecast in this video clip on TradingView.com
As we continue to move closer to these important dates, we’ll keep our followers informed of our research and our proprietary trading tools, yet the real opportunity exists by knowing how to trade these moves and how to take advantage of the total scope of these market. Be prepared for a fairly large downside price swing in the YM over the next 5~7 weeks as the 24,800~25,000 attempts to set up support and a momentum base.
Please take a minute to visit www.TheTechnicalTraders.comto learn more about what we do and how we can help you stay ahead of these market moves. Visit www.TheTechnicalTraders.com/FreeResearch/ to read all of our recent research posts. We take great pride in our ability to provide our members and followers with the highest level of research, trading signals, daily video content and more. Find our why our hundreds of members continue to believe in the opportunity we provide them each and every day. Isn’t it time you invested in your future success – today?
Chris Vermeulen
https://thegoldandoilguy.com/wp-content/uploads/2019/03/funduhmental.png270326adminhttp://www.thegoldandoilguy.com/wp-content/uploads/2014/11/tgaoglogo.pngadmin2019-03-18 12:02:202019-03-18 12:02:20US Equities Price Anomaly Setup Continues To Unfold
It’s been years since the gold and silver topped out in 2011. We have been waiting for a new bottom form and a new bull market to emerge for nearly 8 years. In this article, I’m going to compare palladium, gold, platinum, and silver and show you which of these precious metals I feel is the best long-term investment and also the best trade for 2019.
The analysis presented below is based on technical analysis using previous significant highs, and Fibonacci extensions. Both of these techniques work exceptionally well for predicting price targets both to the upside and also price corrections to the downside. If you have never used Fibonacci retracement or extensions in your trading I highly recommend learning more about them. I have no doubt it will improve your market price projection targets for your investments. I have found this technique to be the number one best trading tool for projecting future price movements in all asset classes.
The charts below will show to price forecasts for each metal. The first price target is based on the previous significant high that price made between 2000 and the current timeframe. Previous significant highs are typically the first target for the price to reach and that is also our first major upside target for these metals. The second price target I use is based on Fibonacci extensions using stand out lows formed anywhere between 2002 to the current price time and projecting that forward into the future beyond the previous highs shown on the charts.
So let’s get started with the worst precious metal to invest in and work your way down to the best precious metal.
#4 PALLADIUM
Palladium, In my opinion, is the worst precious metal to own for 2019. While palladium is used in everything from dentistry to groundwater treatment, Palladium is by far the most versatile precious metal. Only a little while ago palladium was not nearly as popular as it is today due to the incredible economic growth in developing countries especially China. This multi-use metal is steadily growing its importance in the markets hence the strong performance to date.
There is no doubt that Palladium has staged a massive rally from the 2009 lows and also another mega-rally from the 2016 low. But, knowing the best performing investments eventually become the worst performing investments later, let’s take a look at the chart of Palladium and see why I feel as though Palladium is the worst investment metal for 2019.
The monthly chart of Palladium below shows the previous high in price in the year 2000. That high has been broken and now the price has gone parabolic blasting above that level to the 1550 mark. At this point, the previous high target has been breached and we no longer see that as a price target. There is zero upside potential based on the previous high.
The second price target is based off the lows in 2016 using the Fibonacci extension the pullback in 2018 followed by this recent rally. This gives us a price projection of nearly $1500 an ounce. As you can see this perfect bull flag (continuation pattern) has reached the hundred percent Fibonacci measured target of 1500. Therefore I see this upside move as being complete and it is more likely to pull back and correct in 2019 with 0% upside potential. Anything beyond this price level is a bubble which could burst at any time and carries a high level of downside risk.
#3 GOLD
Gold is the second worst investment for 2019 when it comes to precious metals in my opinion based on potential upside growth. Keep in mind I am very bullish on the price of gold looking forward but other metals definitely have a lot more profit potential than gold.
As you can see on the monthly chart of gold the previous high was about $1900 in 2011. That level is our first price target for gold upon a breakout of this multiyear basing formation it has been forming since 2013. This makes for a potential gain of 46% in price.
Now if we apply a Fibonacci extension to get our second target we take the low from 2002 to the high in 2011 and bring it back down to the low in 2015. This gives us an upside price target of $2681 an ounce. Based at the current price of gold we could see gold rally 106% over the next year or two.
#2 PLATINUM
Platinum is the second best metal for short-term and long-term gains from 2019 and beyond. Looking at the monthly chart you can see the previous high in 2008 was around $2300 based on the current price if we get a move to the previous high it provides a 176% potential gain. Also, notice how the price is testing the major support level forms in 2008 this could act as a very significant double bottom in price as well.
Using Fibonacci extensions we take 2001 low up to 2008 high and back down to the recent low in 2018 or 2009 both are the same price this projected price gives us an upside target of $2659 an ounce. Based on the current price of platinum that gives us the 221% potential gain over the next couple of years.
#1 SILVER
The number one precious metal to own in 2019 and beyond is silver. Based on the previous high in 2011 and looking at the current price of silver there is a potential upside gain of 226%. Also, notice how silver is putting in a potential double bottom from the 2015 lows it also goes all the way back on the chart to 2006 through 2010 as a key support zone. Much like platinum, silver is at support and could very easily start a new mega-rally at any time.
Using a Fibonacci extension, we can get our second target for silver based on 2002 low and 2011 high along with the 2015 bottom. This gives us a $59 price target. With the current price of silver trading at $15 an ounce, there is an upside target of 296% potential gain over the next couple of years when silver starts its next bull market. In fact, I recently purchased a couple more silver bars from SDBullion to add to my silver stacks because I like the potential.
CONCLUSION:
In short, I feel precious metals should be a part of everyone’s portfolio as a long-term hedge and investment. I see precious metals as an insurance policy in case all hell breaks loose in the financial system and we need to fall back to something with physical value for a short period of time.
With that said, I am a firm believer that you should never overload in one particular investment or asset class. But I do feel certain metals should have a heavier weighting based on their current potential. The more upside potential the more of that metal you should own shares or physical bullion of.
How should you invest and trade precious metals? There are a few ways to own metals as a trader and investor. You can own physical bullion rounds or bars and I don’t recommend coins simply because you pay a premium for a design and if metals ever do become a true currency the added value you paid for a design stamped in the metal will be tossed out the window and you lose that value as price will be based purely on weight.
A really simple way to trade and invest in metals are trading the ETFs for each bullion like Gold (GLD), Silver (SLV), Platinum (PLTM), and Palladium (PALL). Another and even more simple way is to own the GLTR fund which owns a basket of Gold, Silver, Platinum, and Pallium. Obviously owning precious metals mining stocks is another (GDX, GDXJ, JNUG, NUGT etc..)
If you want to join a group of professional traders, researchers, and friends, take a look at our trading newsletter to learn how we can help you find and execute better trades each month. We believe 2019 and 2020 will be incredible years for skilled traders and we are executing at the highest level we can to assist our members. In fact, we are about to launch our newest technology solution to better assist our members in creating future success.
Our team has 53 years of experience in researching and trading makes analyzing the complex and ever-changing financial markets a natural process. We have a simple and highly effective way to provide our customers with the most convenient, accurate, and timely market forecasts available today. Our stock and ETF trading alerts are readily available through our exclusive membership service via email and SMS text. Our newsletter, Technical Trading Mastery book, and 3 Hour Trading Video Course are designed for both traders and investors. Also, some of our strategies have been fully automated for the ultimate trading experience.
RECENT CLOSED TRADES
Chris Vermeulen
Technical Traders Ltd.
https://thegoldandoilguy.com/wp-content/uploads/2019/03/Chart3-1.png561899adminhttp://www.thegoldandoilguy.com/wp-content/uploads/2014/11/tgaoglogo.pngadmin2019-03-17 13:31:182019-03-17 13:31:18Best Precious Metals Investment and Trades for 2019
In the previous two segments of this research post PART I, PART II, we’ve hypothesized that the recent Chinese economic data and the resulting global shift to re-evaluate risk factors within China/Asia are prompting global traders/investors to seek protective alternative investment sources. Our primary concern is that a credit/debt economic contraction event may be on the cusp of unfolding over the next 12~24 months in China/Asia. It appears that all of the fundamental components are in place and, unless China is able to skillfully navigate through this credit contraction event, further economic fallout may begin to affect other global markets.
One key component of this credit crisis event is the Belt Road Initiative (BRI) and the amount of credit that has been extended to multiple foreign nations. We don’t believe China will run out money by the end of March and we don’t believe any crisis event will come out of nowhere to land in China within a week or two. Our concern is for an extended downturn to decrease economic opportunity by 5~12% each year for a period of 4~7+ years. It is this type of extended economic slowdown that can be the most costly in terms of political and economic opportunity. An extended downturn in the Chinese and Asian economies would create revenue, credit, debt, and ongoing social servicing issues.
As we explore this concept of an extended economic downturn, we need to consider the BRI projects and obligations. China has committed to invest $1 trillion into the BRI and it is estimated that the infrastructure projects throughout Asia will require $26 trillion over the next decade. Our opinion is that the total investment required to complete this transition and truly open economic opportunity within the BRI will require an expanding global economy without any fear of an economic downturn. We believe even a mild Chinese/Asian economic contraction event could dramatically alter the longer term objectives of the BRI and put many “at risk” projects in jeopardy.
The potential for an immediate downward price swing in the Chinese/Asian stock market related to these recent economic data points. The reality is that the Chinese economy is contracting much faster than nearly anyone expected. The longer the US/China trade issues continue, the more likely it is this contraction event will continue. At some point in the near future, consumers will move towards more of a protectionist stance where extended consumer spending will contract. At that point, the Chinese economy will have entered a type of “death spiral” where the race to the bottom persists.
We believe the immediate downward price move in the Chinese/Asian stock market may only last a month or so before finding some price support. Over time, the constraints of a slowing local and regional economy may prove to be much more than China is capable of handling long term. Much like the US 2008-09 credit crisis, the collapse of the credit market, when it reaches a disorderly contraction, becomes a very dangerous event. As long as this economic contraction continues in an orderly manner, we may continue to see extended price weakness. If this continues over a lengthy period, we may see price weakness throughout many other regional markets – such as India, Pakistan, Malaysia, Singapore, and others.
We believe the Asian region will experience continued weakness over the next few months as further downside rotation drives prices lower while credit, debt and trade issues are resolved. It is our opinion that China/Asia will continue to struggle to attain real economic growth over this period and that further price weakness will become evident over the Spring months. Causing investors to seek shelter elsewhere. Our cycle analysis suggest mid April or early May as dates that align with such a move. This correlates with our projections for Gold and Silver in terms of some type of market crisis driving Gold and Silver prices much higher.
At this point, skilled traders and investors should be watching for signs that some type of external event may be unfolding that we are currently unaware of. Some type of event appears to be ready to unfold that will drive equity prices lower while pushing Gold and Silver prices higher. Our belief that it could be some type of China/Asia contagion leads us to believe that a downside price rotation could be nearing for the Asian markets.
Watch how this plays out over the next 30+ days. We only have about 30~40 days before we should have more clarity about this crisis event and we should be using this time to prepare for and protect our investments. We’ll keep you informed by providing more research and updates as we see need to alert you.
If you want to join a group of professional traders, researchers, and friends, take a look at our trading newsletter to learn how we can help you find and execute better trades each month. We believe 2019 and 2020 will be incredible years for skilled traders and we are executing at the highest level we can to assist our members. In fact, we are about to launch our newest technology solution to better assist our members in creating future success.
Our team has 53 years of experience in researching and trading makes analyzing the complex and ever-changing financial markets a natural process. We have a simple and highly effective way to provide our customers with the most convenient, accurate, and timely market forecasts available today. Our stock and ETF trading alerts are readily available through our exclusive membership service via email and SMS text. Our newsletter, Technical Trading Mastery book, and 3 Hour Trading Video Course are designed for both traders and investors. Also, some of our strategies have been fully automated for the ultimate trading experience.
RECENT CLOSED TRADES
Chris Vermeulen
Technical Traders Ltd.
https://thegoldandoilguy.com/wp-content/uploads/2019/03/AsiaIndia_CustomIndex_Mar8_F.png353700adminhttp://www.thegoldandoilguy.com/wp-content/uploads/2014/11/tgaoglogo.pngadmin2019-03-16 09:41:172019-03-16 09:41:17Chinese Data Has Delayed Effect on Global Equities Markets – PART III
If you have been following our research over the past few months, you already know that we’ve called just about every major move in Gold over the past 14+ months. Recently, we called for Gold to rally to $1300 area, establish a minor peak, stall and retrace back to setup a momentum base pattern. We predicted this move to take place back in January 2019 – nearly 30+ days before it happened.
Now, we are publishing this research post to alert you that we are about 15~30 days away from the momentum base setup in Gold which will likely mirror in Silver. Thus, we have about 20+ days to look for and target entry opportunities in both Gold and Silver before this momentum bottom/base sets up.
This Monthly Gold chart, below, shows you the historic peaks that make up a current resistance level near 1370. This level is critical in understanding how the momentum base and following breakout will occur. This resistance level must be broken before the upside rally can continue above $1400, then $1500. Ultimately, the momentum base we are expecting for form before April 21 is the “last base” to setup before a much bigger upside price move takes place. In other words, pay attention over the next 30 days before this move happens.
This next Monthly Silver chart is the real gem of the precious metals world. The upside potential for Silver is actually much bigger than Gold currently. Any breakout move will likely see Silver push well above $30 per ounce and we just need to watch the $18.90 level for signs the breakout is beginning. Silver will follow a similar basing patter as Gold. We expect only about 30 days of buying opportunity left before this basing pattern is completed. Again, watch the April 21 date as the key date for the breakout move to begin.
Palladium has reached our initial Fibonacci upside price targets. We expect price to consolidated and potentially rotate near the $1500 price level. Ideally, price could fall below the $1300 price level and target the $1100 area before finding any real support. As long as industrial demand continues for Palladium, we expect to see continued upside price activity over the long run. Right now, we are expecting a price contraction as global industrial demand may falter a bit.
Please consider the research we are presenting to you today. Our predictive modeling systems have been calling the metals markets quite accurately over the past 14+ months. If our prediction of a momentum base on or near April 21 is correct, then we should begin to see an incredible upside price swing in Gold and Silver shortly after this date. You won’t want to miss this one – trust us. There will be time to catch this move when it starts – it could be an extended upside move. Pay attention and put April 21 on your calendar now.
If you like our research and our level of insight into the markets, then take a minute to visit our site to learn how we help our clients find and execute for success. We’ve been calling these market moves almost perfectly over the past 18+ months. Learn how our research team can help you stay ahead of these swings in price and find new opportunities for skilled traders. Take a minute to see how we can help you find and execute better trades by visiting www.TheTechnicalTraders.com today.
Chris Vermeulen
Technical Traders Ltd.
https://thegoldandoilguy.com/wp-content/uploads/2019/03/chart1.png387700adminhttp://www.thegoldandoilguy.com/wp-content/uploads/2014/11/tgaoglogo.pngadmin2019-03-14 15:17:072019-03-14 15:17:07Countdown to The Precious Metals Breakout Rally
Our research team has been alerting our followers to a potentially deep price retracement setting up in the NQ and other US stock market majors. Although the recent price activity has pushed to newer recent highs this week, as you will see in the chart below, our Adaptive Dynamic Learning (ADL) price modeling system is suggesting that a “price anomaly” has set up.
These types of price anomalies are indicative of when price moves in an extended way outside of or away from the ADL predicted price levels. On the chart below, of NQ (NASDAQ), you’ll see the current setup with the predicted price anomaly highlighted as a RED SQUARE. This NQ ADL price pattern consists of 13 unique previous ADL instances and suggests there is a greater than 65% likelihood the prices will fall towards the 6700 level in the NQ over the next few days.
Our ADL price modeling system also confirms this on the Weekly chart basis. With 84 unique instances of an ADL price pattern, we are expecting a 65 to 95% probability that prices will fall to below 6700 within the next 3 to 5 weeks.
Both the Daily and Weekly ADL predictive modeling systems are suggesting that the upside move is over. The price anomaly could continue for a few more days, we’ve seen it happen in the past where price continues to push away from the ADL levels – this is what makes a price anomaly so exciting. When price moves away from levels that our ADL price modeling system suggests going to happen in the future, it allows us to set up trades expecting the price to REVERT back towards the ADL levels. So in this case, we can start setting up trades near 7300 for the NQ to retrace back to near 6700 – a 600 point swing.
If you want to join a group of professional traders, researchers, and friends, take a look at our trading newsletter to learn how we can help you find and execute better trades each month. We believe 2019 and 2020 will be incredible years for skilled traders and we are executing at the highest level we can to assist our members. In fact, we are about to launch our newest technology solution to better assist our members in creating future success.
Our team has 53 years of experience in researching and trading makes analyzing the complex and ever-changing financial markets a natural process. We have a simple and highly effective way to provide our customers with the most convenient, accurate, and timely market forecasts available today. Our stock and ETF trading alerts are readily available through our exclusive membership service via email and SMS text. Our newsletter, Technical Trading Mastery book, and 3 Hour Trading Video Course are designed for both traders and investors. Also, some of our strategies have been fully automated for the ultimate trading experience.
RECENT CLOSED TRADES
Chris Vermeulen
Technical Traders Ltd.
https://thegoldandoilguy.com/wp-content/uploads/2019/03/crash2.jpg375750adminhttp://www.thegoldandoilguy.com/wp-content/uploads/2014/11/tgaoglogo.pngadmin2019-03-14 10:18:252019-03-14 10:18:25Incredible Price Anomaly Setup in the NQ
Recent news that Theresa May was unable to convince members of Parliament to even consider her current deal as well as the future political and societal consequences of any failure to move ahead with an orderly Brexit deal. The question before traders and investors is how will this reflect in the global markets and how will currencies react to this new?
The GBP (British Pound) appears to be poised to a breakdown move aligning with our Fibonacci Arc structures. These arc structures help us to understand where “inflection points” are likely in the markets and where bigger moves may initiate. The current Arc level, near current price, is indicating that any failure of an upside move will likely prompt a downside move to near 0.739 – or lower.
The overwhelming vote to deny Theresa May’s Brexit deal came down to 391 Against and 242 For the current Brexit deal. It is likely that the British Parliament will continue to break down into warring factions as a contentious future political outcome will play out. The people of Britain are still wanting to complete the Brexit while it appears Parliament has yet to come to terms with the process.
We believe this current event will be somewhat isolated to Britain and European nations, yet be believe there could be a larger contagion even if other nations attempt to push their desires to leave the EU as well. Overall, time will tell how this plays out with global investors. Our first impressions are that the global markets will move lower on this news and that currencies could find new weakness as this chaos continues.
Please take a minute to visit www.TheTechnicalTraders.com/FreeResearch/ to read all of our most recent research – including our very details 5-part global economic research post. This post is very important because it shows you predicted price levels going all the way into 2021 and highlights why this “new bull market” may just be getting started. Find out why www.TheTechnicalTraders.com is dedicated to helping you find and execute better trades and stay ahead of these market moves.
Chris Vermeulen
https://thegoldandoilguy.com/wp-content/uploads/2019/03/USDGBP_F.png409700adminhttp://www.thegoldandoilguy.com/wp-content/uploads/2014/11/tgaoglogo.pngadmin2019-03-12 21:24:042019-03-12 21:24:04Is Britain At The Edge Of A Political Cliff?
As we continue to explore the fragility and future implications of a Chinese economic contraction from PART I as well as the broad extent such a contraction may have on global markets. Our continued premise is that a renewed capital shift is taking place that focuses on US Blue Chips and Mid-Cap stocks. We believe this is currently facilitating a renewed valuation exploration process in the US and global markets and, as such, may result in expanded price exploration for many global markets.
Credit, debt and equity crisis events typically unfold in one of two forms; orderly or disorderly. Our belief that an orderly credit/debt crisis event is currently unfolding in China/Asia and Europe is based on the premise that the Chinese economic data may have been grossly inflated over the past 9+ years and that the extended credit boom in China/Asia may be similar to the 2008-09 credit crisis experienced in the USA. When a credit boom takes place, a vast majority of this new credit enters the global market as private, corporate and government debt. When a credit contraction event takes place, this credit/debt become a massive liability which can ultimately destroy future capabilities.
One aspect of the total Chinese credit/debt ratio to consider would be the GDP Deflator values. These ratios compare non-inflation adjusted GDP to inflation-adjusted GDP. As inflation increases, the difference between Nominal GDP and Real GDP are related in the GDP Deflator values. Currently, the Chinese GDP Deflator values are reporting at 656% for 2017 – which indicates the year over year inflation is running at 656% from the base year. We believe this inflation measure may actually be much higher in 2018 and would indicate that consumer inflation continues to skyrocket in China while credit/debt issues are becoming more prominent.
Consider the implications for consumers, corporations and the Chinese government if inflation continues to increase while consumers, corporations and government are becoming more and more distressed with debt issues. The most logical outcome would be a devaluing of the Chinese currency or the forgiveness of certain debt issues, yet we believe the problem is much more systemic in China/Asia. We believe the core issues China is facing is the reality of their own making. The reality that the manipulated growth and expansion they have been reporting for nearly a decade is a “paper tiger” and that true growth of income and wealth was really nonexistent. It is easy to assume you have new growth, wealth, appreciation when one is able to hide behind false numbers and appear to be in control of risks. But when risks begin to shift into disorderly unwinding, the blinders come off and real problems exist.
Now, factor into this equation the incredible risks initiated by the Belt Road Initiative (BRI).
The risks of extended debt distress to many foreign nations is complicated by the potential for an extended economic downturn in China. A negative 5~10% economic growth factor in China will create immense pressures on not only China, but most of SE Asia. In addition to this extended pricing and economic pressure, the extension of credit for infrastructure projects within the BRI are already exerting debt repayment pressures on a host of foreign nations. We recently reviewed outside research that confirms our suspicions : https://www.cgdev.org/sites/default/files/examining-debt-implications-belt-and-road-initiative-policy-perspective.pdf.
Should inflation continue to rise in China while a credit/debt contraction event unfolds, it would likely result in a Venezuela or Zimbabwe type of outcome which would be difficult to contain. It may result in an incredible humanitarian crisis event where hundreds of millions of people suddenly find themselves unable to maintain any wealth, service their debt and restore any order to their lives. An interesting article focusing on how Venezuela positioned themselves for a perfect storm of hyper-inflation can be found here : https://www.forbes.com/sites/garthfriesen/2018/08/07/the-path-to-hyperinflation-what-happened-to-venezuela/#21a29d3e15e4. The take away from this should be that protectionist mechanisms (a currency peg, import/trade controls, nationalization of industries and state subsidized commodities and industries) setup a perfect storm environment when global supply/demand factors implode.
Once we consider the Chinese Consumer Price Index as well as all of these additional factors, traders must be prepared for what may become a 24 to 72 month process of unwinding Chinese credit/debt risks within the global markets. Should CPI continue to fall, but not fall in line with a decrease in the GDP Deflator levels, then we should consider a moderate level of hyper-inflation is taking place in China. Should exports, employment and GDP begin to collapse while the Chinese government attempts to minimize these factors for the consumers/corporations, then we should consider the Chinese government is following the path of Venezuela in attempting to control risks that are disorderly.
The Chinese CPI chart, above, fails to explore the continued consumer pricing level increases that have been in place since well before 1995. Mild contractions do occur throughout this data. We would be concerned with a moderate CPI contraction that lasts longer than 24 months. In particular, we would be concerned with a dramatic shift in the economic growth capabilities of China and their consumer base as that could become a catalyst for a larger contraction event.
In the next segment of this research post, we’ll explore how all of this relates to opportunities for traders and show you what we expect to happen over the next 12~24 months.
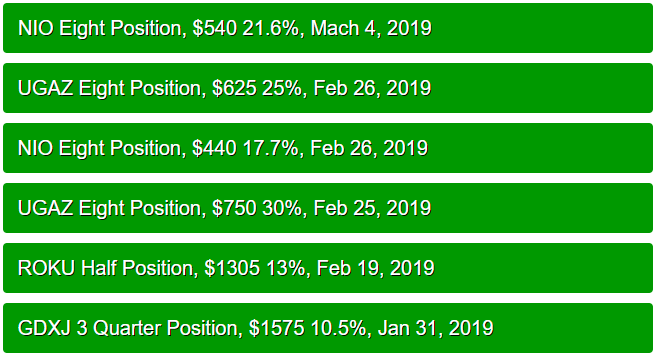
If you want to join a group of professional traders, researchers, and friends, take a look at our trading newsletter to learn how we can help you find and execute better trades each month. We believe 2019 and 2020 will be incredible years for skilled traders and we are executing at the highest level we can to assist our members. We recently close some nice positions UGAZ 30%, NIO 21.6%, ROKU 13%, GDXJ 10.5%. In fact, we are about to launch our newest technology solution to better assist our members in creating future success. In fact, we are about to launch our newest technology solution to better assist our members in creating future success.
Our team has 53 years of experience in researching and trading makes analyzing the complex and ever-changing financial markets a natural process. We have a simple and highly effective way to provide our customers with the most convenient, accurate, and timely market forecasts available today. Our stock and ETF trading alerts are readily available through our exclusive membership service via email and SMS text. Our newsletter, Technical Trading Mastery book, and 3 Hour Trading Video Course are designed for both traders and investors. Also, some of our strategies have been fully automated for the ultimate trading experience.
Chris Vermeulen
Technical Traders Ltd.
https://thegoldandoilguy.com/wp-content/uploads/2019/03/2019-03-09_ChinaCPI.png426767adminhttp://www.thegoldandoilguy.com/wp-content/uploads/2014/11/tgaoglogo.pngadmin2019-03-12 10:39:542019-03-12 10:39:54Chinese Economic Data Will Move Equities Markets – Part II
The US stock market opened today with mixed opening prices. The crash of the Ethiopian Boeing passenger jet prompted selling in the Blue Chips, particularly in Boeing (BA). As of right now, the US stock markets have recovered quite well and have pushed higher by mid-day.
We believe this upward rotation may be short-lived and want to highlight the two Engulfing Bearish candlestick patterns that have formed recently. The first, near the October 2018 highs, prompted a very deep price correction that ended on December 24, 2018. The more recent, completed just on March 8, 2019, is setting up resistance just above recent highs ($175.95) and is still a very valid sell signal for the QQQ. Unless the price is able to breach the $175.95 level over the next few weeks, this Engulfing Bearish candlestick pattern is technically the key pattern driving future expectations for the price.
Our February 17th research, “Get Ready For A Breakout Pattern Setup”: https://www.thetechnicaltraders.com/get-ready-for-the-breakout-pattern-setup-part-ii/, highlighted our expectations that the US Stock market would set up a larger Pennant formation with downward rotation near current levels. This setup has, historically, been prominent in the markets and has setup larger upside breakout moves in the past. We still believe this pattern is setting up and that downside price MUST take place before any new upside momentum breakout can begin to unfold.
Our belief is that today’s upside price move will falter throughout this week and prices will continue to decrease as the price trend continues. The two Engulfing Bearish patterns are very strong indicators of potential downside price trends forming. Again, unless the $175.95 level is breached, we strongly believe the downside price trend will continue. Plan and prepare for a deeper price rotation before any upside momentum breakout pattern unfolds.
If you like our research and our level of insight into the markets, then take a minute to visit www.TheTechnicalTraders.com to learn how we help our clients find and execute for success. We’ve been calling these market moves almost perfectly over the past 18+ months. Learn how our research team can help you stay ahead of these swings in price and find new opportunities for skilled traders. Take a minute to see how we can help you find and execute better trades by visiting www.TheTechnicalTraders.com today.
RECENT CLOSED TRADES
Chris Vermeulen
Technical Traders Ltd.
https://thegoldandoilguy.com/wp-content/uploads/2019/03/Chart_19-03-11_EngulfingBearishQQQ.png387700adminhttp://www.thegoldandoilguy.com/wp-content/uploads/2014/11/tgaoglogo.pngadmin2019-03-11 14:51:582019-03-11 14:51:58This Stock Market Pop Could Fizzle Fast


 (Source :
  (Source :