These weeks State Of The Union (SOTU) address presented by President Trump is likely to roil the markets a bit – resulting in some increased market turmoil and rotation over the next 5+ days.  Additionally, we believe the tone of this message, as well as the Democratic response to the US President’s SOTU comments, will create a bit of an uneasy forward process for global investors.

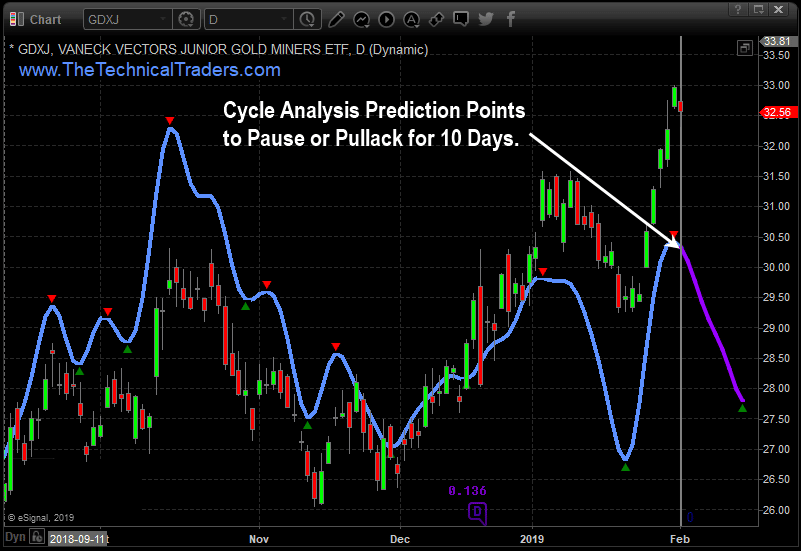
Our Adaptive Price Cycle modeling system is suggesting that we would enter a phase of sideways basing over the next 5~10+ days and we believe this analysis is suggesting that uneasy global investors may view the SOTU address and any resulting conflicts as a sign that the US may not have a clear pathway forward.  Washington DC acts as a leadership think-tank for the global markets.  Whenever there is open conflict, a government shutdown or some increased level of uncertainty, the US stock markets typically become a bit more volatile and choppy while investors settle into forward guidance.


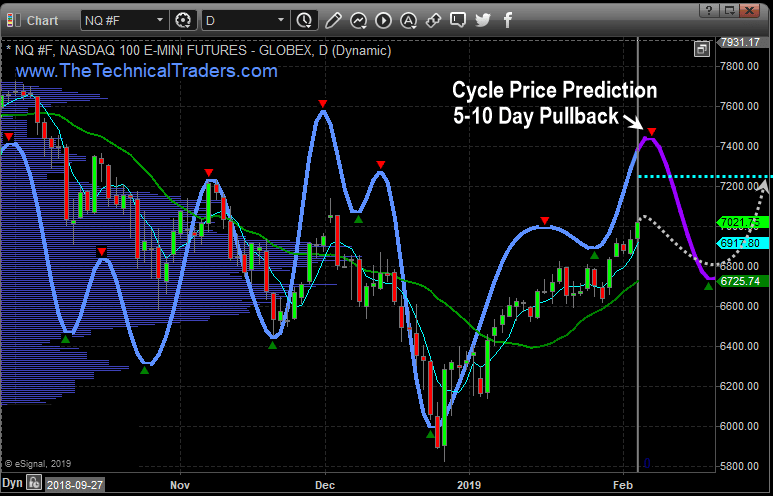
To highlight our thinking/research, we’ll start with this Weekly NQ chart.  The current price level is about $7021 below the CYAN Fibonacci projected target level.  We believe the technology-heavy NASDAQ will continue to move moderately higher over the next 30+ days – yet we feel the overall markets may rotate a bit lower to form a new momentum base after the SOTU address this week.  This means we would be looking for this new momentum base to setup and for new trading triggers to be generated as a momentum breakout happens.

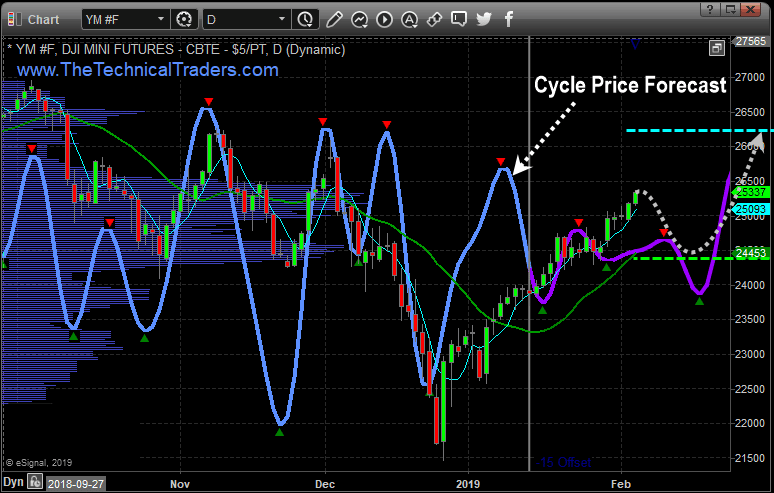
This next chart is the Weekly YM chart and it clearly shows that the current price is already above the CYAN Fibonacci projected target level.  This is important because it highlights the fact that the NASDAQ has been under some pricing pressure as the FANG stocks have yet to fully recover from the December 2018 lows.  It also shows that the Blue Chips and Mid-Caps have already recovered quite substantially over the past 6~7 weeks.

We would not be surprised to see the YM rotate after the SOTU address this week to levels near the CYAN Fibonacci target/support level (24,435) while setting up a new momentum base – similar to what we expect to happen in the NQ.  It makes sense that this support level (24,435) would be a substantial basing level for a new momentum breakout trade to continue higher.


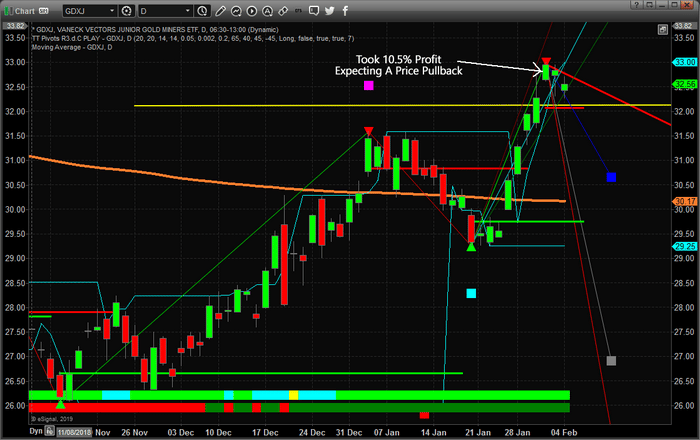
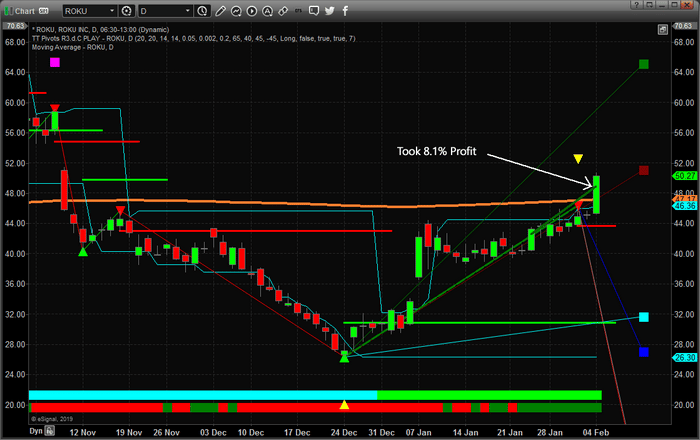
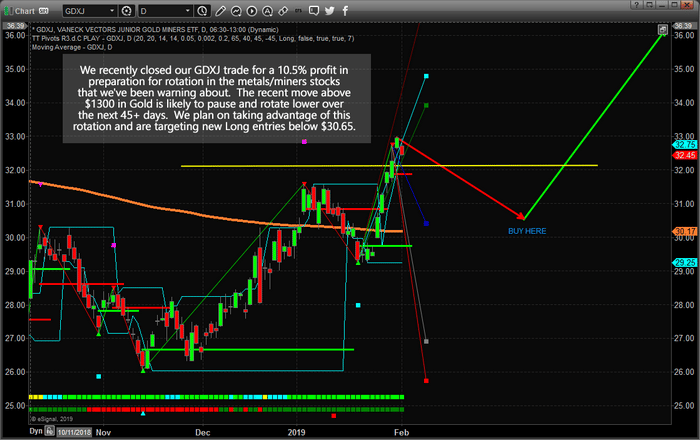
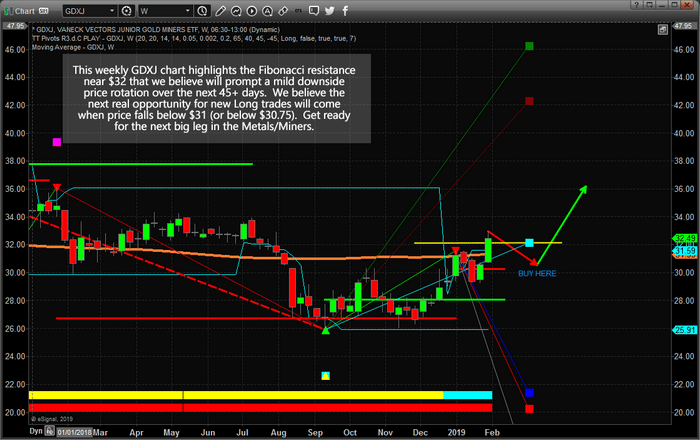
Our overall longer-term analysis of the US markets is that we continue to believe the upside price bias will continue and that a moderate upside “melt-up” as a renewed capital-shift continues to drive investment into the US stock market.  Right now, though, we are warning that the US stock markets could be setting up for a period of 5~10+ days of rotation and volatility, after the SOTU address, that may frighten many traders. Because of this, we had our subscribers close out our GDXJ position for a 10.5% gain right at the recent high, and also took partial profits on our ROKU stock pick for a quick 8% gain. So be prepared for some sideways trading and increased volatility for the next week or two.

Visit www.TheTechnicalTraders.com/FreeResearch/ to read all of our most recent research posts.  We are confident that you will find our Daily Video, Detailed Market Research, Proprietary Research Tools and Detailed Trading Signals will help you make 2019 an incredibly successful year.

Chris Vermeulen
www.TheTechnicalTraders.com

We are not always correct in our calls about the market.  Professional researchers and analysts must understand that attempting to accurately predict the future outcome of any commodity, stock, index or ETF is impossible to be 100% accurate.  Yet, we are pleased that our proprietary price modeling and analysis tools continue to provide us with very clear triggers and alert us to price moves before they happen.

Today, we are sharing two recent trades we executed with our members that resulted in some decent profits.  The first example is our GDXJ trade.  We had been in a Long position since before the beginning of 2019 expecting Gold and Miners to rally.  Our price modeling systems suggested that after price reached $1300, we may experience a brief price pause over the next 45 days or so.  Thus, we pulled the profits in this trade recently to lock in 10.5% profit and to allow us to re-enter when our modeling systems suggest the price pullback has ended.


The second example is our ROKU trade.  We recently pulled 8.1% profit on a partial profit target execution for our members after a nice upside momentum move.  This type of trade falls into our MRM (Momentum Reversal Method) trade trigger category and is supported by a momentum resurgence price move that can typically prompt prices to move +8~30% over fairly quick periods of time (under 20 days).


For almost all traders, we’ve found that understanding general market conditions, finding suitable trading triggers/setups and staying aware of the market dynamics at play in the global markets is very hard to accomplish.  This is why we offer our members a very quick and easy way for them to accomplish all of these essential components for success with their membership to Technical Traders Ltd. Wealth Trading Newsletter.

– Our Daily Market Video, which is typically under 10 minutes in length, covers all of the major markets, most commodities, the US Dollar, Bitcoin and many other elements of the markets.

– Combine this video content with our detailed market research posts, which you can read by visiting www.TheTechnicalTraders.com/FreeResearch/, allows our members to not only learn from our video content but also to begin to understand and formulate their own conclusions based on our content.

– Lastly, we add our trading trigger/alerts feature to alert our members to superior trading setups that we find while running our proprietary trading models.  We don’t post 40 trades a day hoping our members will find one or two they can make profits from.  We are highly selective in our posts and attempt to only post the best opportunities for success.

Over the past couple of months, we have been developing a new members area application. It will allow you to have live access to our morning spike and gap trades and traders chatroom, our Sp500 index momentum, and swing trades, plus our special MRM (Momentum Reversal Method) stock picks on small/mid-cap stocks which also all trade options so if you want to you can trade options on your own around our stock trades.

Last week we made huge progress and this week’s goals are to implement the instant and automated SMS and email alerts sent to you every time there is a new trade, stop, target hit, or we close a position. This will give you more time to see and execute the trades as needed. Keep in mind most swing trades can be entered 1-3 days after the trade alert at the same price or better price simply because we are not that perfect at timing the markets every move.

If you take a minute to review these example REAL TRADES (above) and review the information at www.TheTechnicalTraders.com, we believe you will understand the value and resources we offer our members.  Isn’t it time you found the right team of professionals to help you make 2019 an incredibly successful year?

Chris Vermeulen

We recently closed our GDXJ trade for a 10.5% total profit with our members.  We are preparing for a lower price rotation over the next 45+ days that will allow us to plan for new long.  Our research indicates the metals/miners should enter a downside price rotation over the next 45+ days as the US stock markets continue to rally.  Give this expectation, it is important to understand how we are timing this move for our members and attempting to take advantage of strategic trade deployment.

With Gold recently breaking above $1300, many analysts have been calling for a continued breakout move to the upside as well as a massive market correction in the US stock market.  We’ve been calling for just the opposite to happen – a pause in the metals/miners near this $1300~1320 level.

If our analysis is correct, a renewed capital shift will continue to unfold over the next 30~45 days where foreign capital will move into the US stock market (including technology, financial, medical/biotech, blue chips, mid-caps, and others) as global investors chase the safety and returns of the US Dollar and the US stock market.  This process of deploying capital into the US stock market will relieve upside pressure in the metals/miners for a brief period of time – resulting in a price pullback.  Our expectations are that the GDXJ price will rotate back below $31 and likely target a support level near $30.50~30.65.  This is near where we intend to look for new Long entry trades.


ADLC – Advanced Dynamic Price Cycle Projection


ADLC – Advanced Dynamic Learning Prediction Projection


Weekly Longer Term View of Projection


The opportunity of the next leg higher in the metals/miners is exciting.  Take a look at this Weekly GDXJ chart showing the upside price targets near $42 and $45.  These represent a 37% to 47% upside price objective once this rotation completes as we expect.

In short, if you want to gain access to our proprietary price modeling systems, a dedicated research team, daily video analysis, and help you find and execute better trades, then please visit www.TheTechnicalTraders.com.  If you want to know how and when we are trading these markets to help our members, then consider becoming a member and enjoying all the benefits we offer our subscribers.  This is going to be an incredible year for skilled traders who can move around and trade the hot pockets of stocks and commodities.

Chris Vermeulen
www.TheTechnicalTraders.com