The US Dollar is poised to rally back to near $97.50 as this recent downside price swing ends. We believe the US/China trade talks and North Korea deal with result in a strong upside potential for the US Dollar and the US stock market as time progresses.
A certain number of industry analysts are starting to announce the recent December 24th lows and subsequent rally as a “new bull market”. We have been suggesting to our followers that this market has lots of room to run as a continued global capital shift takes place. We do expect some price rotation over the next 3~5+ weeks in certain sectors – including the US stock market and Gold. We believe the US Dollar strength will continue to push higher, above $97, with the potential to reach near $99 before the end of this year.
Just take a look at the weekly gold chart price range and support zone. As we know, in most cases when the dollar rallies gold falls.
Please take a minute to visit www.TheTechnicalTraders.com/FreeResearch/ to read all of the most recent research – including our very detailed 5-part global economic research series. This post is very important because it shows predicted price levels going all the way into 2021 and highlights why this “new bull market” may just be getting started.
https://thegoldandoilguy.com/wp-content/uploads/2019/02/gold2.png583876adminhttp://www.thegoldandoilguy.com/wp-content/uploads/2014/11/tgaoglogo.pngadmin2019-02-27 22:56:322019-02-27 22:56:32US Dollar Set to Rally and Gold Collapse?
Today we warn of a potential downside price rotation in precious metals that may last 3~5+ weeks as metals set up for a massive breakout rally which we believe will start in late April or early May. Our custom indicators are suggesting that precious metals, and the general US stock markets, may be setting up for a bit of a reprieve rotation after a very impressive recovery. Be patient as we believe this pullback in prices will provide an excellent buying opportunity for the eventual momentum rally setting up in about 30+ days.
Let’s start by looking at our Custom Market Volatility indicators. The Weekly chart below highlights the recent recovery in the US stock market since the December 24th, 2018 lows and also shows that the current recovery level is sitting right at a 61.8% Fibonacci level. It is our belief that a period of general price weakness will begin to unfold over the next 10~15+ days in the US stock market. This rotation is very healthy for the next leg higher – the momentum rally we have been suggesting will take place in the near future.
We believe the downside rotation in the US stock market will be the result of renewed calm from expectations that the global economy may begin a recovery process as the US/China trade issues and other geopolitical issues seem to become more resolved. We believe the recent upside move in the US stock markets were a flight to safety for many foreign investors fearing that US/China trade issues would result in very harsh outcomes near March 1. If the trade issues appear to be close to a resolution, this flight to safety trade may wane a bit over the next 10~20+ days as emerging markets may see a dramatic upside bounce in valuations.
How does this relate to Gold and Silver? It is very likely that the upside pricing pressure in precious metals will stall a bit as the global equities markets take center stage. If our analysis is correct, the developed markets will contract while the emerging markets take focus. This falls right into line with our analysis that the US stock markets will pause/rotate over the next 10~20+ days in preparation for a larger upside price swing.
Our custom Gold/Silver Index is showing that precious metals are trading in a sideways Pennant/Flag formation near levels that have historically been resistance. We still believe the upside in the precious metals market over the long term is substantial, yet we believe the news of a US/China trade resolution and the resulting rally in the emerging markets will remove much of the upside pricing pressure in the precious metals markets for about 15+ days before momentum support is found.
Our researchers believe the timing of this move is right for a short term swing trade. Be prepared for rotation in nearly all the global markets and be prepared for emerging markets to see an upside price rally as a result of positive news from the US and China over the next 2+ weeks.
Are you ready for these moves? Do you value the research we share with you and the insight we provide? Please take a minute to visit www.TheTechnicalTraders.com to learn how we can help you find and execute better trades. Support our work – become a member. We dedicate our efforts to providing you with more detailed and intuitive market research available anywhere else. Isn’t it time you invested in a team that can really help you make 2019 a great success?
https://thegoldandoilguy.com/wp-content/uploads/2016/08/goldimage.jpg500900adminhttp://www.thegoldandoilguy.com/wp-content/uploads/2014/11/tgaoglogo.pngadmin2019-02-26 13:33:462019-02-26 13:45:21Gold and Silver Prepare For A Momentum Rally
This, the final segment of our multi-part research post regarding the potential future market direction as well as to identify if there is any real concern for traders regarding a “total market collapse” as some Doomsayers are predicting should help you understand what our researchers believe is the most likely outcome. In the previous segments of this research post, we’ve covered everything from the globalization of markets and economies to key elements of core pricing levels and valuation levels of economies, equities markets and more. The data is out there if you know where to find it and how to read it. All one has to do is step back from the shorter term charts and see the bigger picture for a bit.
As promised, we’re going highlight some very informative future market predictions using our proprietary Adaptive Dynamic Learning (ADL) predictive price modeling tool. This modeling tool has been able to call the past 20+ months of market activity very accurately and help to guide us in understanding what is really taking place in the US stock market – read more about it here.
The one key element of the ADL predictive modeling system is that it accomplishes two key components. First, it can provide a very clear “high probability” outcome for nearly any market in any time-frame. Second, it can also provide us with a very clear “point of failure” with regards to the predictive modeling results. We’re certain you understand the value of the first component, but do you understand the value of “knowing when you’re wrong”?
The concept of “failure to fail” or “failure to succeed” continues to baffle many traders, investors, and researchers. If you break it down into the simplest terms, it means “you are absolutely correct” or “you are dead wrong”. The question then becomes, “do you have a plan of action for both of these potential outcomes?”. Keep this in mind as we continue reviewing charts.
This first QUARTERLY SPY chart highlights our ADL predictive modeling system results originating from October 2016. The ADL predictive modeling system plots the highest probability outcome for price based on a very unique “price pattern and technical indicator DNA marker/lookup” algorithm. What makes it so unique is that it is able to learn from any price data and apply that data/outcome to any newer price par that appears on the chart. Thus, we can ask the ADL to show us what is likely to happen well into the future with a relatively high degree of accuracy.
In this case, if you follow the YELLOW, WHITE and CYAN dash levels on this chart, you’ll see the predicted outcome from the ADL price modeling system matched real price levels quite accurately and actually predicted the Q4 2018 market collapse very accurately. You can read about how we called this market move here.
Currently, the ADL predictive price modeling system is suggesting the current price of the SPY is well above projected ADL price levels. Thus, we would be expecting the price to rotate lower over the next few weeks/months to settle near the 250~270 level. You should be
able to clearly see the YELLOW dash levels to the right of the current price – these are the ADL predictive price levels going forward. Our research team believes the US and global markets will enter a Pennant/Flag formation over the next few months before setting up for another massive upside breakout. More detail about this setup can be read here.
This QUARTERLY TRAN chart shows a similar setup, yet there is one key difference between these two charts. This TRAN chart shows that price is currently below the predicted ADL price levels and we can see the ADL predicted price levels trade near 10,750 to 11,200 levels over the next 4 to 5 quarters. This would likely result in an upward price bias, from these current levels, with a very strong possibility of a sideways, volatile Pennant/Flag formation setting up over the next 6~10+ months. Somewhere near Q1 or Q2 of 2020, the ADL predictive modeling system is suggesting that TRAN prices will begin a new upside price rally that may result in a +20% to +30% upside target.
By showing you these two predictive modeling charts and the results of our advanced, proprietary ADL predictive modeling system, we hope we have been able to help to settle your nerves going forward and to help to prove to you that 2019 and 2020 will be incredible years for skilled traders. All we have to do is understand what price and other technical data are showing us and then sit back and wait for the shorter term price triggers to generate strategic entry triggers.
In order to properly answer our initial question that set us off on this quest: “Are the Doomsayers correct in their predictions or are our predictive analysis models correct in their predictions?” – the true answer is that the future will prove one of us right and one of us wrong. We believe in our predictive modeling system because it has been able to call the past 20+ months of trading accurately and we’ve seen the power of this tool first hand – many of you have as well.
Overall, yes there are risks still within the global markets and they are still in the midst of a very fragile “revaluation phase” that could include unknown risks for all traders. Additionally, the ADL predictive modeling system does not take into account geopolitical events (war, regional power struggles, famine or “acts of God”). It just shows us what it believes is the highest probability outcome in the future. Therefore, we suggest all traders/investors continue to stay “cautiously optimistic” going forward and learn to exercise proper risk controls.
The global market data that we’ve presented within this multi-part article should help to paint a very clear picture of what is really happening throughout the planet at the moment – at least we hope it does. We want all of our followers and friends to understand the risks and opportunities that are currently ahead of us and we want to make sure you understand just how important good skilled research is to make informed decisions.
If you like this type of research and how we present these details, then please take a minute to visit www.TheTechnicalTraders.com to learn how you can benefit from the hard work our research team puts forth to provide our members with clear opportunities for success. Take a look at some of our recent winners to see how we help people, just like you, create success. We believe 2019 and 2020 will be incredible years for skilled traders and we are executing at the highest level we can to assist our members. In fact, we are about to launch our newest technology solution to better assist our members in creating future success. Isn’t it time you invested in your future success by joining a team of professionals dedicated to giving you an advantage in the markets every day?
We still take trades just like the rest of the planet’s traders – we measure risk and opportunity and make decisions to “take the trade” or not. The only difference is that we have some very cool, proprietary modeling systems that help us find and execute these trading decisions. Visit www.TheTechnicalTraders.com to learn how you can become a member today.
https://thegoldandoilguy.com/wp-content/uploads/2019/02/Chart1-1.png604999adminhttp://www.thegoldandoilguy.com/wp-content/uploads/2014/11/tgaoglogo.pngadmin2019-02-25 19:18:082019-02-25 19:18:08Traders Must Stay Optimistic Part 5 – The End
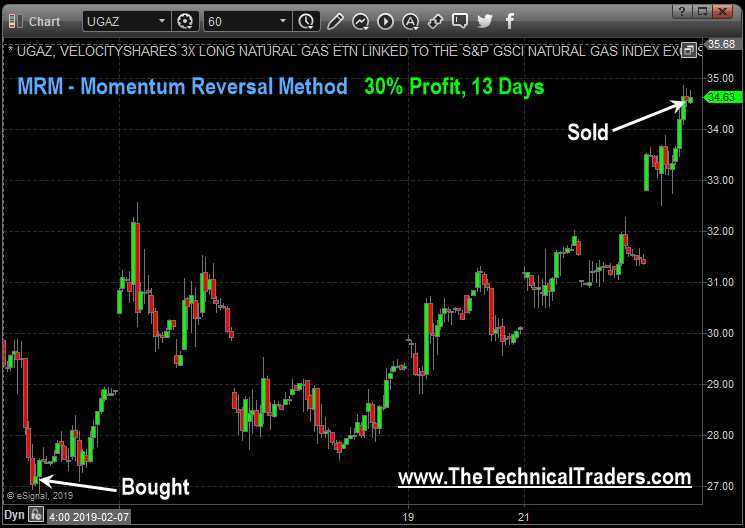
It been a great couple weeks for members of our newsletter as we start to provide more of our
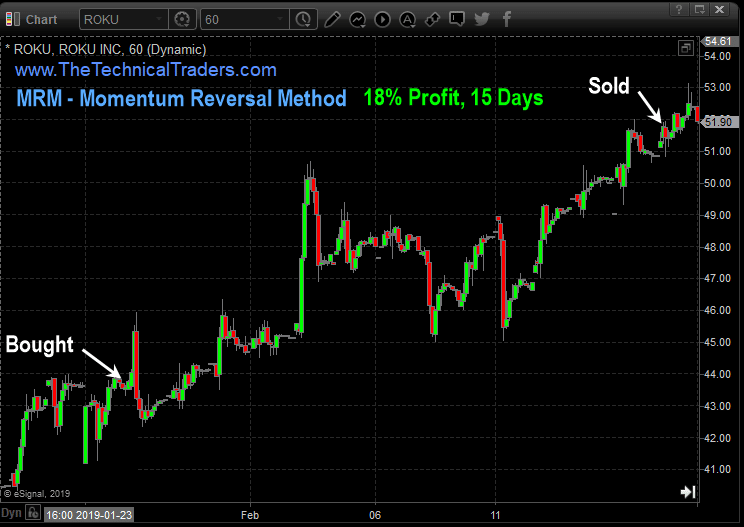
MRM – Momentum Reversal Method Stock Picks.
As technical traders, we specialize in trading price action and momentum.
We don’t follow the news or media because it has zero predictiveness in price action.
Take a look at our most recent closed trades.
CUT YOUR RESEARCH BY 97%
No matter what type of analysis you are looking for our services provides you with virtually everything you need
to protect your investments and profit from the next rally or selloff in the market.
EXPLOSIVE STOCK PICKING STRATEGY
Get our ADL and MRM strategy for identifying explosive Stock and ETF patterns.
Now you can get into plays before they move and become publicly known!
In fact, the most recent trade members got into was just introduced to the masses with
two exclusive TV shows on them and the stock rallied 23.7% in the last three days alone!
Welcome to Part IV of our multi-part research post delving into the global markets, global opportunities and the current “revaluation” even that is taking place. We started this quest from a simple question, “are the Doomsayers correct in their analysis that the US and global markets would collapse in a spectacular form in the near future?”. We wanted to dig into this in more detail to prove they were right or to prove our analysis was correct and the markets are simply “re-balancing” in the process of developing greater opportunity.
So far, we’ve covered topics related to globalization, central banks, global GDP and capital asset deployment forms. We’ve highlighted how the transition from regional economies into global inter-connected economies is now nearly complete and we’ve highlighted how we believe a collapse event could only take place if the largest global economies were to experience some type of massive crisis event. Unless these types of massive crisis events unfold, the most likely outcome is what we have been proposing all along – a re-balancing/revaluation event cycle that is preparing current market valuations for a momentum breakout rally in the future.
Let’s continue our research.
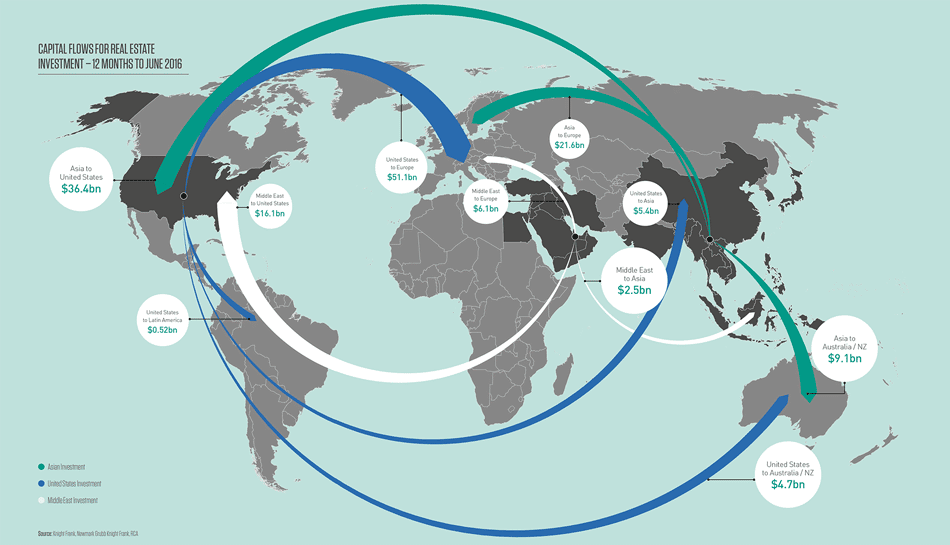
The chart, below, highlights just how critical global capital flow is in today’s world. Imagine, back in the 1950s and 1960s – the process of money flowing around the planet in an instant for investment purposes and global central bankers being able to capitalize on various global economies was very difficult to achieve. Now, with the speed of fiber-optics, these transactions can be completed in seconds and traders/investors can move capital across the planet multiple times throughout a single 24-hour span of time.
In our opinion, the reason the September 11, 2001 market crisis and the 2009~2014 market crisis events were so catastrophic and REAL was because they targeted the US economy (the biggest economy on the planet and the leader of growth throughout the planet) as well as the extended credit, debt and derivatives markets that were formed as the total globalization process expanded. When this “froth” began to implode, the underlying value of the assets supporting this “frothy fringe investment” imploded at dramatic rates.
The current issues that should concern investors are China and Europe. We believe a re-balancing of capital and expectations are currently taking place within these regions that could result in a “de-frothing” process in the near future. We would like it to be orderly and structured, but we don’t always get what we want – right? This process of revaluing the future expectations and opportunities within these global markets could create some issues for fringe elements as well (Russia, SE Asia, South America and Africa). Remember, many of these nations are operating on a “capital high” right now after seeing many decades of “easy money” and extreme growth. This is the reason for being cautiously optimistic. We have not completely transitioned into the “total global growth mode” yet.
The one thing that we believe is taking place at the moment is the positioning of capital in preparation for the final revaluation event. Capital is currently shifting towards safer and more secure global markets in preparation for this last revaluation event cycle. Our interpretation of this event is that a shakeup of banking/finance institutions as well as larger scale infrastructure projects (Belt Road) and economic coalitions (EU) will result in a more solid and rooted opportunity to build upon success for our future.
A “de-frothing” economic event will likely continue throughout the next 2~5+ years where localized markets will attempt to eliminate the “at risk” top and bottom end players. Think of this as a process of re-establishing core values and core opportunities. In an ecosystem, living organisms operate in two separate modes: survival and expansion. When the environment is hostile and difficult, the organism falls into “survival mode”. This is where froth and at-risk elements are terminated because the important aspect for the organism is “to survive the environment”. If the environment improves and becomes more “friendly and supportive”, then the organism will transition into “expansion mode” where it will try to grow, expand and “flower”. This is where the organism becomes very healthy and is able to begin taking on new risk/froth elements.
Currently, we believe the global economy is nearing the end of the de-frothing/revaluation phase and will begin to establish new growth footing over the next 2~5+ years. Our hypothesis is that the 2009~2014 Global Credit Market crisis started a massive global de-frothing process that is currently working through the global markets. Intentional or unintentional, we don’t know. But we do understand that the process of “survival or expansion” is key to the long term economic events that continue to work through the global markets. Let’s look over some charts.
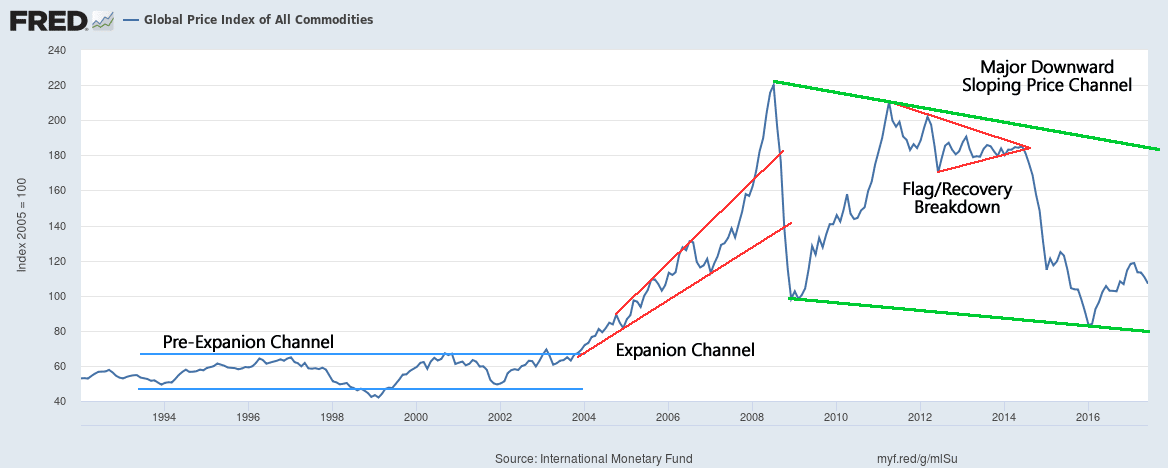
One element typically happens near the early/middle stage of economic expansion is a Commodities price increase. Looking at the larger picture of the global price of all commodities, we can see that an expansion channel existed between 2004 and the peak near 2008 and, since then, global commodities have been within a Major Downward sloping price channel. It is our opinion that global commodities will stay near the lower range of this price channel as the revaluation/re-balancing phase continues. Eventually, global commodities will likely attempt to setup a Flag/Pennant formation before attempting a true price advance after the froth/risk has been sufficiently eliminated from the global markets.
Additionally, this chart showing total international debt securities of all countries clearly shows WHEN the global markets entered the revaluation/re-balancing phase. It all started with the 2009~2014 global credit market crisis – not with the September 11, 2001, terrorist attacks. This information supports the process that the global economy was much healthier in 2001 as a result of the expanded opportunities supported by the new Internet/technology boom. The crisis event in 2001 was dangerous as it could have resulted in a global economic contraction, yet it appears the expansion in commodities prices and the continuous expansion of debt was unabated.
The 2009~2014 global credit crisis event was a completely different story for the markets. This event consisted of a core element implosion that touched nearly every corner of the planet and started a “de-risking” event that is still taking place. True economic expansion will not begin until this event is completed. The process of revaluing the markets is currently taking place and a true “capital shift” is still underway where capital is being deployed in the safest and most secure markets on the planet in order to secure proper ROI as well as seeking “speculative ROI” from undervalued international markets.
We continue to expect debt consolidation to continue throughout most of the established world. The single purpose of this Revaluation event is to find and secure proper valuation levels for the entire global market before true expansion can begin. We’ve already experienced a massive revaluation process across most of the planet and the only thing left to complete are the proper valuation levels of the most frothy and unhinged global markets on the planet.
This process may not be pretty at times, but it certainly will provide skilled traders and investors with incredible opportunities for profits. You won’t want to miss these moves over the next 3~5+ years.
Don’t miss Part V of this incredible research post as we’ll show you exactly what to expect over the next 24~30+ months in the US markets and who you why skilled and professional research, like this, is key to understanding where opportunity really exists in these markets.
If you want to learn how our proprietary price modeling systems, a dedicated research team, daily videos, and more resources will help you find and execute better trades, then please visit www.TheTechnicalTraders.com to learn how we can assist you. If you want to know how and when we are trading these markets to help our members, then consider becoming a member and enjoying all the benefits we offer our subscribers. This is going to be an incredible year for skilled traders. Isn’t it time you invested in something that can really help you develop greater success?
https://thegoldandoilguy.com/wp-content/uploads/2019/02/Chart2.png4701168adminhttp://www.thegoldandoilguy.com/wp-content/uploads/2014/11/tgaoglogo.pngadmin2019-02-24 21:15:372019-02-24 21:15:37Traders Must Stay Optimistically Cautious – Part 4
Welcome back, If you’ve missed any part of this multi-part research post, please visit www.TheTechnicalTraders.com/FreeResearch/ to review and read our previous posts. This, Part III, of our multi-part research post where we are attempting to rationalize the continued bearish analysis of some other analysts as well as review some key data that may support our interpretation that the global markets are transitioning through a “revaluation phase” right now – headed for a breakout rally eventually will continue with more detailed information. Our premise is that global investors and traders should stay cautiously optimistic at the moment and prepare for some volatility as this “revaluation phase” continues to play out. Our overall analysis suggests that the US Federal Reserve and global central banks have “primes the cylinders” of the global economic engine sufficiently and that a spark is all that is needed to see massive new valuation and GDP increases within the next 10~20+ years.
Within the previous sections of this article, we’ve discussed how Globalization has expanded and normalized the global economic activities over the past 50+ years. We’ve also discussed how this process of globalization has created a series of crisis events as localized central banks are now dealing with total globalization and the new risks that are associated with this transition. Our position is that the economies of the planet are now more interconnected than ever before and, thus, the concept of a massive collapse event is less likely than ever before. The only way a massive collapse event could take place, in our opinion, would be a global war between super-economies or a total collapse of multiple super-economies because of some catalyst event. Otherwise, we believe the proper thinking is that of a “revaluation phase” not a “collapse event”.
Let’s dig further into the data and continue our research.
In the past, we’ve suggested that capital operates like a living organism, always in search of the healthiest environment to reside within and always attempting to identify and mitigate risk factors where they reside. In other words, global capital is always seeking out the best, safest and most secure (immune from risk) returns possible at all times. The recent globalization process creates a unique environment where capital can “transition” from one global market to another in an instant. Risks can be identified and mitigated within minutes, hours or days now where, in the past, these risks could have been catastrophic in nature.
Within this new “instant” environment for capital and global markets, new risks persist. Because huge amounts of capital can now move freely across global platforms and economies, volatility is likely to continue at 2x to 5x historical norms. This also means that catastrophic regional economic events will likely result in more severe price rotation and speculation. The end result is that capital is now flowing across the planet more efficiently than ever before and this creates a whole new playing field for investors and traders.
Consider the Global Gross Capital Flows below and pay very close attention to the change in how capital moved and was deployed prior to 2008 and on/after 2008. If you read this chart as our research team sees it, we have entered a period (from 2000 onward) where massive amounts of capital have been dumped into the global markets. Much of this capital has been deployed into infrastructure and supporting global banking and credit markets over the past 18+ years. Yet a very large portion of this capital has yet to become fully activated in the global markets and this can clearly be seen by the reduced GDP output on this graph. 2015 Global GDP levels have dramatically changed and are very near pre-2001 levels in scale.
As readers of this article, the point we are trying to make is that “the guns are primed, loaded, aimed and ready for BUSINESS”. The collapse of global GDP, which is clearly evident in the past few graphs we’ve presented, began to become clearly evident in 2014~2015. An interesting facet of this contraction was that China instituted new Capital Outflow laws to attempt to prevent investment capital from rushing out of local Chinese markets at this same time. The purpose of this was a protectionary move by China attempting to support their local credit markets and internal banking markets. Unlike other global markets, China could not risk having large amounts of capital rush overseas (depleting repayment capabilities and local coffers) while continuing to build and pump up their credit/lending markets. They had not considered the risks that Chinese investors/Entrepreneurs would take large components of their new wealth and aggressively move it outside the Chinese market. Shortly after that, came the 2016 US presidential elections – which always present some level of rotation/contraction within the markets.
As we move forward with this data and the key question we posed at the very beginning; are the Doomsayers right? Do you believe the markets will collapse in the immediate future or do you believe the global markets are poised and primed for another massive price advance because of the massive influx of capital that has recently been dumped into the markets?
Let’s try to answer some of these questions by presenting clear data in regard to how the global markets have changed over the past 90+ years. The GDP data below shows how different nations have rallied GDP output over the past 90+ years and how the dynamics of the global markets are taking root. Remember the data we’ve presented earlier when you review these GDP graphs, below. Remember that from 1970 till now, the US Federal Reserve and global central banks have poured over $40 Trillion US Dollars into the global markets and this capital is working through the banking system and economies in an attempt to solidify growth/return opportunities.
If we were to total the GDP of the Top 5 economies on the planet for each of these graphs, the numbers would like something like this :
__ 1930: $2.87 Trillion Annually
__ 1980: $14.16 Trillion Annually
__ 2010: $43.84 Trillion Annually
__ 2015: $53.82 Trillion Annually
As we’ve seen from the previous data, the creation of capital by the central banks take a bit of time to settle into the global economies to begin producing real GDP advancements. Additionally, we believe the 2009~2014 global credit market crisis was one of the biggest crisis events to “re-sync” the global markets in decades. This event was similar to the 1929 US stock market crash in combination with the wars of the 1930s and early 1940s rolled all into one. The primary difference between now and then is the fact that global economies are now very inter-connected and what took many decades in the past now takes only a few short years to recover.
What should we expect in the future and why are we cautiously optimistic about the next 2~5+ years, keep reading our next segment to find out. We’ve covered almost all of the key data points that highlight what has transitioned in the past 40~50+ years. Next, we’ll highlight why we are very optimistic that 2019 and 2020 will be incredible years for skilled traders and investors and we’ll show you what to expect from the US markets going all the way into 2021.
Isn’t it time you considered joining a group of professional traders, researchers, and friends to help you find and execute greater success in the future? Then visit www.TheTechnicalTraders.com to learn how we can help you find and execute better trades. Take a look at some of our recent winners to see how we help people, just like you, create success. We believe 2019 and 2020 will be incredible years for skilled traders and we are executing at the highest level we can to assist our members. In fact, we are about to launch our newest technology solution to better assist our members in creating future success. Isn’t it time you invested in your future success by joining a team of professionals dedicated to giving you an advantage in the markets every day?
https://thegoldandoilguy.com/wp-content/uploads/2019/02/chart2.png652801adminhttp://www.thegoldandoilguy.com/wp-content/uploads/2014/11/tgaoglogo.pngadmin2019-02-21 23:00:372019-02-21 23:00:37Traders Must Be Cautious Part III
This Part II of our research post regarding the future potential of any very deep market correction and/or a potential new-age market rally based on our presumption that the global market dynamics have changed dramatically over the past 20+ years. Are the market gurus correct in thinking the next big move will be to the downside? Or are they missing key aspects of the global market dynamics that point to a massive upside rally that is setting up for the future. Today, we continue to explore some of the key elements that we believe present a total scope of the potential for the global markets.
In Part I of this article, we highlighted how globalization changed the planet and increased inter-dependence across the globe for economies and governments. The point we wanted to make from the first segment was to highlight the fact that the current world economies are vastly different than the global economy prior to 1980 or 1970. Over the past 20+ years, the world’s economies have become more and more connected and interdependent on one another. Additionally, global investors and financial institutions have become heavily interconnected and reliant on the global market economies of the world. The reality is, the world is vastly different than it was 40+ years ago in terms of finance, banking, and investment objectives.
Today lets focus on the world’s central banks and their partners – the global banking/finance enterprises. Something very interesting has taken place over the past 20 years. The world’s central banks have avoided crisis and controversy by pouring over $20 Trillion
The wealth and capital that has been created over the past 50 years have acted in multiple means to drive social, economic and human improvement over time. Please take a moment to consider in 1970, the total World Per Capita GDP was $802.123. In 2017 the total World Per Capita GDP was $10,721.609 – this represents a massive 1337% increase over the past 50 years or a total of 26% annually over this span of time.
As the total global debt rose, the amount of capital that entered the markets also rose. At a time when the capital investment was somewhat isolated (in the 1970s), a boom of globalization and cross-nation industrialization/manufacturing created a massive amount of wealth and opportunity for people around the globe. This resulted in a massive 26% average annual increase in global GDP since 1970.
Additionally, the US has been a major driving force in the creation of this new wealth and prosperity. Throughout the late 1980s and 1990s, an incredible new technology launched globalization across almost all nations and increased the ability for all nations to enact new enterprises and commerce in a way that was never even imagined before – the Internet. We will show charts that support our points that Per Capita output rose dramatically throughout this time frame with very little central bank support.
Consider this very important fact regarding the incredible growth of global GDP; after the year 2000, total global capitalization more than DOUBLED over the past 19 years. Yes, that is correct, the amount of capital within the world right now is more than double the total global capitalization that was accumulated over the past 250+ years. The world entered a period where the September 11 attack on the US disrupted the global markets with such force, that a massive amount of capital was deployed to offset the global risks. Again, the 2008-09 global credit crisis created another massive risk event where even more capital was deployed throughout the planet to support the global banking markets and to support institutional infrastructure that allows for continued global growth.
Now, let’s compare this GDP growth to the actual US Federal Reserve total debt. We find it interesting that massive amounts of recent debt have yet to really create any recent massive increases in GDP output. We believe this is a result of a “restructuring” process throughout the global economy following the 2009 through 2014 global market recovery process. In other words, the total global economies have yet to begin firing on all cylinders again and, after a sufficient period of “restructuring”, we believe the global economies will begin to re-sync with renewed optimism and opportunity. Think of this “re-syncing event” as a global revaluation event where proper levels of valuations are attained before a new increase in global GDP output will resume.
The timing of the past 40+ years may have played an important role in providing for the recent GDP increases as well as the global credit market events that have resulted in massive central bank intervention. Our theory is that after the US Fed interest rate peak, near 1982, the continued globalization process (outsourcing of the US economy to other sources throughout the planet) resulted in a “reversion process” within the US that allowed for massive growth in foreign markets while revaluing the US markets to suitable levels and allowing for a transition process to take place across the globe.
This transition process is now mostly complete and the recent 2009~2014 credit crisis that recapitalized the planet with capital/cash has currently primed the global economic engine for a spark. The only thing we’re waiting on right now is for the global markets to settle the “revaluation phase” and latch onto some new technology or infrastructure project that will launch a new economic boom cycle. Within the past 20+ years, the US Fed has pumped nearly $16 Trillion dollars into the global economy (+300% compared to 1999 levels) and the Global GDP output levels have risen from roughly 5.5k to 10.9k (+200% compared to 1999 levels). Comparatively, from 1970 to 1999, the US Fed had pumped over $6 trillion into the global economy (over 450% from 1970 levels) and GDP rose from 0.8K to $5.5k over that same time (+680%). If our analysis is correct, global GDP should begin to increase dramatically and should target levels well above $15~18k within a 10~20 year span.
Let that sink in for a bit as we prepare for Part III of this research post.
If you want to join a group of professional traders, researchers, and friends, then visit www.TheTechnicalTraders.com to learn how we can help you find and execute better trades. Take a look at some of our recent winners to see how we help people, just like you, create success. We believe 2019 and 2020 will be incredible years for skilled traders and we are executing at the highest level we can to assist our members. In fact, we are about to launch our newest technology solution to better assist our members in creating future success. Isn’t it time you invested in your future success by joining a team of professionals dedicated to giving you an advantage in the markets every day?
https://thegoldandoilguy.com/wp-content/uploads/2019/02/Chart1.png714822adminhttp://www.thegoldandoilguy.com/wp-content/uploads/2014/11/tgaoglogo.pngadmin2019-02-21 16:45:562019-02-21 16:45:56Traders Must Stay Optimistically Cautious Part II
https://thegoldandoilguy.com/wp-content/uploads/2018/04/howest-video-interview-Copy.png372594adminhttp://www.thegoldandoilguy.com/wp-content/uploads/2014/11/tgaoglogo.pngadmin2019-02-19 22:43:432019-02-19 22:43:43Podcast Talking About Golds Next Two Moves
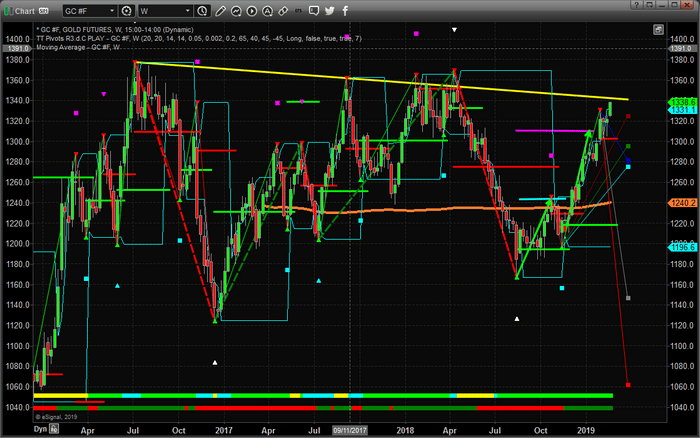
Our research has indicated that precious metals should be setting up for a period of rotation and sideways trading over the next 20~30 days. We issued a research post on January 28, 2019 warning that precious metals would be consolidated over a 30~45 day period before setting up for a massive upside price move, here. This research was based on our Adaptive Dynamic Learning price modeling system and from our Adaptive Learning Cycles system. We believe this research is still very valid and want to alert metals traders that resistance in GOLD can be easily identified near $1340.
The Weekly gold chart, below, highlights the resistance channel that originates in 2016 and continues with multiple peaks in 2017, 2018 and now. We believe this resistance will act as a price ceiling over the next few weeks before metals prices attempt an upside breakout as we suggested in our January 28 research post.
Pay attention to the Fibonacci downside projected price targets near $1270~1295. These levels are very likely to be retested if the current resistance level holds. In other words, gold prices rotate back to below $1300 on moderate price rotation over the next 30 days before attempting to break resistance and move higher. Be prepared for a potential “washout high” price pattern setting up early this week.
We are still actively seeking a deeper price rotation/retracement in Gold/Silver before we initiate any new trades. We believe the upside pricing pressure has reached a level that will prompt a move back to below $1300 on healthy price rotation. If we are wrong, we will know soon enough. If we are right, then the momentum rally setup that will occur near or below $1300 will be a great trading opportunity for all investors. Follow our research to stay informed of this future price movement.
We believe 2019 and 2020 will be incredible years for skilled traders and we are executing at the highest level we can to assist our members. In fact, we are about to launch our newest technology solution to better assist our members in creating future success. Visit www.TheTechnicalTraders.com to learn more.
The one interesting facet of the various research posts our team continues to digest is the continued bearish sentiment that exudes from some analysts. It appears these technical gurus have become married to the concept that global economic issues will crash the US stock market in the near future. We have to give them some credit though. We wanted to take a few minutes of your time to try to highlight how and why we believe these technical gurus are making these points so clearly now and why we believe there are multiple catalysts that they are simply failing to comprehend.
Our team of researchers continues to learn from other skilled researchers, clients, and technicians. Every time we read some news item or someone’s research post, we don’t take the research with a pretense that “these researchers are wrong in their conclusions”. We start off with the pretense that “maybe these people are highlighting something we missed – let’s investigate it”. Thus, our quest is never-ending in the search for greater knowledge and practical application of price theory and technical analysis.
Our recent article highlighting the Expanding Wedge price pattern that is currently setting up in the US stock markets shows what we believe will be the likely outcome for the near-term future – the formation of a Pennant/Flag formation followed by an upside breakout move higher. Although we believe this is the most likely outcome, traders still need to be optimistically cautious going forward.
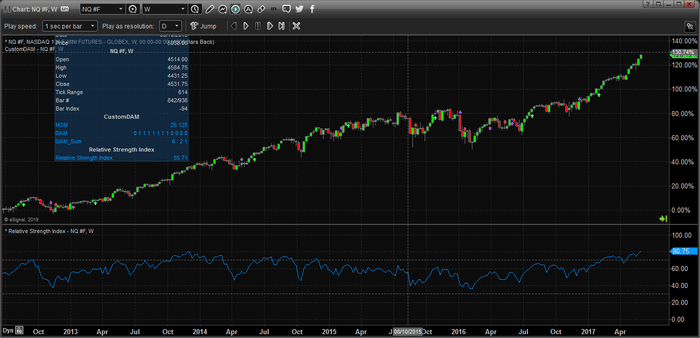
Tools like MACD and RSI are great for making points on charts. These technical indicators can show historically valid triggers and generate a sense of panic if presented in a certain context. Here is an example.
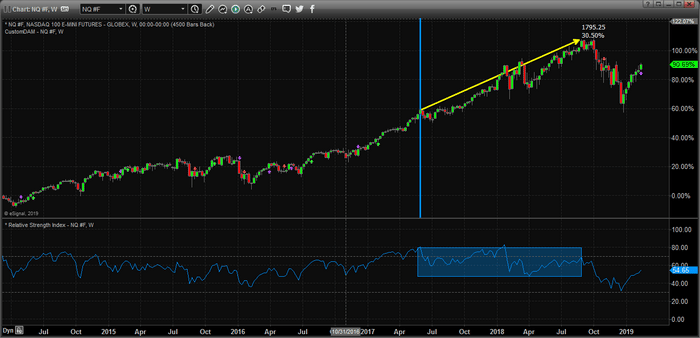
RSI Peaking! History has shown that when RSI peaks above 80, the markets typically correct by at least 8%. Look out below! Look at the right side of this chart, RSI is currently at the highest level since November 2014 and we can see the markets rotated downward by at least 5% shortly after this peak.
Yet, what really happened after this peak is shown in the chart below. We’ve highlighted the RSI PEAK date with a light blue vertical line. See how the markets shot up over 30% after this PEAK/SELL Signal?
The point behind this example and this entire article are that almost anything can be used to make a strategic point if placed in the proper context. We want to learn to read not only the critical points of interest but also the entire scope of the global markets and how the dynamics within these markets are playing out.
Within this multi-part research article, we will attempt to stress three key facets of global market analysis that we feel is critical to the understanding of the future market moves.
_ First, the past 10+ years has resulted in a critical shift from traditional market theory. Prior to 2006~07, the US Federal Reserve continued to operate under the premise of Keynesian Economic Theory (a reference to these points can be found here: https://www.britannica.com/topic/Keynesian-economics).
_ Second, global central banks and the US Federal Reserve had very few functional tools to address global inflation and monetary concerns over the years spanning 1970 to 2006 in terms of credit creation, globalization, capital market influences, and geopolitical shifts.
_ The current market conditions are about to change all traditional means of thinking if we are correct.
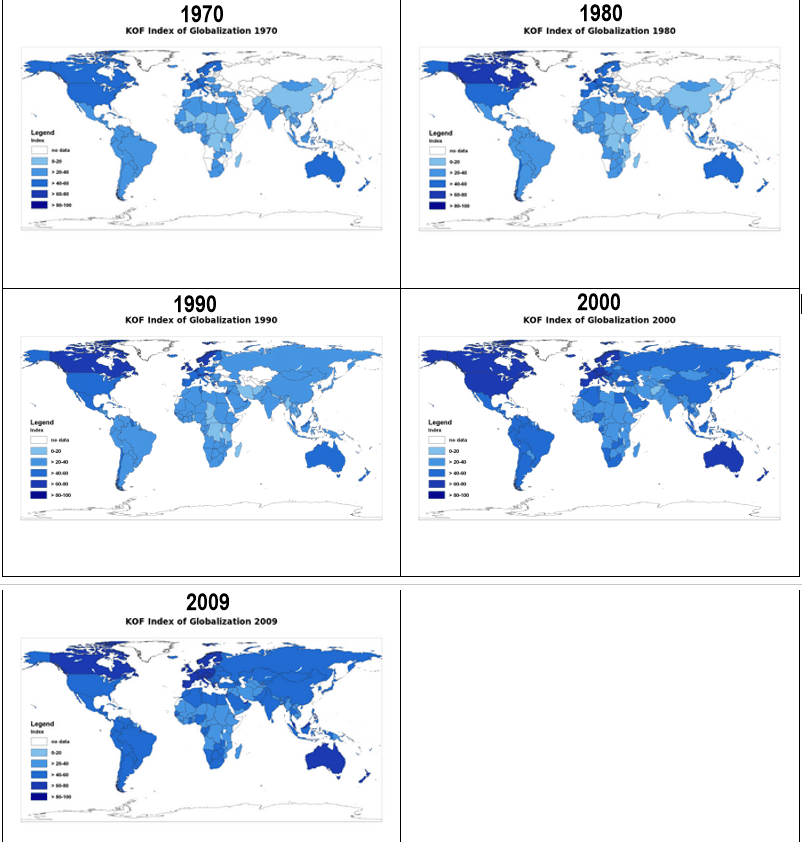
Let’s start by reviewing how things have changed over the past 50+ years and why this is important for all investors to understand. First, we’ll take a look at how global trade and globalized manufacturing has changed how the world operates.
Prior to 1970, the foreign markets were not as heavily traded and it was not easy or efficient for US investors to move capital into foreign asset classes without a very high degree of risk. US investors typically invested in US stocks, bonds, assets and more. They didn’t venture very far outside the US borders unless they possibly wanted to buy real estate in another country.
At the same time, the capital was somewhat isolated and regionalized into localized economies. Yes, the US Dollar had made its way all across the globe by the 1970s, but retail investors typically conducted business in local currencies and with local buyers. The globe was not as inter-connected then as it is now. Everything started to change in the 1980s though and the boom cycle of the Internet (the last 1990s) took all of us to a completely different level.
Once the technology boom cycle started and US companies started outsourcing manufacturing, engineering, software development, resources, culture and opportunity, the role of the central banks changed dramatically. With globalization, the central banks were not simply supporting a localized economy, they were now supporting a globalized economy and had little control over what we call “the bleed our effect”. When we add the September 11, 2001 attack in New York City and the subsequent wars and global destabilization that resulted from continued geopolitical turmoil – what should one expect the result of this outcome to be on the global economy?
Take a look at these images to see how thing changed from the 1970s through 2009.
If you can read these tiny charts of how industrial and manufacturing globalization has expanded over the past 50 years, you will quickly understand how capital and economic advancement has also followed this expansion. Throughout the last 50+ years, continued global expansion of technology, resources, industrialization, and manufacturing has created immense opportunity throughout the planet for billions of people and continues to do so. The question we need to focus on is “is the current global market in any way similar to the markets of 30+ years ago?”
What would it take to replicate a market crash that occurred in 1929 or 2009 at this point? Sure, 2009 is a recent example of a global credit market crisis that was the result of many decades of policy and expansion in the making. Yet, at this time, what would it take to replicate this type of market crash and what would the process of this crash originate from?
In the next part of this article, we’ll continue to focus on aspects of the global economy that we believe support our longer-term global market analysis and continue to explore the total scope of the global markets instead of singularly focusing on single points of interest.
If you want to join a group of professional traders, researchers, and friends, then visit www.TheTechnicalTraders.com to learn how we can help you find and execute better trades. Take a look at some of our recent winners to see how we help people, just like you, create success. We believe 2019 and 2020 will be incredible years for skilled traders and we are executing at the highest level we can to assist our members. In fact, we are about to launch our newest technology solution to better assist our members in creating future success. Isn’t it time you invested in your future success by joining a team of professionals dedicated to giving you an advantage in the markets every day?


 (Source: https://www.jvi.org/special-events/2016/global-drivers-and-effects-of-capital-flows.html)