Over the past 4~5 months, our research team has authored numerous articles and research posts attempting to help traders and investors understand the future market moves.  As today is the last day of January 2019, we thought we would highlight some of our research to help you better understand exactly how our unique skills and tools can assist you.

Remember, at the time of the first post, September 17, 2018, the markets were still about 2~3 weeks away from setting up a major top.  There wasn’t a single analysis, except our team, that had the foresight and knowledge to make the predictions we did on that day.  We still get comments from our members asking us how we did it.

Take a minute to read through this detailed history or our research posts to learn why Technical Traders Ltd. is continuing to be one of the best informative forward research and trading solutions you can find anywhere.  We believe our team and proprietary price modeling tools are superior to many others out there and our record stands for itself.  We are not perfect, but very few others can call the markets future 5+ months in advance and pretty much “nail it”.

We are currently revamping our Wealth Trade Alert Newsletter members only area to provide our live technical charts and tools so they update throughout the day with our signals, morning index day trades with live chatroom, SP500 index momentum and swing trades, and our special MRM “Momentum Reversal Method” for small and mid-cap stocks.

Keep in mind, these new and exciting new features are being created and we hope to move to the new member’s area and format over the next few weeks.

We help make big trend trading simple for investors and traders to find success and execute better trades in 2019.
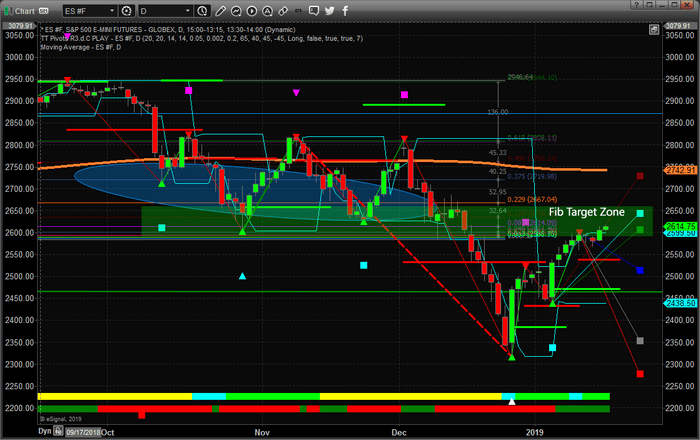
 

STOCK MARKET CALLS

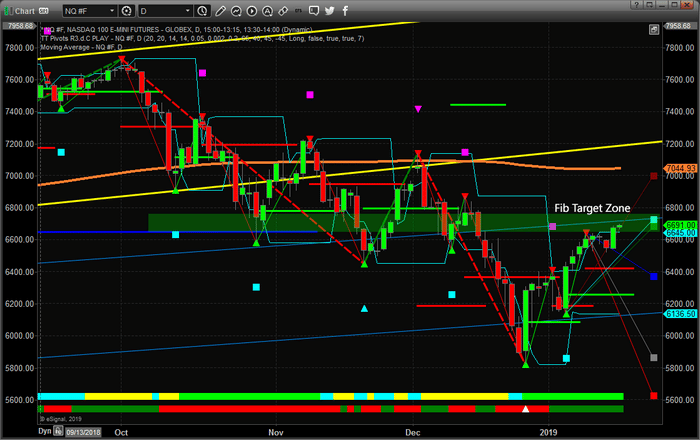
September 17, 2018:  PREDICTIVE MODEL SIGNALS MARKET TOP
https://www.thetechnicaltraders.com/predictive-trading-model-suggests-falling-stock-prices-us-elections/

December 26, 2018: STOCK MARKET BOTTOMING
https://www.thetechnicaltraders.com/has-this-selloff-reached-a-bottom-yet/

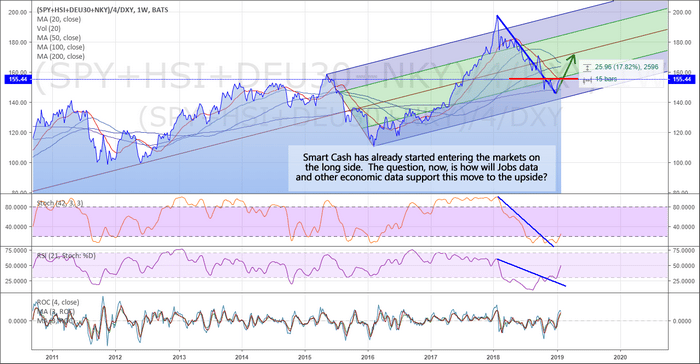
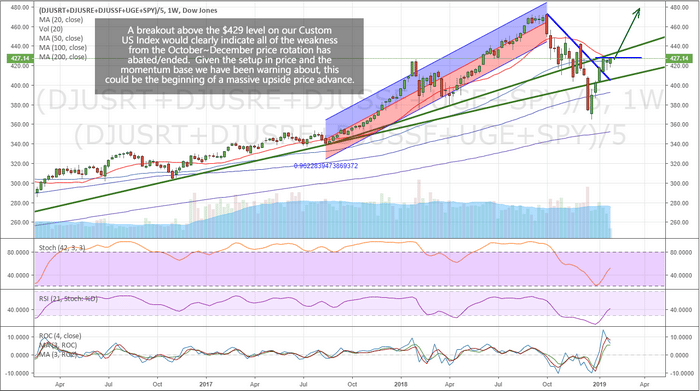
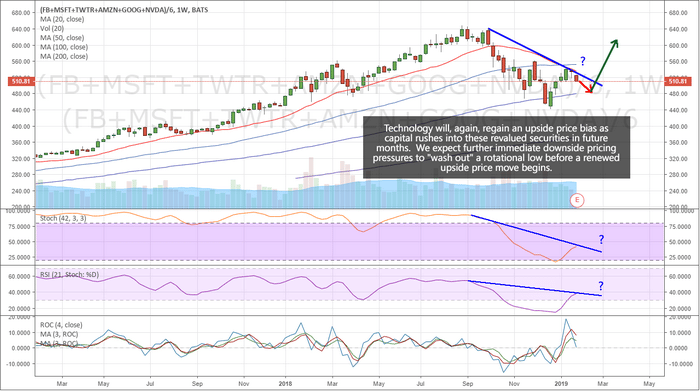
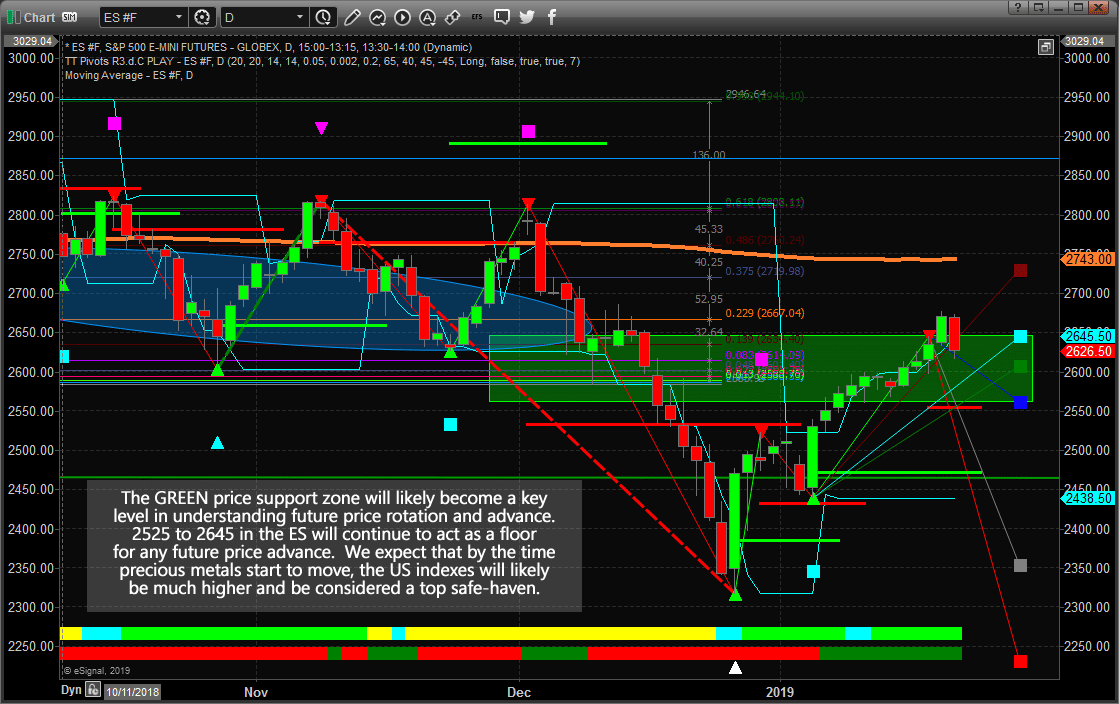
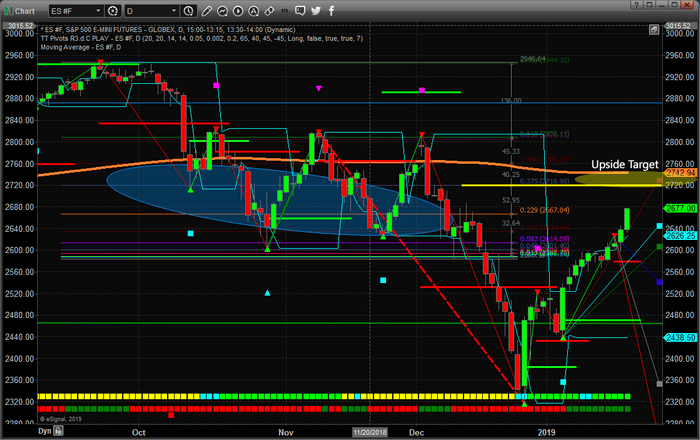
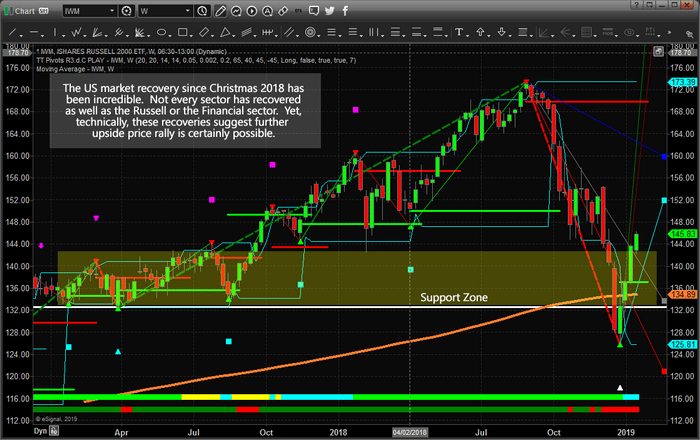
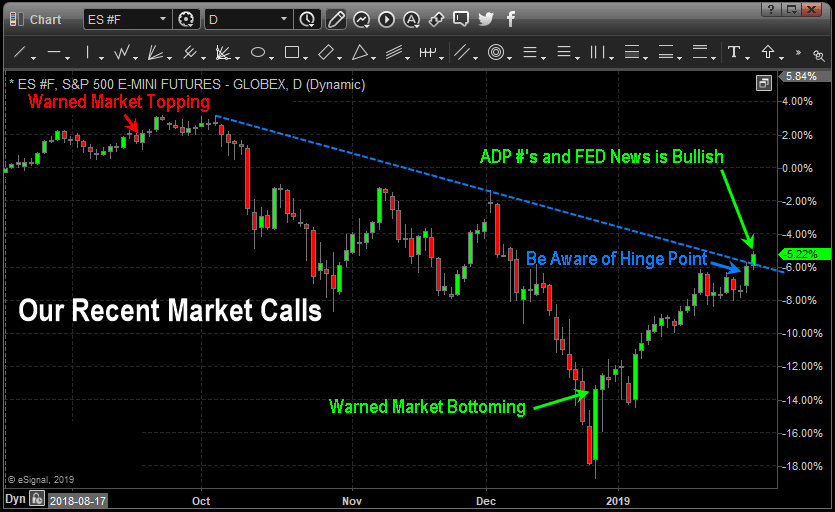
January 30, 2019: US EQUITY MARKET RECOVERY HINGES ON THE NEXT MOVE
https://www.thetechnicaltraders.com/us-equity-market-recovery-hinges-on-the-next-move/

January 30, 2019: ADP NUMBERS AND THE US FED HIT THE LAUNCH BUTTON
https://www.thetechnicaltraders.com/adp-numbers-and-the-us-fed-hit-the-launch-button/

PRECIOUS METALS CALLS

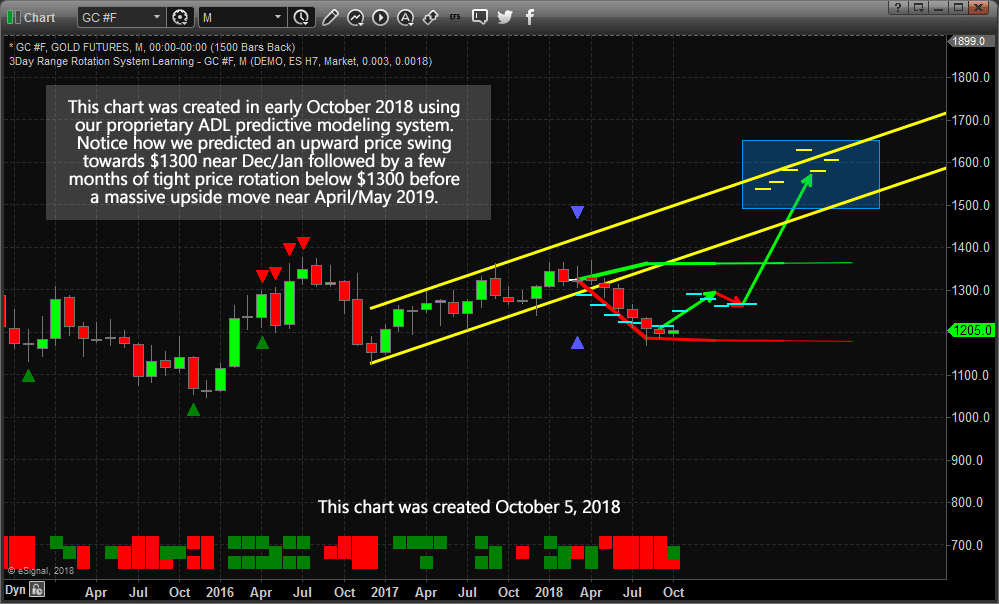
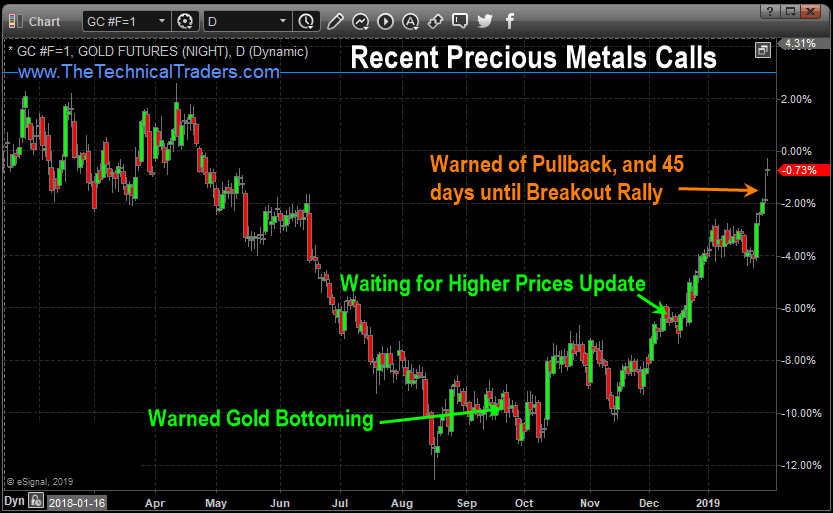
September 23, 2018: WARNED PRECIOUS METALS BOTTOMED
https://www.thetechnicaltraders.com/gold-and-miners-are-about-to-explode-upward/

December 12, 2018: JUST WAITING FOR GOLD & SILVERS NEXT RALLY
https://www.thetechnicaltraders.com/expect-gold-silver-to-pullback-before-the-next-move-higher/

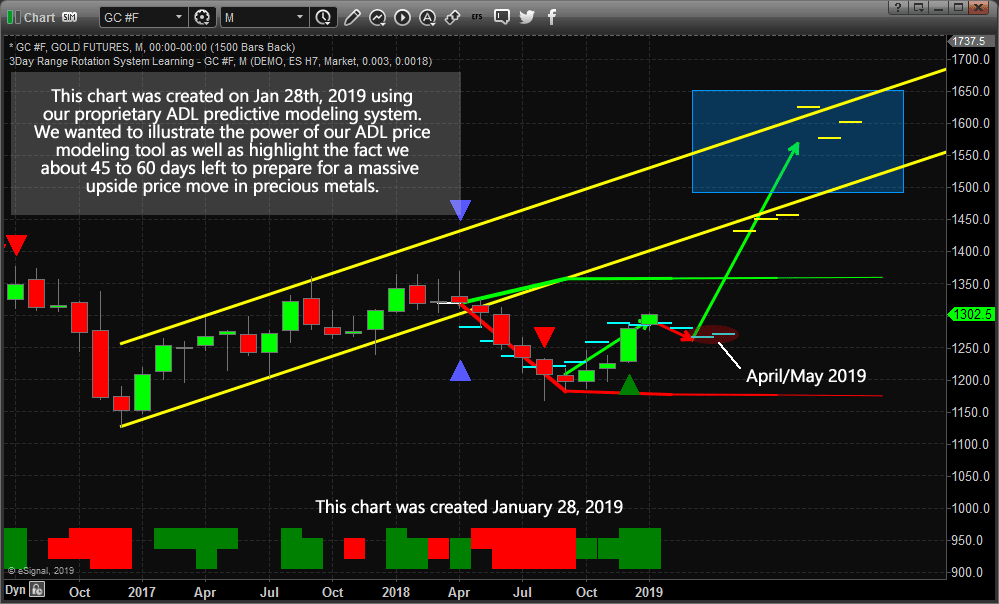
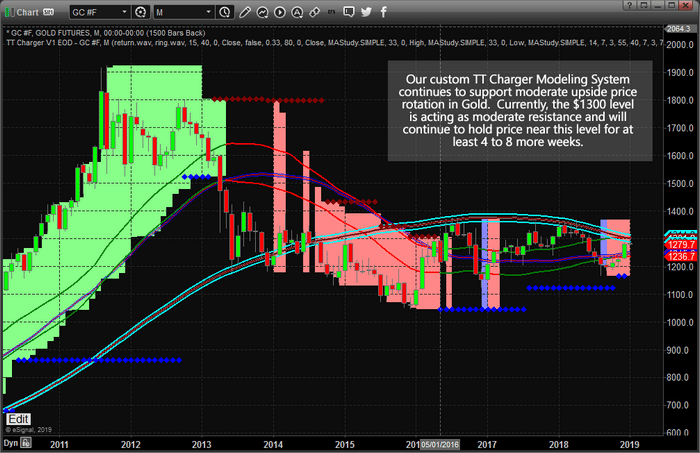
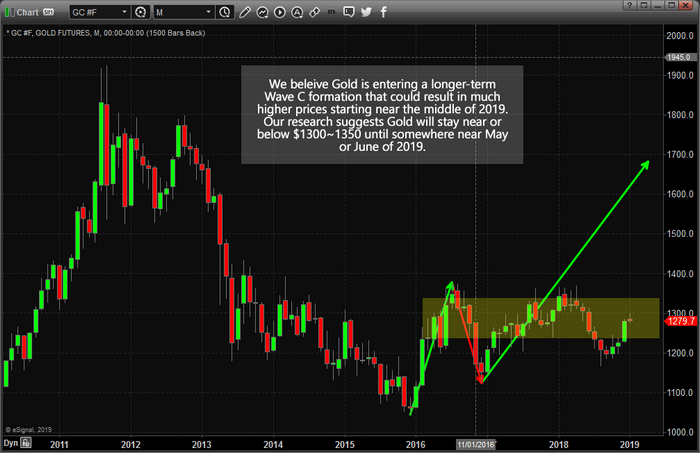
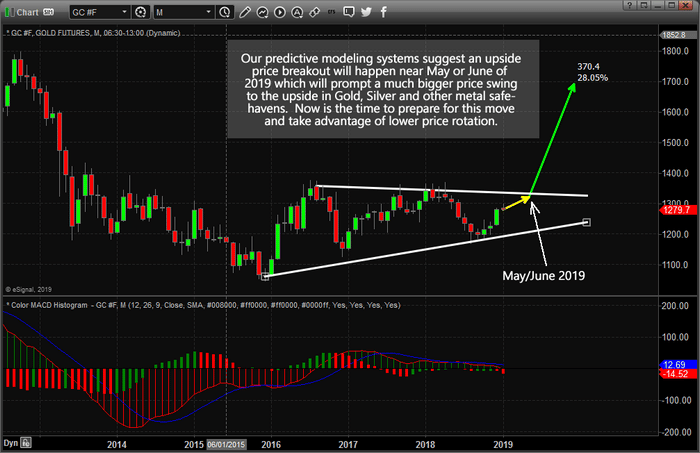
January 28, 2019: 45 DAYS UNTIL A MULTI-YEAR BREAKOUT IN PRECIOUS METALS
https://www.thetechnicaltraders.com/45-days-until-a-multi-year-breakout-for-precious-metals/
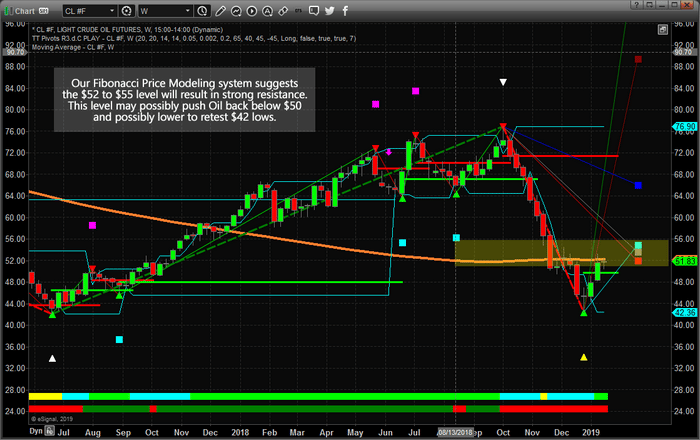
CRUDE OIL CALLS

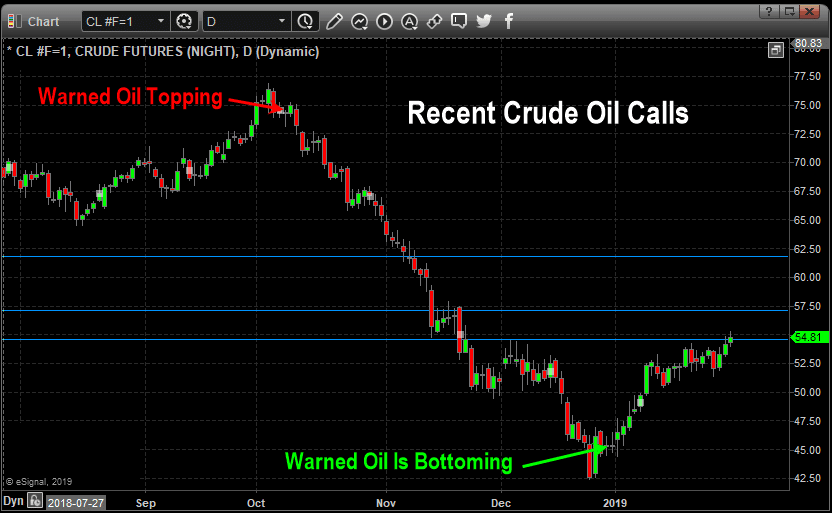
October 7, 2018: PREDICTIVE MODEL SIGNALS OIL TO FALL
https://www.thetechnicaltraders.com/will-oil-follow-historical-patterns/

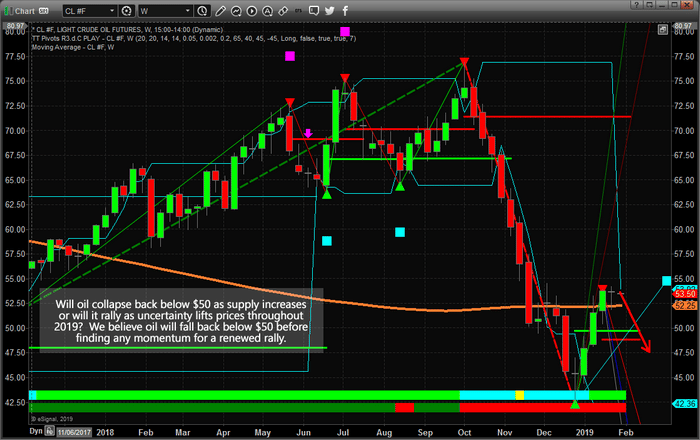
December 31, 2018: OIL – WHAT TO EXPECT WITHIN THE FIRST 3~5 MONTHS OF 2019
https://www.thetechnicaltraders.com/what-to-expect-within-the-first-35-months-of-2019/

WHAT SUBSCRIBERS ARE SAYING

I just want to tell you how much I appreciate your no nonsense. I’ve read other advisors who hedge their bets with so many caveats that you could never actually put on a trade. So far, you have been crystal clear with your analysis and, even better, it has been correct!

JOHN BRIERLY
Teacher

I really appreciate how hard you are working for us members… and how we’ve been able to make money recently when I might have been panicking without you. I’m learning a lot from you. Thanks.

TOM ROBERTS
Accountant

I am looking to expand my knowledge in trading, and I like your methods. I am new to the game and I’m finding your advice very helpful and very profitable! I almost can’t wait for the updates.

STEVE USHINSKI
Video Editor

We look forward to seeing you in our member’s area to experience our newest tools for traders/members.

SUBSCRIBE TO OUR WEALTH TRADE ALERT NEWSLETTER RIGHT NOW!

Chris Vermeulen
Chief Investment Strategist
Technical Traders Ltd.

Get ready for a potential blastoff in the US stock market as all-stars are beginning to line up for an incredible upside price rally.   The Fed, taking a warning from the markets and the global economy, has decided to leave rates unchanged for now.  It appears they have moved to a more cautious stance in an attempt to foster continued economic growth over rate increases.  The purpose of this is clear to anyone watching what is happening across the planet – the US is the strongest, most mature economy on the planet.  The US fed can’t risk creating another debt/credit collapse at this time.  It is better to move in measured steps than to move “all-in” over a short period of time.

Additionally, ADP released their Jobs numbers for December 2018 today with an expected 271k jobs number.  This is an incredible number for December.  Our interpretation of December employment numbers is that the Christmas hiring has already ended and many companies are have already shipped/supplied product for the holiday season.  By December, we expect to see weaker jobs data with the expectation that firms are downsizing payroll while planning for the Spring sales season to get started.  This does not take into consideration the weather events that typically plague December.

The only things left for this rally to really blast off would be strong earning data and some resolution to the China trade issues.  If either of these “booster rockets” hit the news cycles over the next 30 days, we could easily see the US stock market rally toward all-time highs in a matter of weeks – not months.


Pay attention to the way price is setting up and take special note of the fact that the US economy and stock market are really the biggest, and safest location on the planet, right now, for any capital.  As long as these numbers keep pouring in like this and the US Fed doesn’t hit the “panic button”, there is a very good chance that the US markets will continue to rally until some type of foreign market event deflates this move.

Have you been suckered into shorting this rally over the past few weeks?

We have been expecting this rally since the end of December and we do feel it will continue to trade sideways or higher for a couple more months, at which time we will need to reevaluate the state of the market. The Feds move was bullish for stocks and it could be enough to send the market substantially higher, but it also means they know the economy is not as strong as they thought and didn’t feel it would be good to raise rates.

The chart below shows what could happen if stocks can rally and close above last weeks high. It could spark another run-up in stock prices to new highs.


Overall, the stock market is at a critical tipping point much like the December 2000 market top, April of 2008 market top, and the two continuation moves during October 2011 correction and rally, October 2015 correction and rally. What happens over the next couple of months will determine where your long-term investments should be placed.

Visit http://www.thetechnicaltraders.com  to see how we’ve been calling these moves. We’re not perfect at making calls – that would be completely unreasonable to think we can predict the future 100% of the time.  But we are confident that our daily videos, proprietary price modeling tools, and detailed global market research will provide you with the advantage you need to create more success – Join Now!

Chris Vermeulen
www.TheTechnicalTraders.com

The research team, at The Technical Trades Ltd., has been calling this market move quite accurately.  We made predictions on September 17, 2018, that called for a -5~8% downside market rotation, followed by price support just before the November 2018 US elections.  After that, we called for a deep “Ultimate Low” price rotation to setup followed by a strong price rally.  Even though we under-estimated the ultimate low-price rotation which was much deeper, our trend predictions from 120 days earlier are playing out quite accurately.

Currently, we are writing this message to all our followers to inform them that the Feb 1 Jobs report, as well as other critical earnings and economic data, are the “unknown factors” that have stalled this upside market move.  At this time, it is our belief that capital has already started re-entering the US stock market and that a good portion of these investors are waiting for further evidence that a resurgence of price appreciation will continue without any new crisis events unfolding.  Our September 17, 2018 analysis suggested that the US markets would find support after a “revaluation event” and continue an upward price bias.  As this point, we believe we have reached the “momentum launchpad”.


Custom Technology Index on a Weekly Chart

This first chart shows our Custom Technology Index on a Weekly basis. Our opinion is that Technology will likely continue to rotate a bit lower over the next few weeks, setting up a support level near or above December 2018 lows.  This “setup” will likely prompt a new momentum base for Technology and the broader US equities markets to begin a renewed upside price rally.  It makes sense that earning data, forward expectations, geopolitical news and renewed future guidance would prompt a price rotation near these current lows before capital comes rushing back into this sector attempting to ride the next wave higher.

I should note that we have been getting bearish signals on many of the leading tech stocks this week and when the majors sell off it pulls the indexes down as well. Tech stocks lead the bull market but are now underperforming and the smart money is now flowing into new sectors of the market with precious metals being the market leader. Its traders market now meaning you can’t just go buying big brand name stocks and make money, rather you need to be nimble and move to sectors and stocks that have investors money pouring into them.


Smart Capital Index Weekly Chart

Our Smart Capital Index, shown below on a Weekly basis, highlights the recent resurgence in buying in the US markets as well as highlights the current resistance near the RED line on this chart.  This level represents a lower boundary that is acting like a temporary ceiling.  A decent jobs number, continued strong earnings and economic data, as well as moderately strong future guidance, should see this level breached in early February or early March.  In other words, even with reduced forward earnings guidance and income, the US equities markets are still the only game in town for global capital to avoid currency, economic and political risks that seem to be everywhere.

You can see from this Smart Capital Index that we’ve seen a massive revaluation event unfold from January 2018 to January 2019.  Even though the US markets stayed relatively flat throughout this time, comparatively, our global Smart Capital Index showed the global markets were revaluing equity investments with a tremendous -26% price decline.  That’s right, over the past 12 months, the global equities markets have declined by over 26% in a revaluation event that was initiated by global market concerns in China, Asia, Europe, and the Emerging Markets.

Our opinion is that a “reversion event” will likely take place over the next 12+ months where the strongest economies in the planet will recover to near or above the middle/upper levels on the Smart Capital Index chart.  This would represent an 18~30% price recovery on this chart – or a 20~30% price recovery from December 2018 price lows for the US major indexes.


We have to remember that the US markets have become a leader in global markets and a safe-haven for global investors.  Even though our Smart Capital Index has shown a massive price decline of -26%, the Dow Jones only decreased by -18% over that same time-span.  Thus, if we are expecting a +18~30% price recovery on this chart, the Dow Jones may easily recover by 20~30% or more throughout this event.

The next 2~4 weeks will likely play out where Technology rotates lower and sets up a momentum base before starting to move higher.  Our opinion is that the US Major Markets will likely base as well over this time.  We believe a renewed buying interest will begin after February 16th as global investors continue to seek returns and safety for the remainder of 2019.  We strongly believe the continued capital shift into the US markets will take place as soon as this momentum base sets up and price support is clearly evident to traders.  This means we have about 2~4 weeks to plan for and set up strategic trades in preparation for this move to the upside.

Want to learn how we can help you find and execute incredible trading opportunities in 2019?  Want to learn how our incredible proprietary price modeling systems can help you stay ahead of these market moves?  Our researchers continue to call market moves 60, 90, 120+ days in advance.  Visit www.TheTechnicalTraders.com to learn more about what we do and how we can help you create greater success.

Chris Vermeulen

Today is the day we want to warn our followers that we expect the precious metals to continue to base with a fairly narrow price range for about 45 to 65 more days before upside pricing pressures start to take hold of the markets.  There has been quite a bit of chatter about Gold breaking above $1300 recently.  Many people have been expecting it to move much higher fairly quickly.  We don’t believe that will be the case – but expect it have another significant rally in April, May or June.


Monthly Gold Forecast Chart – Posted October 2018

Back in early October 2018, we shared this chart with all of our followers suggesting that Gold and precious metals would rally to above $1300 near December/January using our Adaptive Dynamic Learning predictive modeling system.  We’ve been suggesting to our followers for many months that Gold, Silver, and miners would begin a new upside price swing, yet we knew the big breakout moves were still many months away.

Pay very close attention to the DASH lines on the chart and the GREEN and RED arrows we drew to help our followers understand what we expected to see happen in the future.


Todays Updated Monthly Gold Chart

Now, take a look at the current Gold chart below with the same ADL levels displayed on it.  Notice how price moved towards the DASHED lines almost perfectly in alignment with our predictive modeling results?  Yes, the move in December was a bigger upside swing compared to the previous few months, but that is what happens when a “price anomaly” sets up with the ADL system.  When the price falls “out of alignment” with the ADL predictions, we call this a “price anomaly”.  This is when the price may quickly rally or sell-off, depending on the direction of the anomaly, to attempt to catch up to the mathematically predicted price levels.

Currently, we expect the price of Gold to stay between $1250 and $1320 for the next few months while it consolidates towards the $1260~1275 range near early April or early May 2019.  And that will be all she wrote, folks.  Because once price settles near this level near the April/May timeline, this should be the basing formation that will launch massive new momentum to the upside.  Our opinion is that it would be best NOT to wait till the last minute to prepare for this move.  Even though we expect this move to start near April/May of 2019, it could start to melt-up earlier than we expect – this is why we are warning you today that we have about 45 days left to plan and prepare for this trade. Subscribers entered a long GDXJ position down near the lows at $27.52 a while back slowly preparing for this major market bottom.


Daily SP500 Index Chart

If our analysis is correct, the US markets will settle into a melt-up format where global capital continues to pour into the US stock market in an attempt to avoid risks associated with global market slowdowns and events.  This “capital shift” will continue to play out for the first 2 quarter of 2019 without much interruption.  Our ADL predictive modeling system is suggesting that by May/June of 2019, precious metals should start to rally above $1400 and that means something is going to cause fear in the markets.  It could be the US Presidential election cycle spinning up or it could be something external – we don’t know yet.  We do know that the Brexit date, March 29, 2019, is likely to spark some renewed fears in the global markets and we are eagerly watching the news cycles to see what is next.

The current support levels in the ES is between 2525 and 2645.  We recently posted a public article sharing our research regarding our opinion that rotation near 2670 was likely and that the GREEN support zone should act as a floor for current price rotation.  Our Fibonacci price modeling system is suggesting there is a vast array of support in this zone where the price should base, build power and begin a continued upside “melt-up” over the next 60~90+ days.


Why is it important to understand that this stock market may continue to rally as Gold and precious metals begin a breakout upside move?  It is important to understand how fear rotates through the markets as a result of “origin”.  The origin of the event or crisis that is generating this fear in the markets tends to shift perception as to the extent this fear/event will reach other economies.  With the 2008-09 credit market crisis, the origin was the US and global financial institutions – the biggest institutions on the planet.  We believe the new crisis event may be “regional” to Asia/China and Europe.  Thus, the origins and reach of these events may be more isolated than last time.

Also, we know that the once leaders of a market (tech) become the dogs, and the unwanted assets become market leaders. Commodity/resource stocks (precious metals) tend to outperform the USA stock market in the final few months before the bull market ends and that could be what is happening right now. Tech stocks are lagging while the precious metals sector is one of the strongest.

We believe 2019 is going to be the year where skilled traders can make a fortune if you know what you are doing and can see these moves in advance.  Our team of traders and researchers at www.TheTechnicalTraders.com are dedicated to helping you find and execute better trades.  Visit our web site and see how we can help you build for a greater future.  I will drop one little hint before the news hits the wires, we are building a new client services portal that will blow your minds in terms of ease of live intraday analysis, trading opportunities from day trading, to swing trades, and even our own long term investment signals).  This new client portal will allow you to more actively engage with our team and fellow traders of our service.  Get started now as we are only a few weeks away from launching these new member tools.

Chris Vermeulen

Recent global news regarding Venezuela, China, and global oil supply/production have resulted in the price of Oil pausing over the past few weeks near $53 to $55 ppb.  We believe the continued supply glut and uncertainty will result in oil prices falling, briefly, back below $50 ppb before any new price rally begins.  Our researchers at www.TheTechnicalTraders.com believe historical resistance near $54~55 is strong enough to drive prices lower before new momentum picks up for a renewed price rally.

Eventually, yes, oil will rally above $55 and attempt to target the $65+ price level.  Yet we don’t believe that move is going to happen right now.  We believe the global uncertainty; the slowing Chinese economy and the global supply glut will result in a fundamental price decrease before any momentum for an upside price move begins.  Our analysis suggests a price move back below $50 ppb, likely targeting the $46~47 level, where basing may occur.

Uncertainty in Venezuela and other oil-producing nations may result in a disruption in supply at some point in the future.  We must be cautious of unknown situations that could result in dramatic price shifts.  Yet, overall, with supply levels still high and slowing global economic expectations, it makes sense that oil would attempt to base and find support near recent lows – between $46~48.

Visit www.TheTechnicalTraders.com to learn how we can help you find and execute better trades in 2019.  Learn how our proprietary predictive modeling systems have called these moves in the past and how our research team can assist you in finding great opportunities in the future.

Chris Vermeulen

If you have been following some of the research posts by some of the biggest names in the precious metals industry, you may understand “why” so many people are so excited about the opportunities in Gold and Silver recently.  There are so many facets to the fundamental and emotional functions of precious metals as an industrial commodity as well as a safe-haven investment to protect against risk and to hedge against inflation.  Old school traders were taught to “watch gold, oil, and bonds” for signs of concern, weakness and as a means of gauging total market sentiment.  The idea behind this statement was these market tend to act as the “canary in the coal mine” in terms of fear and risk.

Recently, we posted an article that suggested Gold, Silver and many other precious metals would move in unison as this new price expansion takes place.  Many of our modeling systems are suggesting that Gold will rocket well above $1400 sometime near May or June of 2019.  These predictive modeling tools help us to identify opportunities and price moves well ahead of the other research firms available today.  Our unique tools can actually pinpoint times/dates when breakout moves should take place and allow traders to prepare for these moves months in advance – like today.

Within this article, we are attempting to highlight the fact that any lower price rotation in Gold or Silver would be an excellent opportunity for skilled investors to target new positions or to acquire more physical material.  We believe Gold and Silver will continue to rotate near current price levels over the next 30~60+ days while setting up a moderate range of rotation.  Buying near the lower range of this rotation will allow traders to set up advantageous long positions ahead of the suggested breakout dates and really capitalize on any upside advance.  Let’s go over some of our expectations as we prepare for this next move higher.

First, our TT Charger system on this Monthly chart shows that the core price support/resistance range, the CYAN, and RED narrow price channel, is currently just below $1300 and moving slightly lower.  This is important because this longer-term chart is reacting to the price peak from 2012 and this price channel is currently providing a resistance zone that we expect the price to break above in a very aggressive manner.  You can also see the BLUE DIAMONDS that represent current bullish price trend.  Since early 2016, the TT Charger modeling system has identified Gold as being in a bullish price trend.


This next Monthly Gold chart is strictly price action.  Our belief is that the resistance zone, highlighted in YELLOW, will act as a horizontal price channel over the next 30~60 days as price continues to build support and momentum for the upside breakout.  This suggests that any price level below $1240 would provide an excellent buying opportunity for skilled traders that believe as we do.  The future price rotation should continue to tighten as we near the May/June breakout date – thus, we may only have a few of these deeper low price rotation ahead.


Lastly, this Monthly Gold chart highlights our expectations of a FLAG FORMATION breakout and how we believe the price will meander a bit higher, closer to the $1325 level, before the big breakout to the upside happens.  You can see from the WHITE lines drawn on this chart that potential for price rotation nearing $1200 exists, yet we are not expecting any deeper price rotation over the next 2~3 months.  We believe any move below $1240 would be considered a fairly deep price low and present a clear opportunity for skilled traders.

We believe Gold prices will continue to congest closer to the $1300~1320 level as we get closer to the breakout dates.  Therefore, we suggest traders pay attention to price rotation as it plays out in the future for real setups and opportunities in the precious metals.  The large GREEN arrow showing a potential breakout towards the $1700 level is our estimate of this potential upside move.  Our predictive modeling systems are suggesting a minimum of $1550 will be reached by September 2019.  Thus, we are expecting a $1600~1700 initial price advance through this upside move that would start a WAVE C price advance.

We urge all traders to pay very close attention to these moves in the precious metals.  These are incredible opportunities that are setting up right before our eyes.  If you understand what this move means for the global markets and for equity markets, then we know you value our research.  If you want to stay aware of these types of moves and learn how our predictive modeling tools can help you find and execute better trades, then take a minute to visit www.TheTechnicalTraders.com to learn what we offer our clients.  Trust us, you really want to have a skilled team of researchers helping you understand how to prepare for this move.

Chris Vermeulen


Recently, we openly discussed the potential for global turmoil related to Europe, Asia, China, and South America. The issues before the globe are that the global economy may not be firing in sync and that there are credit and debt, as well as geopolitical, issues that persist. The interesting component of all of this is that the US stock market has staged a very impressive recovery over the past two weeks that have shocked even the best Wall Street analysts and researchers. While the US recovered from elections, the Fed, FANG price collapse and a Government Shutdown, the US stock markets appeared to be falling off a cliff. Then, almost exactly on Christmas Eve, the markets turned around – even in the midst of all of this uncertainty.

Now, nearly 3 weeks after Christmas, the US stock market appears to be shaking off the negativity and headed for higher price levels. China announced a plan to eliminate the trade barriers between the US by providing a 10-year plan to gradually eliminate any US trade deficit. Even though China has discussed this plan before, the US stock market ate it up like a starving man on a deserted island. The ES rallied over 3.35% this week. The NQ rallied over 3.0% and the YM rallied over 3.25% week.


SP500 Daily Chart

We are still expecting some decent price rotation over the next couple weeks, but the markets could continue to push higher attempting to reach our Upside Target Zone without any real break. Right now, it appears any decent earnings, even a “miss”, or any moderately good news is going to be eaten up by this market that just wants to rally.

ES Monthly Chart

This ES Monthly chart showing our TT Charger modeling system show the system never flipped into a bearish mode and that the Range Level on this chart is suggesting the markets could rally back to near all-time highs again. Of course, this could be many months into the future. Still, it appears the upside move is far from over as we expect a multi-month sideways/higher price as the market determines if we are still in a bull market or bear market.


NQ Monthly Chart

This NQ Monthly chart showing our TT Charger modeling system continues to suggest the bullish trend is intact and shows deeper support. This would indicate that the recent price rotation was now a severe risk in the technology sector and could have been a capital rotation/revaluation that was needed after such a massive upside price swing.


Either way, we need to understand the bias is neutral long term here. This is much like what we say in 2015 when the market was on the verge of a bear market, but Trump was elected and we had the presidential rally save the market until now.

What will save the market this time around? The US markets appear to still be bullish based on our longer-term modeling systems. Any real positive news (a deal with China, a Brexit deal, increased US economic output and/or any resolution to geopolitical issues) could be a catalyst for an explosive upside move.

Friday’s pop/rally proves this point clearly. Just the “hint” of some type of deal with China, even though it was nothing more than a whisper of some 10-year plan to gradually try to balance trade issues, resulted in a 1.25%+ upside move across the board. Imagine what could happen with some real positive news.

Pay attention to these markets moves.  2019 is poised to be a very exciting and profitable year for skilled traders and wise investors. Visit www.TheTechnicalTraders.com to get our daily and weekly analysis forecast complete with long term investing swing trading, and index day trade signals.

53 years experience in researching and trading makes analyzing the complex and ever-changing financial markets a natural process. We have a simple and highly effective way to provide our customers with the most convenient, accurate, and timely market forecasts available today. Our index, stock and ETF trading alerts are readily available through our exclusive membership service via email and SMS text. Our newsletter, Technical Trading Mastery book, and 3 Hour Trading Video Course are designed for both traders and investors. Also, some of our strategies have been fully automated for the ultimate trading experience.

Chris Vermeulen

For those that still believe the US markets are weak and poised for a total collapse, we want to bring something to your attention. Throughout weeks of uncertainty about China trade deals, the US government shutdown, continued Brexit issues and who knows what else… oh yeah US Q4 Earnings data, guess what has been taking place in some US sectors? That’s right, a rather solid price recovery.

Two of our favorite sectors to watch for signs of strength and weakness have been rocketing higher over the past few weeks after setting up a very deep price low near Christmas 2018. The Russell 2000 ETF (IWM) and the Financial Sector ETF (XLF). While the ES, NQ, and others are still waffling around trying to find the momentum to break out to the upside, pay attention to the other sectors that could be leading the way.

Weekly IWM (Russell 2000) Chart

This first Weekly IWM (Russell 2000) chart clearly shows the support zone that was set up in early 2018 after the February 2018 price collapse. Yes, the recent October 2018 price collapse drove price below that support level, but it appears this is a “wash-out” low price reversal where traders panicked on the news and other events. The fact that this recovery has taken place may cause some to consider this a “dead-cat-bounce”, but we’re not seeing that in our research. This could/should be the start of something that pushes prices sideways/higher for a few months, at which time we will need to see to these sectors and the rest of the markets are performing to determine if the overall market is still I a bull market or about to drop into its first bear market leg down.


Weekly XLF (Financial Sector) Chart

This next chart is a Weekly XLF (Financial Sector) ETF showing our Fibonacci price modeling system and a similar Support Zone. One thing that is rather interesting about these charts is that they are both moving substantially higher this week while recently breaking above our Fibonacci bullish trigger level (shown near the right side of the chart as a GREEN LINE). The XLF chart also shows that the current price is well above the BLUE and CYAN Fibonacci projected target levels. This indicates that price may be attempting to move back into the earlier Fibonacci price range (retracement range) to establish more rotation. This new price rotation will set up new Fibonacci modeling system trigger points and tell us where the next move is likely to target.


Yes, we do expect some downside rotation near current levels. We don’t expect this rotation to be very deep or concerning. Price must move in waves, up and down, to support future momentum higher or lower. Our Fibonacci modeling system is suggesting any current downside rotation will likely result in a new momentum move to the upside. Still, these sectors are on fire right now and we urge traders to be cautious of any longs because we are expecting some downside price rotation over the next week or two before the next rally.

Pay attention to these markets moves.  2019 is poised to be a very exciting and profitable year for skilled traders and wise investors. Visit www.TheTechnicalTraders.com to get our daily and weekly analysis forecast complete with long term investing swing trading, and index day trade signals.

53 years experience in researching and trading makes analyzing the complex and ever-changing financial markets a natural process. We have a simple and highly effective way to provide our customers with the most convenient, accurate, and timely market forecasts available today. Our index, stock and ETF trading alerts are readily available through our exclusive membership service via email and SMS text. Our newsletter, Technical Trading Mastery book, and 3 Hour Trading Video Course are designed for both traders and investors. Also, some of our strategies have been fully automated for the ultimate trading experience.

Chris Vermeulen

Our Adaptive Fibonacci modeling system is suggesting Crude Oil may have already reached very strong resistance levels just above $50 ppb. It is our opinion that a failed rally above $55 ppb will result in another downward price move where prices could retest the $42 low – or lower.

You can see from this Daily Crude oil chart that price has formed a consolidated price channel between $50 and $53 ppb. This price channel aligns with a November 2018 price consolidation zone. It is our belief that any advance above $55~56 ppb, will result in a new upward price move to $64-65 ppb.


This Weekly crude oil chart highlights the Fibonacci projected price zones that represent the incredibly strong resistance level currently setup in Crude. The Weekly chart shows a zone between $50~56 as a critical resistance zone. One key element of Fibonacci price theory is that price must always attempt to seek out new highs or new lows as it rotates. Thus, if this current upside move fails to establish new highs above this resistance zone, then it must move lower to attempt to establish new lows. This means the $40 price target is a very viable immediate objective.

Global demand for oil, as well as global economic data, could be key to understand the future demand and price for oil. At this point, a new upper fractal top formation will generate new Fibonacci price targets to the downside. If our opinion proves to be correct, we will learn of these new price targets within a few weeks.

Want to learn how we called the move in Oil from $76 to $43? Visit www.TheTechnicalTraders.com/FreeResearch/ to read all of our recent research posts. We help traders find and execute better trade by using our proprietary tools to keep them informed and to alert them to new trade opportunities. Visit www.TheTechnicalTraders.com to learn how we can help you make 2019 a fantastic year.

Chris Vermeulen

Near December 21, 2018, our research team began a series of posts indicating the US Major Indexes should be set up for the “Ultimate Bottom” low that we suggested would take place after the US Elections (November 2018) and which would launch an upside price rally.  Today, we are writing to announce that the first leg of this upside move appears to be nearly completed.

It is critical to mention here that as of only a day go the short-term market trend from a technical standpoint has turned up. So, getting long before this point would be trying to catch a bottom which is tough and risky to do. The good news is that we are expecting a second leg higher after we get some rotation to the downside.

Using our Adaptive Fibonacci Price Modeling system, we can see that the current prices of the ES and NQ are very near to the immediate Fibonacci Price Target Zone.  You will see from the following charts that both the ES and NQ are already within this zone and/or very near to what we believe will be immediate resistance.  This means we should expect a bit of price rotation near these levels before another upside leg takes place driving prices higher.

This first Daily ES chart shows the Fibonacci Target Zone clearly in Green.  You can see how price has rallied up to near this level and may even rally a bit further before rotating downward a bit.  Remember, price rotation in a trend is very healthy for normal markets.  When price moves extensively in one direction or another is somewhat unhealthy and dangerous.  When price moves up or down in rotating waves or price cycles, this is a very healthy means for the price to establish support/resistance and to wash out groups of traders that may be biased in the markets.


This Daily NQ chart shows a very similar, although more narrow, Fibonacci Target Zone.  The result is virtually the same as the ES chart.  Price should attempt to establish some resistance within this zone and the potential for a downside price rotation increases near this level.  We are expecting a downward price move, possibly toward the BLUE Fibonacci downside target square level, before the price rally resumes to drive prices above recent highs and into the next leg higher.


If you have followed our analysis, on September 17, 2018, we predicted 4~5 months into the future what would likely happen.  Our call for an “Ultimate Low” price reversal after the Nov 2018 elections appears to be setting up perfectly.  Although we did not predict this extreme low price level in that research post, the overall expectations we had in September were nearly perfect.

If the remainder of our analysis continues to play out as accurately, we should be setting up for a very big move to the upside over the next couple of months.  It will likely be paired with decent earnings data from the US, moderately strong economic data and the resulting economic improvements of a China Trade Deal and the resolution to the US Government Shutdown.  The issues in Europe are set to reach a peak somewhere near March or April 2018.  We expect the US markets to be trading several percents higher by that time.

Pay attention to these markets moves.  2019 is poised to be a very exciting and profitable year for skilled traders and wise investors.  Visit www.TheTechnicalTraders.com to get our daily and weekly analysis forecast complete with long term investing swing trading, and index day trade signals.

53 years experience in researching and trading makes analyzing the complex and ever-changing financial markets a natural process. We have a simple and highly effective way to provide our customers with the most convenient, accurate, and timely market forecasts available today. Our index, stock and ETF trading alerts are readily available through our exclusive membership service via email and SMS text. Our newsletter, Technical Trading Mastery book, and 3 Hour Trading Video Course are designed for both traders and investors. Also, some of our strategies have been fully automated for the ultimate trading experience.

Chris Vermeulen