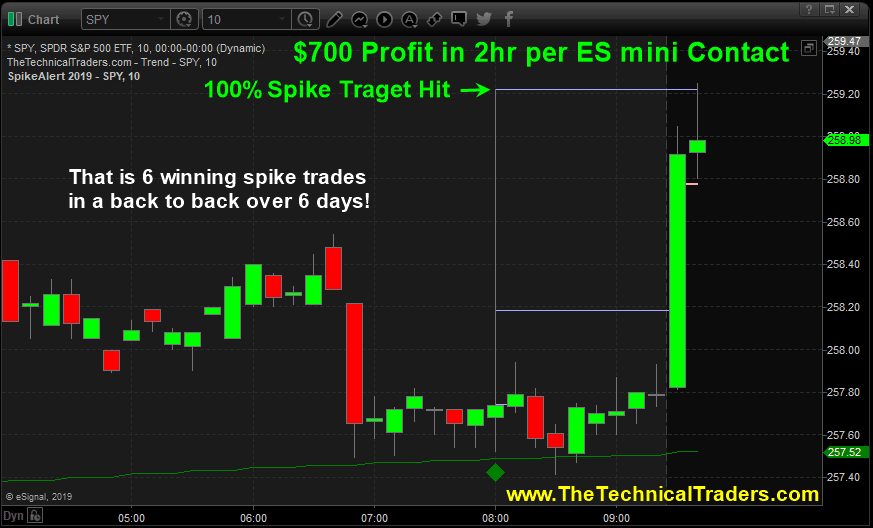
It’s hard not to get excited when we kick start the week with a winning trade within the first 2 hours of trading. Our proprietary price spike trading strategy that has generated 6 winning trades before the opening bell for the last 6 days in a row.
Also, what is really exciting is that we have had 5 winning Gap Window Trades in the past 6 days as well. that’s 11 winning trades in 6 days and no losing trades!
RECENT MEMBER COMMENT
These daily emails have helped immensely.
This is the best and most practical service I’ve used in the 6 years I’ve been trading.
Thanks, Ben
Jan 14th 2019
Housekeeping Notes: Please note we are in the process of upgrading this trading newsletter to become a full trading suite for long-term investors, swing traders, and day traders complete with our live updating trading charts, analysis, and signals. The trades in our portfolio only represent ETF swing trades and not our price spike, gap window, or cycles based trade setups, but all trades will start to be posted and tracked in their own areas of the site once we complete these upgrades for you.
Over the next 30-60 days, there will be incredible value added to the service which you will not find anywhere else. The analysis, tools, and trade setups will improve the way you see the markets and trade no matter what time frame your focus is on (investor or active trader). Exciting stuff and let us know what you think would be valuable for us to improve on and add to the member’s area for you.
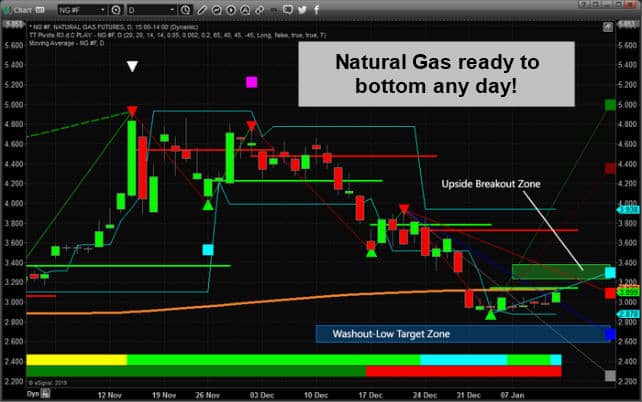
Very cold weather across the Northwest and Eastern US, as well as moderate demand globally, should prompt a renewed rally in Natural Gas through at least March or April of 2019. A move to, or above, $3.30~$3.40 would indicate there is little chance of a Washout-Low price formation and that a new rally is in place.
Over the past week, we have been remained bearish on natural gas but Friday’s strong close and Sunday nights price of natural gas futures showing a 7% pop signals a potential trend change happening.
In short, natural gas was oversold, its been testing the $3.00 whole number which acted as support for the price. Also, our cycle analysis does point to higher prices from here. The trend had not fully reversed, but it appears to be doing that as of this writing.
We believe Natural Gas provides an excellent opportunity for a move back to near $4.20~$4.40 as the extended cold weather and global demand continue to put renewed pricing pressure on this commodity. We believe the next upside move could be very fast regarding upside price recovery.
While natural gas is can provide some explosive moves for short term gains, if you are a short term trader looking for pre-market trade setups, and morning gap trades similar to the 8 winning trade setups we had last week be sure to check out our last post onPrice Spike Trades, and Gap Windows!
http://www.thegoldandoilguy.com/wp-content/uploads/2014/11/tgaoglogo.png00adminhttp://www.thegoldandoilguy.com/wp-content/uploads/2014/11/tgaoglogo.pngadmin2019-01-13 22:51:352019-01-13 22:51:35Will Natural Gas Breakout Or Breakdown Next?
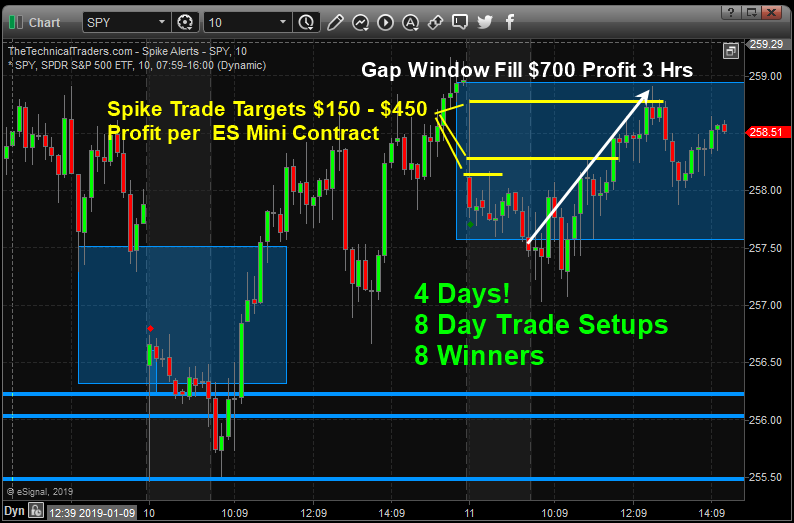
This has been the best week in a long time for intraday trades. The last 4 days the SP500 gave us 8 trades and all 8 turned into winners. Each days turning generating between $300 a $1250 per ES mini contract, although these can be traded using the SPY or 3X index ETFs.
Subscribers who day trade are taking this pre-market analysis and setups and making a weeks wage within 1 – 3 hears in the morning before lunch.
What makes these trade triggers is that they are the BROAD market SP500 so if you day trade other stocks knowing the short term market direction each morning add so much power to your other day trades for timing entries and exits.
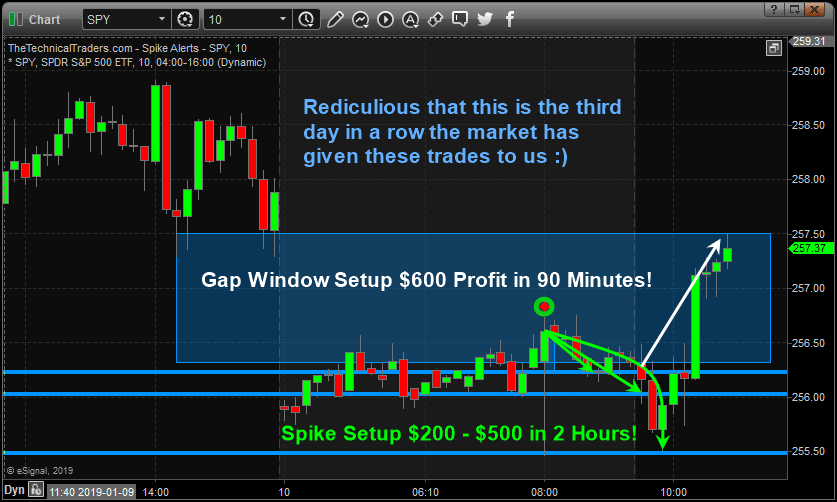
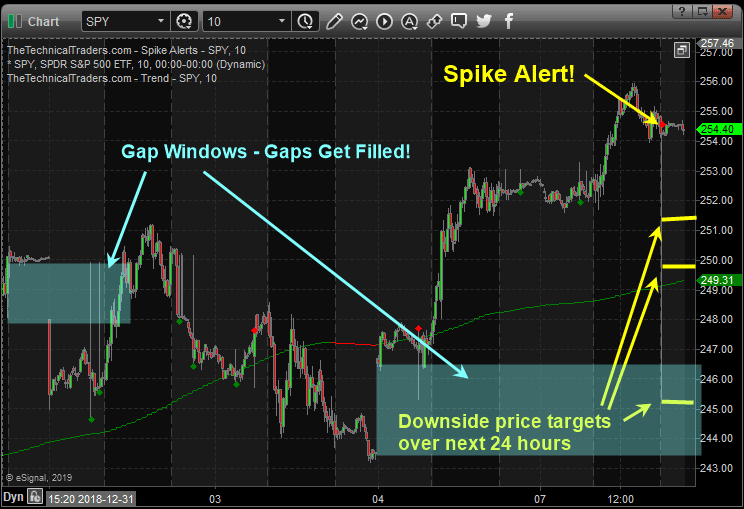
SPY ETF 10-Minute Chart
This chart focuses on today’s spike higher and gap lower. both these played out once again and are based strictly on technical analysis and statistical analysis.
https://thegoldandoilguy.com/wp-content/uploads/2019/01/daytra8s.png523794adminhttp://www.thegoldandoilguy.com/wp-content/uploads/2014/11/tgaoglogo.pngadmin2019-01-11 16:00:182019-01-11 16:01:18How To Consistently Make Money Day/Swing Trading
Our ideal morning market swing as I mentioned in today’s members-only video has played out. A price drop to reach spike targets, then a reversal rally to gap fill. This is the third straight day the market had done this for us, it’s not always this good or frequent. 6 winning trades in 3 days is tough to beat and one day pays for years worth of access to our Wealth Building Newsletter Service.
If you don’t know about our two best short term trade setups which are the “Gap Window” and “Price Spike” then you’ll want to learn more and we will be adding a detailed trading guide on exactly how to trade these for our subscribers.
These charts and triggers are what we are implementing within the member’s area with live updating charts and signals so you have a steady stream of winning trades each week to keep your account growing.
The chart below shows the moves and profit potential trading the ES mini futures contract, but as long as you can trade pre-market hours with your broker you can trade the SPY and 3X SP500 based ETFs for these setups.
I know these are very short term trades and not ideal for many of you to trade, and we are looking into an auto-trading solution for these early morning trades. Know that we are focusing on implementing our active swing trading strategy for a steady stream of trades as well.
https://thegoldandoilguy.com/wp-content/uploads/2019/01/3diar.png502837adminhttp://www.thegoldandoilguy.com/wp-content/uploads/2014/11/tgaoglogo.pngadmin2019-01-10 13:19:592019-01-10 13:19:59Two Must Know Trade Setups That Happen Every Week
https://thegoldandoilguy.com/wp-content/uploads/2018/04/howest-video-interview-Copy.png372594adminhttp://www.thegoldandoilguy.com/wp-content/uploads/2014/11/tgaoglogo.pngadmin2019-01-09 22:19:312019-01-09 22:19:31Warning Signs from Russell 2000 and Dow Transports
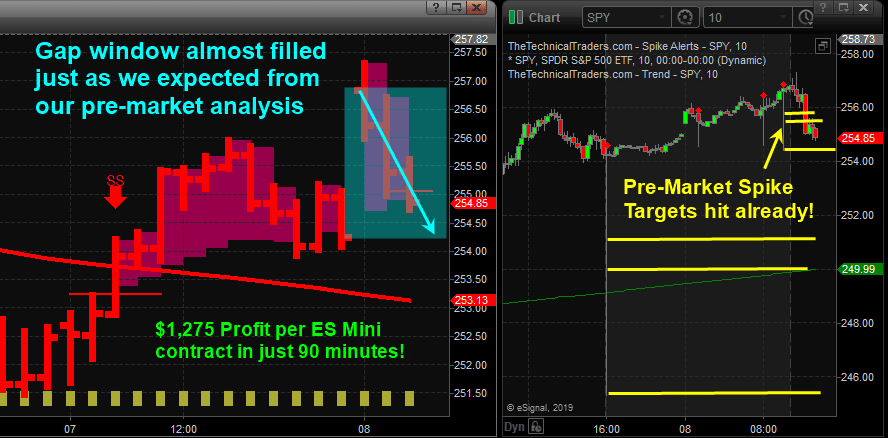
As we mentioned in an update to members Sunday night, over the next 30-60 days we are working to implement and automate some of our best trading setups (Trend/Swing trades, spike alerts, and gap trade) so they post instantly for you in the member’s area. Our goal is to provide members with 1-3 trade setups each week like clockwork.
Below is a quick update showing two setups that unfolded this morning and they are winners for those of you who are momentum and day traders. These two trade setups “Price Spikes” and “Gap Windows” are based around momentum. These trades typically reach their targets in 1-24 hours and this morning both reached our targets for quick easy money!
We are also going to be implementing our index trading signals and intraday updated chart analysis so we don’t miss any trades and have a steady stream of trading opportunities.
Also, we plan to add our HotShots ETF and Stocks list so when we have a buy signal in the SP500 you can look to trade something with a high beta that is outperforming the broad market. ETFs include 3X funds for various indexes and sectors and leading high-beta stocks which move 3-20% a day at times.
2019 – 2020 is going to be full of incredible opportunities so be sure to become a paid member today to benefit!
If you are a long-term investor, swing trader, or day trader, then you could find one or all of the charts below interesting. What I am going to briefly cover and show you could make you think twice about how you are investing and trading your money.
I will be the first to admit you should not, and cannot, always pick market tops or bottoms, but there are certain times when it’s worth betting on one.
Below I have shared three charts, each with a different time frame using daily, 30 minutes, and a 10-minute chart. Each chart also has a different technical analysis technique and strategy applied.
Each shorter time frame chart as we work down the page zooms in closer to more imminent price action that should take place over the next few days.
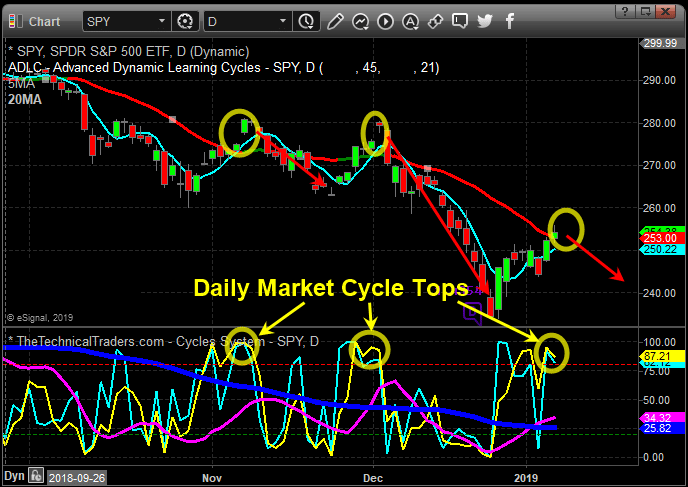
Daily Chart Signals Market Top – Investing/Swing Trading
The daily chart below shows a clear overall trend which is to the downside. Trends are more likely to continue than they are to reverse, hence the saying “The Trend Is Your Friend.”
A key piece of data on this chart is the blue investing cycle line at the bottom. If this is trending down or below the 50 level, then money should be focused on profiting from falling prices via inverse ETF’s, short selling, or put options.
Equally important are the yellow and baby blue cycle lines at the bottom. When these enter the upper reversal zone, we should expect sellers to step into the market and for the price to fall.
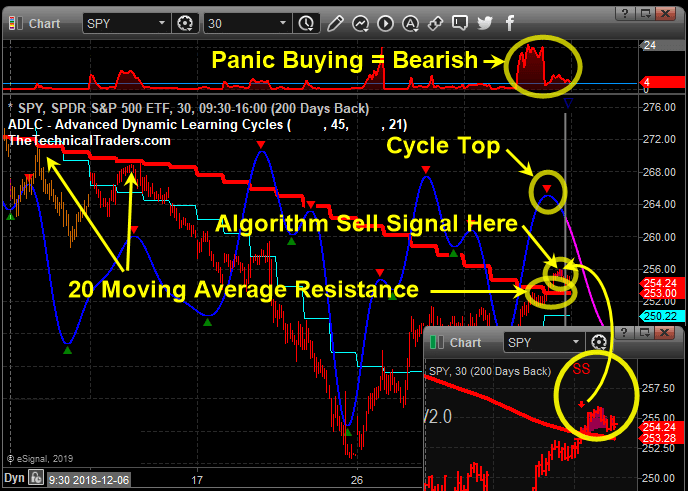
30-Minute Chart Signals Market Top – Swing/Momentum Trading
I apologize for the noisy chart below, a lot is going on there, but if you focus on the yellow text and drawings, it will help keep things simple.
This chart shows several reasons why we expect the price to fall. Based on technical and statistical analysis this chart points weakness over the next 1-3 trading days.
10-Minute Chart Signals Market Top – Momentum/Day Trading
Monday night (Jan 7th) after the closing bell the SPY ETF chart generated a sizable price spike to the downside. Those of you who follow our spikes and or at least know about these setups then you know we expect the price to reach at least one if not all spike targets which are 30%, 50%, and 100% of the spike within 36 hours.
So far in 2019 we have has six price spikes five winners, one loser which is an 83% win rate thus far. Today’s spike is abnormally large not sure what that means regarding this one being a success but it is another spike signal, and the odds favor a move down once you see the other analysis supporting this setup.
In short, 12 months I publically posted a 31-minute video on the stock market explain how 2018 would be wild and how the stock market should top out which it confirmed this a week ago when the December monthly stock market chart closed below critical support. The video goes on to explain how 2019-2020 will most likely be a bear market and economic recession, and that is exactly what looks and feels like is starting to unfold behind the scenes.
If you are boring long-term investor and have been stuck having to ride the stock market rollercoaster with your life savings my trading newsletter can help you with your long-term portfolio to not only avoid losses but profit from the collapse with one simple inverse exchange-traded fund which trades like a stock and you buy and sell it at anytime! Knowing when you put your nest egg to work, and when to back away and protect it is crucial if you want to become wealthy or become wealthy.
On the flip side, if you are an active trader looking for monthly trades then be sure to join the Wealth Building Newsletter today and receive my daily pre-market video analysis, so you understand what took place yesterday, during overnight trading, and what to expect when the market opens.
Subscribe today and become part of our trading community and prosper from the coming market correction and real-estate downturn.
https://thegoldandoilguy.com/wp-content/uploads/2016/01/charts.jpg300580adminhttp://www.thegoldandoilguy.com/wp-content/uploads/2014/11/tgaoglogo.pngadmin2019-01-08 07:51:122019-01-08 07:51:12How to Spot A Tradable Market Top?
Early trading on January 4, 2019, saw Gold reach just above $1300 per ounce – confirming our price target from our research and posts on November 24, 2018. The importance of this move cannot be under-estimated. Traders and investors need to understand the recent rally in the metals markets are attempting to alert us that FEAR is starting to re-enter the market and that 2019 could start the year off with some extended volatility.
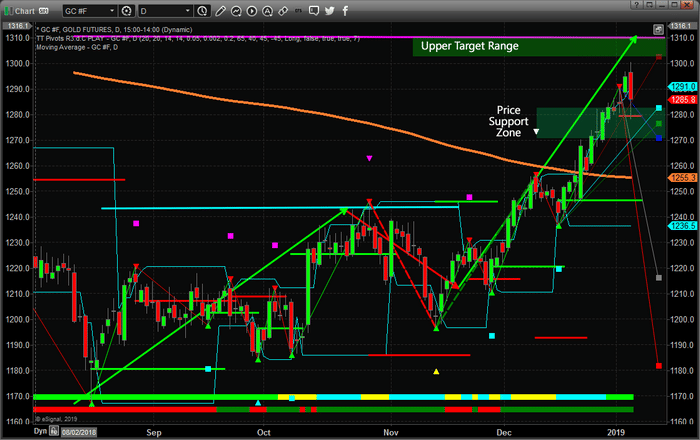
Our research has shown that Gold will likely rotate between $1270~1315 over the next 30~60 days before attempting to begin another rally. Our next upside price target is near $1500. We will continue to post articles to help everyone understand when and how this move will happen. We expect Gold to rotate near the $1300 level for at least another 30 days before attempting another price rally.
Pay attention to the Support Zone on this Daily Gold chart and understand that price rotation is very healthy for the metals markets at this point. A reprieve in this recent Gold rally would allow the start of 2019 to prompt a moderate rally in the US stock market as well as allow a continued capital shift to take place. As capital re-enters the global equities markets, investors will be seeking the best investment opportunities and safest environments for their capital. Our belief is that the US stock market will become the top-tier solution for many of these investments.
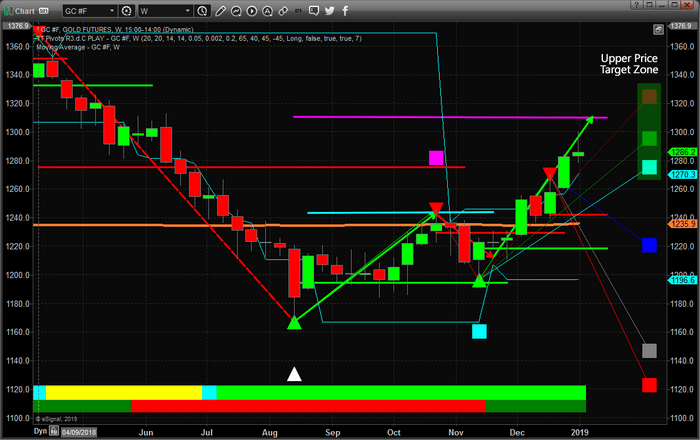
This Weekly Gold chart shows our Adaptive Fibonacci price modeling system and why price rotation is important at this time. The highlighted GREEN Fibonacci price target levels on the right side of this chart are projecting upside price objectives for the move that started near mid-November. We can see that $1325 (or so) is the highest target level and that $1273 to $1288 are the lower levels. This suggests that we have already reached the upper resistance range and a mild price rotation would allow for the price to establish a new fractal low rotation that would establish NEW upside Fibonacci price targets. In other words, we much have some price rotation to support the next leg higher in the Metals markets
If you’ve been following our research and comments on the past 90+ days. You’ll already know that we’ve nailed many of these market moves. The SPY, Natural Gas, Oil, Gold, Small Caps and so many more. We’ve been calling for a massive price bottom in the US stock market since well before the November 6th US Elections. Our proprietary predictive modeling systems called the huge moves in Oil, Natural Gas, Gold/Silver, and many others. If you were not profiting from these moves, then you need to visit www.TheTechnicalTraders.com to learn how we can help you in 2019. Our memberships are very inexpensive and the support we provide you is incredible for skilled traders. Want a team to help you create success in 2019, then visit www.TheTechnicalTraders.com and get started creating success.
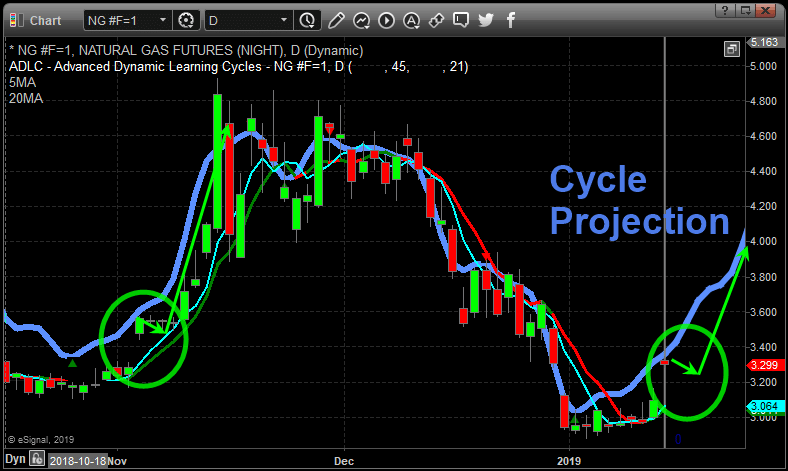
Our research team has been nailing the markets moves with our proprietary price modeling tools. Our December 12, 2018 call that Natural Gas would collapse nearly 30% after reaching a price peak was a very bold call. Who would have thought that predictive price modeling could be so accurate and could identify a move like this – or call for what is expected to happen next?
Back when Natural Gas breached the $4.60~4.80 range, our ADL predictive modeling system was suggesting a massive price anomaly was setting up. These types of triggers are becoming more common as volatility in the general markets increases. The ADL system suggested that a massive -30% downside price move would happen before the end of February 2019.
Now, as that trade has completed and our targets have been reached, we are alerting our followers that Natural Gas should begin to consolidate between $2.80 and $3.30 before attempting to rocket back above $4.00 near April or May 2019. Read our original analysis of Natural Gas to learn why these moves provide an incredible opportunity for traders and visit www.TheTechnicalTraders.com/FreeResearch/ to read up on our early 2019 market predictions.
Join our other members in making 2019 an incredibly successful year. We believe 2019 will provide exceptional opportunities for skilled traders and we’ll be happy to share our proprietary research and analysis with you as a member of Technical Traders Ltd. You really don’t want to miss these moves and this incredible opportunity. Think about it, one trade like this with a -30% selloff followed by a 24% price rally could make your entire year. Imagine being able to find trades like this every week or month for success. Visit www.TheTechnicalTraders.com and get ready to make 2019 a fantastic year of success no matter if we have a bull market or bear market.
Chris Vermeulen
https://thegoldandoilguy.com/wp-content/uploads/2019/01/Chart_19-01-02_NG_3Target.png440700adminhttp://www.thegoldandoilguy.com/wp-content/uploads/2014/11/tgaoglogo.pngadmin2019-01-06 21:23:282019-01-06 21:23:28Natural Gas Through our $3.20 Target – What Next?