Here at Technical Traders Ltd., our inbox has been full of questions from followers regarding the recent market rotation and concerns about another downside move. We understand trading is an emotional process and that fear and anxiety often play a very big role in decision making – we get it. So, before the markets open for trading this week, we wanted to share some exciting news and we hope this helps to settle some emotions.
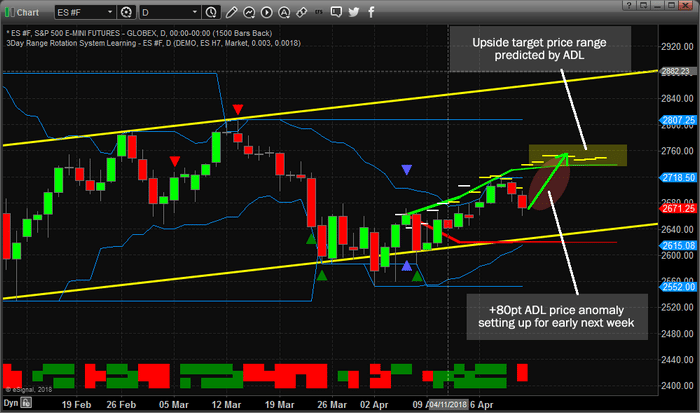
As you are probably well aware of by now, our Adaptive Dynamic Learning (ADL) price modeling systems has been nailing the markets for the past 7+ months for both intermediate and intraday highs and lows. One of the most powerful components of this predictive modeling system is watching for price correlation to modeled behavior and watching for what we call “price anomalies”. We have mentioned this before in previous research articles.
Before we continue, its important to mention that we will no longer be posting these (ADL) forecasts and trade setups publically. This analysis is reserved for our subscribers and for our own trading to take full advantage of the markets.
Price anomalies occur when the current market price is under some level of pressure (upward or downward) that pushes price away from the predicted levels. This happens with global news events, earnings events and other market psychology events. Our opinion is that price reacts to these external events over a relatively short period of time, then, as the events settle, price reacts to the traditional behavioral models predicted by the ADL modeling system and attempts to recover to near these predicted levels. Let’s take a look at a recent example of these ADL price anomalies and how the work.
In this example below, we see two recent weekly ADL price anomalies and how the market price reacted to “revert” back to the ADL predicted price levels. We believe these types of events are price level exceptions that occur with some regularity in the markets and can be traded to our advantage for some incredible gains. Pay attention to the DASHED baby blue lines from the ADL modeling system that shows the predicted price levels.
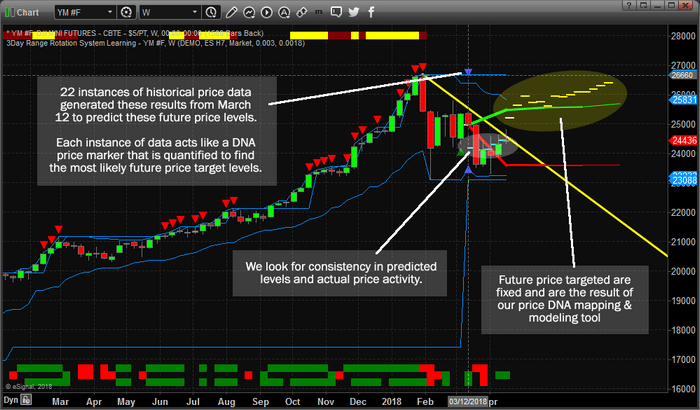
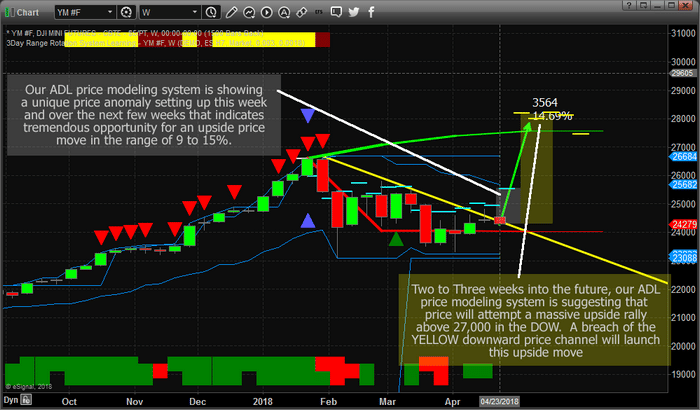
Now, lets take a look at a current Weekly YM chart to see how the current price anomaly is setting up. Almost similar to the first price anomaly in the upper example, yet in the opposite direction, the current price anomaly is indicating an incredible 10~14%+ upside price potential within the next 2 to 5 weeks. We believe this upside potential is being ignored by much of the market because of the recent downside price pressures that have kept a lid on the upside breakout. We do believe that once that downward sloping YELLOW price channel line is breached, the upside price move will begin and likely be a VERY FAST move up.
Lastly, you might be asking yourself how we reconcile various ADL predictive price levels that could present various or conflicting predictive pricing? First, please understand that the ADL price modeling system is just one of the tools that we use in our analysis. Secondly, the data you are not seeing which is only shown to the researchers and analysts is the “predictive probability” of each predicted price level.
We know which levels have a higher degree of probability than others – thus we can use this knowledge to determine which outcome is more likely. Also, more recent analysis from the ADL pricing model with high degrees of price correlation and probability are, in our opinion, more relevant to the future price levels than older price analysis. With our ADL predictive modeling system, we can see many days, weeks or months into the future – the trick is to understand how to use it properly.
In closing, with all the fear and emotions running at high levels, we wanted to settle our readers minds a bit with this analysis and these charts. If you take a look at the predictive price level for this next week, the YM should attempt to move back to near 25,540. The following week, the YM should be attempting a more aggressive upside move to near 27,500 or higher. We are just waiting to see that YELLOW price channel line be broken before this price move initiates.
If you want to learn more about our analysis or maybe you just want winning trade alerts, take a look at our Wealth Building Newsletter service and see how we can assist you in finding and executing great trades every month. We have members from 87 countries that following our daily technical analysis video and trade alerts each week. Visit www.TheTechnicalTraders.com

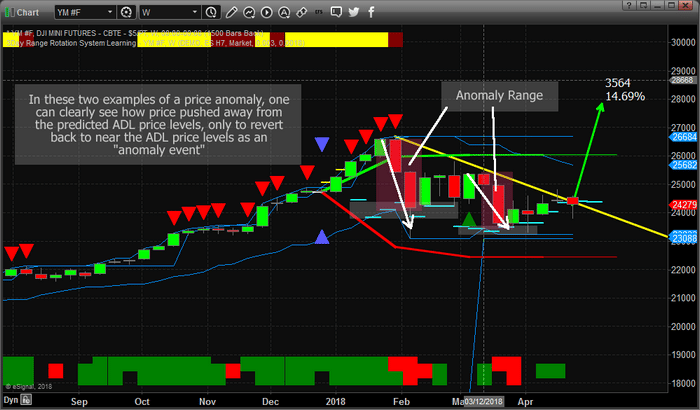


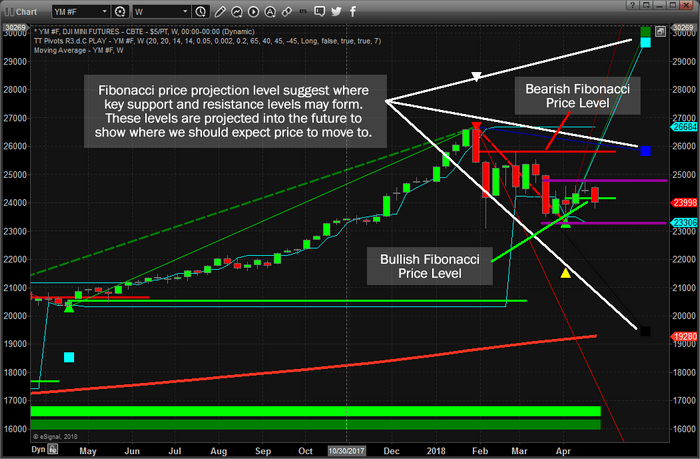

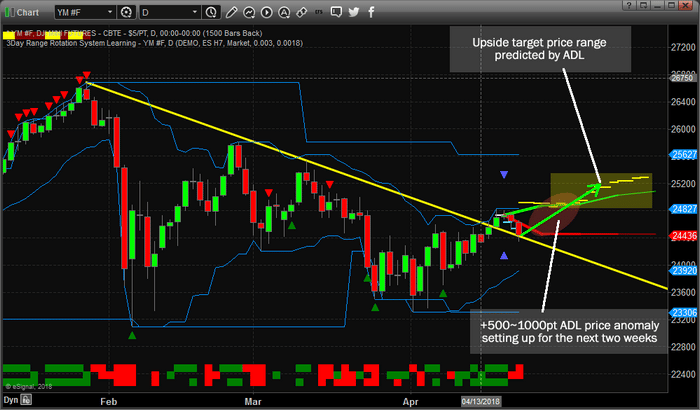 We’ll close our this research with a YM Weekly chart to more clearly illustrate what the ADL price modeling system is suggesting for the extended future. Remember, these ADL predicted price targets go all the way forward to the end of July, 2018 – nearly 3 months into the future. Yes, we can attempt to see well into the future with the ADL price modeling system and as long as we continue to refresh our analysis for newer, more recent ADL events, we should be able to accurately map out the future of almost any market.