With very strong US jobs data hitting the news wires this morning and an incredible upside price swing overnight because of expectations and hope of a US/China trade deal in the works, we were not surprised by the downside rotation in the US stock market this morning. As we’ve been warning for the past 3+ months, we expect the US stock markets to trade very narrowly headed into the US mid-term elections and begin a breakout upside price move sometime between November 8 and November 12.
The news events, recently, and the relatively strong earnings data suggest the US stock market and economy should continue an upward bias throughout most of the end of 2018 and into early 2019. If President Trump were to secure a favorable trade deal with China, we expect the US stock market could surge 4~8% over a few days/weeks on that news alone. Our opinion is that few traders want to hold any positions over the weekend headed into a potentially tumultuous election cycle next week.
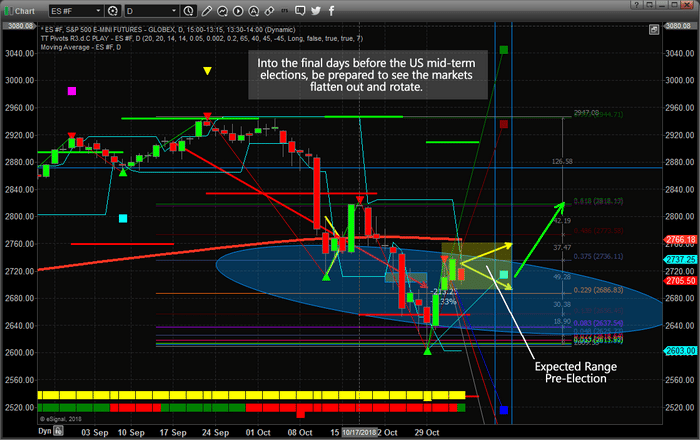
This Daily ES chart illustrates where we believe the price will stay before the US elections (The YELLOW arrows/box drawn on the chart). This range is roughly from 2690 to 2750 on the ES. We’ve also drawn two thin blue vertical lines that represent Nov 8 and Nov 12 – the dates which we expect the markets to establish a true price bottom and begin an upward price rally from. Additionally, we are displaying what we call “True Fibonacci Levels” on this chart in reference to key price target levels. We believe the initial upside price target will focus on the 2816 price level in the ES, then potentially push higher to the 2942 range. These True Fibonacci Levels are derived from our modeling systems calculations of Fibonacci Number Sequence relationships.
Additionally, the October 12th date aligns with Fibonacci Time/Price cycles as a key inflection point in price. Therefore, we strongly believe skilled traders should begin taking strategic positions in select markets/stocks prior to this point as we believe the price could move in a very dramatic and aggressive form after November 12th.
Please take a minute to visit our website to learn how we can help you stay ahead of these market moves. Visit www.TheTechnicalTraders.com and see just how easy and inexpensive it is to have a team of dedicated professionals working to help you become a better trader and deliver proprietary research, daily videos and more.
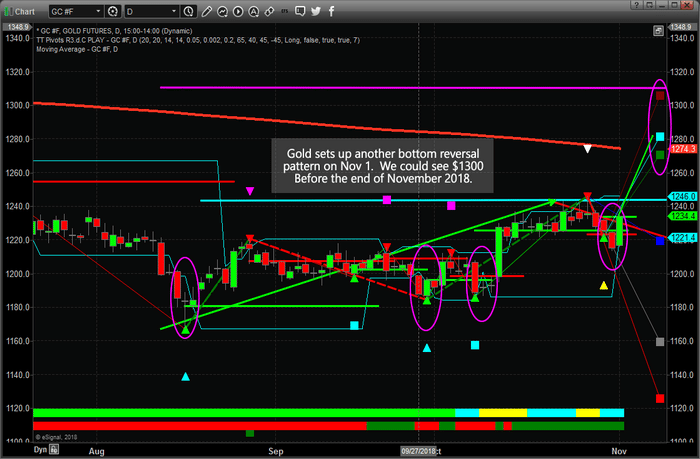
If you’ve been following our research, you already know how accurately we’ve called these past market moves. Pay attention to how the rest of this year plays out and see how accurate our predictions really are. We’ve called the moves in Oil, Gold, Technology, China/Asia, the US stock market and many more weeks or months before these moves happened. Isn’t it time you invested in your future success too?
Chris Vermeulen