Our researchers spent a good portion of the holiday weekend researching a continued capital shift that is taking place in the US equities markets and throughout the global market.  Over the past 20+ months, a massive capital shift has taken place where investment capital fled weaker global economies and rushed into the US stock market because of a tremendous value opportunity that existed at that time.  Technology, Biotech and many others equity sectors were skyrocketing – in some cases 2~3% a month.  This ROI, along with the benefit of a stronger US Dollar, created a very unique environment where foreign capital could rush into the US markets, land pretty much anywhere and become relatively safe from foreign risks/devaluation.

Yet, over the past 45+ days, the US equity markets have declined dramatically and our researchers wanted to investigate if this capital shift dynamic had abated or ended recently.  This could be a very important question for investors to understand because the most to safety for capital is one of the most critical functions of capital preservation.

Capital operates under the premise that certain risks will be allowed as long as ROI is sufficient to offset those risks.  Capital tends to move away from hostile environments and towards environments that are stable and capable of generating returns with limited risks.  The only time capital rushes towards high-risk returns is when managers become greedy with their client’s money.  Yes, these types of returns can be tremendous when there is little risk, but these high-risk returns often result in “unknowns” that can be catastrophic for investors (think Greece or Puerto Rico).  Overall, far greater capital is deployed in more traditional investment sources that are lower risk and produce lower ROI as a means of supporting long term objectives.

The question before our research team is “has the capital shift that we believe has taken place over the past 18+ months changed direction or changed focus and how can we profit from this dynamic?”  It is our believe that capital is still searching for the safest and most capable ROI on the planet in comparison to global economic and currency risks.  Has the economic environment changed so much that capital is now searching for new sources of safety and return?

Our researchers focused on four key aspects of the global economy in an attempt to answer these questions :

_  China/Asia Future Economic Expectations/Realities

_  Europe/EU Future Economic Expectations/Realities

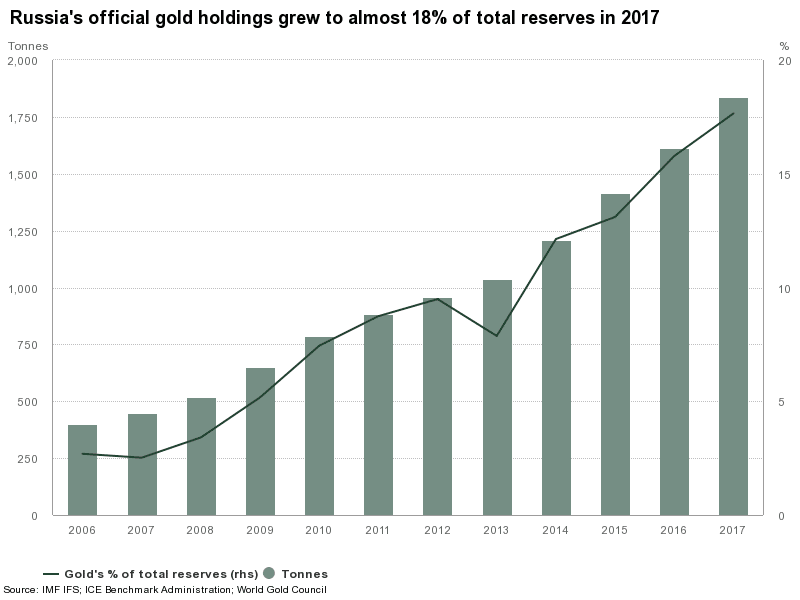
_  Arab/Russia Future Economic Expectations/Realities

_  US/North America Future Economic Expectations/Realities


By focusing on these different regions of economic power and capital, we believe we can attempt to develop a better understanding of where capital will find suitable investment environments and stability over the next 12 to 18+ months and better understand how capital will be deployed in the future.

The new cycle is full of concerning headlines from all over the planet.  Russia and Ukraine appear to be headed into a conflict.  Turkey and Saudi Arabia have already entered a war (of sorts) over the Jamal Khashoggi murder with could conflate into broader issues for Iran, Syria, Russia, the US, and many other nations.  China is experiencing an economic slowdown that could result in a populous uprising if conditions don’t improve soon – as we are starting to see in Hong Kong.  Regions of Europe are already cracking under a severe banking/credit risk scenario with little to no hope of support from the EU.  And thousands of migrants are rushing the US border attempting to flood into the US illegally as they feel it is their right to invade a nation that is offering entitlements to all invaders.  If we step back and really consider all of this, the world certainly appears to be unraveling before our very eyes.  The fabric of society that was in place 20+ years ago seems to be tearing apart more and more each second.

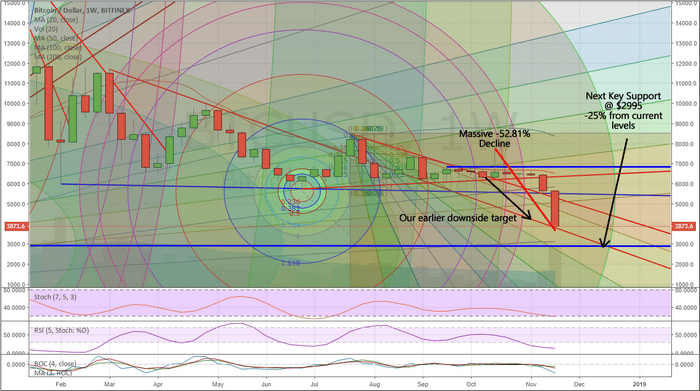
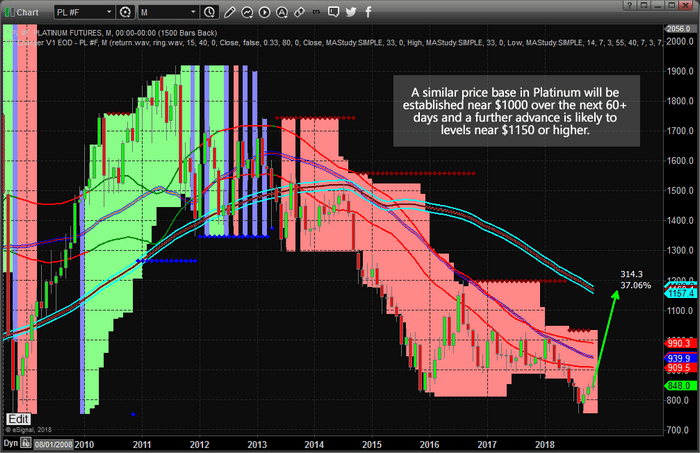
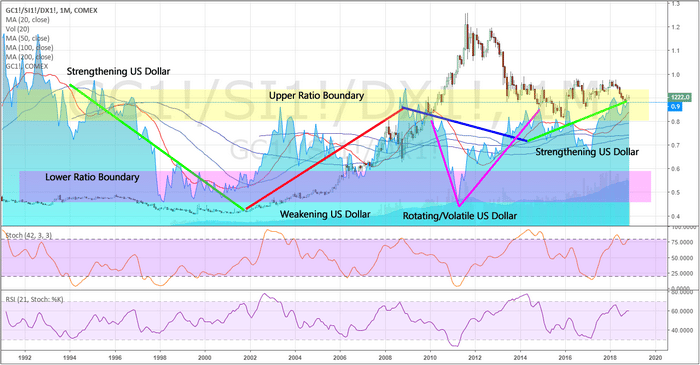
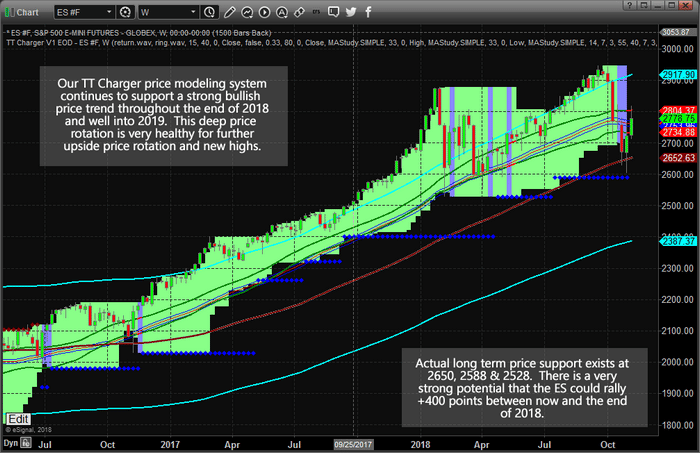
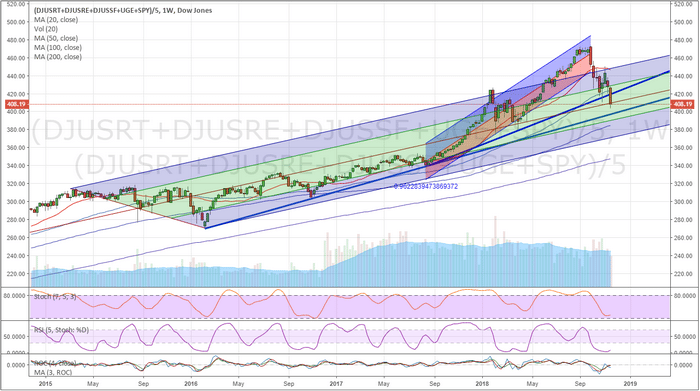
As long as the US Dollar continues to strengthen above $92 and Gold/Silver continue to form a deep price base (as we recently suggested here: https://www.thetechnicaltraders.com/metals-moving-in-unison-for-a-massive-price-advance-part-ii/) we believe the US equity markets will quickly find support near current lows and attempt a new price rally that should push prices back towards new price highs before the end of January 2019.  Take a look at this Weekly chart of our Custom US Equity Market Composite Index.

Although the recent price decline has been dramatic and concerning, the reality of this price correction is that it has dropped to the middle level of longer-term support originating from the 2012 to 2016 price range.  When we take a very long-term view of the markets, the middle (green area) of price rotation has continued to act as resistance and support for price over the past 2~3 years.  In 2015~2017, this area acted as resistance.  In late 2017 and early 2018, the US equity markets began a dramatic acceleration that resulted in this same area becoming support for the price (seen in Feb 2018).  Overall, this recent price decline is likely a result of the US Fed prompting longer-term concerns and the US elections prompting some levels of uncertainty in the markets.

How will investors digest the remaining 30+ trading days for 2018 and early 2019 in light of this retracement and new price valuation?  Will these price levels be viewed as advantageous buy levels of will further pricing concerns prevent investors from pulling the trigger?  We’ll continue our research and attempt to more clearly illustrate our findings in the next part of this multi-part research article.  Right now, think about how the global markets are set for the next 30~90 days of trading action and think about what you believe will be the likely outcome of the new year (the end of the Christmas season, the start of a new year and the continued shifting global economic headlines).

We believe 2019 and 2020 will be incredible years for skilled traders with big price swings and fantastic opportunities for traders.  Please take a minute to visit www.TheTechnicalTraders.com to learn about our research team and how we can assist you in finding great trades.  We have been calling these market moves with incredible accuracy over the past 18+ months because of our proprietary research tools and skilled researchers.  Try our services and see for yourself how we can help you become a better trader. Stay Tuned for Part II

Chris Vermeulen

Crypto enthusiasts were crushed over the Thanksgiving holiday when a fight over Bitcoin Cash and very thin liquidity prompted a massive price breakdown from recent highs.  This downside move reflects a true price breakdown where Bitcoin bulls have to rethink their future strategies.

Back in October 2018, we warned that price MUST rally above the support level near $6986 in order for any future upside advance to take hold.  The following week, we saw a massive price rally that lasted only a few hours and trailed off back below the $6986 support level.  While we waited to see if any future price move would prompt a rally above this level, the Bitcoin price levels continued to congest.

The breakdown move over the past two weeks has been massive and hit our first target of $4000 as expected.  From the recent highs, the downside move totals -52.81% so far.  Our research team believes true support is near $2995 – a further -25% lower from current levels.  This equates to a massive -65.85% decline in the past 40+ days.

There may be an opportunity for fresh long trades near the end of this year.  We’ll alert you to any opportunities we see in the crypto-currencies as they set up.  Right now, we would warn Crypto longs and enthusiasts to be very cautious of any further breakdowns in price.  If the $2995 level does not hold as support, we could very easily the $1860 level before the end of January 2019.

Please visit www.TheTechnicalTraders.com to learn more about how we can help you find and execute better trades.  Our research team and proprietary price modeling systems continue to deliver success for our clients and members.  We target selected sectors and trades for our members and deliver daily video analysis of most of the major markets to help our members stay ahead of market moves.  Learn how we can help you find greater success in 2019 and beyond.

Chris Vermeulen

As we continue to explore our custom research into the metals markets and our presumption that the metals markets are poised for a massive price rally over the next few months/years, we pick up this second part of our multi-part article illustrating our research work and conclusions.  If you missed the first part of this article, please take a minute to review it by before continuing further (Link to Part I).

We left off in Part I showing a number of supply and demand components and briefly highlighting our newest research using a custom Gold/Silver/US Dollar ratio index.  Our attempt at finding anything new that could help us determine the future outcome of the metals markets and to either support or deny our future expectations that the metals markets are poised for a massive price advance was at stake.  This new research would either help to confirm our analysis or completely blow it out of the water with new data.  Let’s continue where we left off and start by showing even more data related to our new custom metals ratio.

This Monthly chart showing our custom gold pricing ratio and the correlative price of Gold illustrates a number of key features.  If you remember from Part I, the current ratio level (the Blue Area chart) is near the top of the Upper Boundary level (0.80 or higher).  Whenever the ratio level enters this Upper Boundary level, it typically only stays there briefly before falling towards the Lower Boundary level.  We’ve highlighted what we believe to be key elements of this type of ratio/price reaction.  On the chart, below, we’ve highlighted every major ratio level decline from near the Upper Boundary level and the associated reaction to the price of Gold as well as the indicator reaction near the bottom of the chart.  With each instance, we can clearly see that price advanced, in some cases dramatically, as the ratio level declined from the Upper Boundary towards the Lower Boundary.  The biggest move occurred between 2002 and 2012 where two of these ratio rotations occurred.

Near the right edge of this chart, we can see that the ratio levels have already started to decline from recent peaks. We believe this could this be the start of a broader ratio level decrease that prompts a massive price rally in the metals markets.  We believe this ratio swing could be accelerated by rotation and volatility within the US Dollar price and increased demand from Investors over the next 4~6 months.

Again, this Monthly chart paints a very big picture – planning many years in advance of this move.  We believe this new metals market rally is setting up to be something that Gold traders have been thinking about for decades – a potential of Gold reaching $5000 or higher in a dramatic price rally that correlates with broader global market events.  We don’t know what those events are at the moment, but we could certainly guess as to the nature of their origination.


Our research supports our opinion that the metals markets are dramatically underpriced in relation to global risk and potential future events.  The only thing, in our opinion, that could prevent a new price rally from forming over the next 6+ months is a continued malaise in investor sentiment or continued strength in the US Dollar.  If either of these two components continues for any length of time, the price of Gold and our custom ratio will likely continue to base near current levels or slightly lower.

Our expectation is that currency issues as well as rotation or some weakness in the US Dollar will likely prompt an impulse rally in Gold where prices rally above $1300 before April 2019 and form a price base for the rest of the expected rally.  Once the conditions ripen within the market and investors begin to pile into the long gold trade, the ratio will reflect this move and demand from the investor side will drive prices higher with the expectation that some type of crisis event cycle is about to unfold.

This next Monthly Gold chart shows what we believe will be the initial impulse move higher (towards and above $1300) before the rally really starts to gain speed.  A rotation above $1300 would establish a new price base near or above recent highs and start the accumulation by Investors – driving the demand side of the equation.  This move would also push the ratio a bit lower in support of our expectations.

This Monthly Silver chart clearly shows the extended opportunity for skilled investors ahead of this move.  We believe Silver is one of the most undervalued investments on the planet right now and that our analysis supports a longer-term view that Silver could reach the $40 to $50 level very quickly if the events we suspect are unfolding actually do unfold as we are suggesting.  This would equate to a 280%+ swing in price before an even bigger move higher unfolds.

This Monthly Platinum chart shows the pricing pressures over the past 5+ years that have plagued the metals markets.  If you were to take a look at the custom metals ratio chart near the top of this article, you would see that this pricing pressure is related to a number of key factors – most of which relate to lack of investor demand and lack of true price exploration (rotation of the ratio levels).  In other words, price levels in the metals markets have been operating in a very narrow “void” or any real price rotation or exploration.  We believe this environment is about to end and we believe the continued “price malaise” will end with a massive impulse move higher.

You can see from this chart we expect Platinum to rally to near $1150~1200 in the initial impulse move, then form a base before a further price advance.

In conclusion, if our longer-term analysis is correct and prices do begin to move higher with a shift in Investor sentiment and a renewed pricing advance supported by US Dollar or foreign currency weakness, our researchers believe $2456 and $3016 levels in Gold could become prime upside price targets.  To put that in relative terms, this would be a 200% to 246% price advance in Gold.  One could expect Silver to advance to near $40 and $50 which would be a 278% to 348% price advance.  Depending on the scope and scale of the event cycle that unfolds, these levels could be considered conservative targets for upward price moves.

Please keep in mind that this research post is very long-term in scope and expectations.  This is not going to happen next week or even over a few weeks.  This is going to be years in the making and it could change how you adapt your investment styles over the next few years.  Our efforts to bring this advanced research to you is our attempt to alert you to a pattern that is unfolding in the metals markets that could provide you with a huge opportunity for future success.  Once this pattern starts to unfold further, expect the global stock markets to start reacting to this new “fear element” and prepare to adjust your trading styles accordingly.

We believe you won’t find a better team of researchers, traders and analysts than with www.TheTechnicalTraders.com. Our proprietary research, price modeling systems, and predictive analysis tools help to keep our members well ahead of the market with each turn.

Chris Vermeulen

Are the metals markets ending a price correction in unison and preparing for a massive price advance?  This is the question we asked our research team to investigate and their findings may help skilled traders identify great opportunities in the future.  This multi-part research article will share our most recent opinion about the metals markets as well as share some critical new data that can shed some light into what we believe will become a massive upside price rally in the metals markets. Let’s get into the data.

When one considers the global demand for Gold as a hedge against economic crisis events and the continued advancement in gold reserves for China and Russia, one has to consider the supply side issues that are a result of central banks global demand.  Even though global production of Gold is near an all-time high, the demand from foreign nations and central banks are also near all-time highs.  This correlation creates a demand-side consumption that offsets supply and, in some ways limits, consumer, retail and technology suppliers.

Our researchers focused on this aspect of the supply/demand equation when trying to analyze recent metals price action in correlation to disruptions that could occur in the markets.  For example, increased central bank buying/hoarding of gold could dramatically result in prices spiking.  Foreign market disruptions in supply could also send prices spiking.  Global conflicts and or continued trade issues could send metals prices skyrocketing.  Anything to do with the supply side for Gold could send prices higher.  At least this is the conclusion of our research team at this time.

Russia has continued to build its gold reserves throughout the past 10+ years.  Should Russia and other nations continue to absorb supply at these levels, one could easily argue that price declines in the metals markets are unusual.

Demand for gold is varied and includes Jewelry, Technology, Investment, and Central Banks.  We can see from this data that Jewelry and Investment make up nearly 65~70% of total demand every quarter.  Jewelry, in many nations, is a secondary form of investment for many people.  Unlike in the US, gold is typically sold at 22K levels in much of Asia and at 24K levels throughout much of the Arab world.  Individuals can purchase these high-quality jewelry items not only to wear but also as a capital investment.  People in these countries are able to resell this high-quality gold to jewelers and others at near spot price whenever they need extra cash.

We can see from the chart, below, that demand is moderately weaker over the past 2 years, but still near all-time highs.  Consider, for a moment, what a moderate supply-side disruption or pricing advance would do to the demand side of these levels?

Take a look at the increase in Investment demand in 2010 through 2012 in relation to today.  Also, pay attention to the huge Investment increase in demand in Q1 of 2016 and the correlative price advance that occurred as demand shot higher.  One key factor for price advance is that Investment demand increases dramatically as a driving force for price increases.  Because of this, we would watch for investment demand to increase dramatically over the next 4~6+ months which would indicate that a continued price advancement is expected.

Our researchers dug further into price history with a dynamic new tool that allows us to measure and gauge price rotation in comparison to a number of key factors.  The purpose of this exercise was to identify the price and relationship boundaries of Gold, Silver and the US Dollar as these price variances correlate to the price advance and decline of Gold.  Our hope was that we would identify some very important new aspect to the relationships of these markets as related to the future movement of the metals markets.  Our researchers focused on these key relationship and found the following.

This first chart highlighting our custom Gold/Silver/US Dollar ratio (the blue area chart) in comparison to the historical price of Gold is actually very interesting.  First, we highlighted the general trend direction of the US Dollar – showing Strengthening, Weakening and Rotating trends.  Next, we highlighted the Upper and Lower boundaries of our custom price ratio to highlight key areas where the ratio changed direction or where prices initiated new or reversed price trends.  It is fairly easy to see the price of Gold either initiated new trends or changed price trend at or near these Upper and Lower boundary levels.  It is also fairly easy to see the huge price advancement between 2004 and 2011 occurred within a Weak and Rotating US Dollar environment.  Additionally, within this same time span, we were able to witness multiple boundary rotations and different Gold price activity types as the US Dollar shifted from a downward price trend to a very volatile/rotating price trend (2009~2015).

In all reality, the biggest Gold price rally and decline happened between 2009~2015 at a time when the US Dollar was rotating and at a time when the global markets were experiencing a massive credit/market event; including much of the subsequent market recovery event.  The massive ratio trough occurred in April 2011; at a time when the US Dollar reached a fresh new low and when the US stock markets were recovering quite well.

Taking a look at the most recent 4~5 years on this chart, two critical items came to our attention; first, the lows reached in 2015 and the recent lows in 2018 both occurred while the custom ratio levels were within the Upper Boundary area.  We have not seen the ratio move into the Lower Boundary since 2011.  What causes the ratio to move toward this level and what are the correlations that we can ascertain from further research using this new tool?  Could this new tool provide any real insight into the future price of Gold, Silver, and other metals?

We’ll continue our research in the second part of this article to show you why we believe the metals markets are set for a massive price rally and why we believe this one will be completely different than anything we’ve seen in the past 20 years.

We believe you won’t find a better team of researchers, traders and analysts than with www.TheTechnicalTraders.com. Our proprietary research, price modeling systems, and predictive analysis tools help to keep our members well ahead of the market with each turn.

Chris Vermeulen

An incredible really/breakout pattern is setting up in the US Stock Market and US Indexes currently that many traders/investors may not be paying attention to.  This is such an incredible opportunity for traders, we are alerting you to this setup and what we expect to be the outcome based on our proprietary predictive price modeling and analysis tools.

Almost without fail, the end of each year experiences a “Christmas Rally” that results in a moderate bullish price bias for most of the 4th quarter.  Over the past 17 years, 76.47% of each Q4 period resulted in an average +1049.85 pts in the YM (Dow Futures Contract).  Only 23.59% of the time did the YM decline on an average of about -1039.75 pts.  This data helps us to understand that downside price rotation in the Q4 (Christmas Rally months) is possible, but unlikely by a 4:1 ratio.  It also helps us to understand that our expectations of a massive price rally, much greater than the average +1049 pts, may be a very big play for traders.

We wrote about our predictive modeling system’s expectations on September 17, 2018, https://www.thetechnicaltraders.com/predictive-trading-model-suggests-falling-stock-prices-us-elections/, where we predicted a market top occurring near September 21, followed by a -5~8% price correction, followed by an Ultimate Bottom setup near or after November 8~12.  This Ultimate Bottom setup was predicted by our ADL predictive price modeling tool and suggested a bottom in price would prompt a massive upside rally where new market highs will be reached in early 2019 or before.  Our Fibonacci price modeling tool is now telling us the breakout move is imminent and we are alerting all our followers to be prepared for some incredible trading opportunities between now and Jan 1, 2019.

Let’s take a look at some Daily charts that support our conclusions and warn of downside risk levels.  Within each of the two following charts, you will notice similarities.  The markets are setting up in a similar pattern that clearly illustrates how price wants to react to a positive price impulse and where support is located.  We believe any downside risk, at this time, would be from a dramatic external news event.  In other words, we believe current support will hold and we believe the upside price bias predicted by our ADL price modeling system will become the ultimate outcome.

This first chart is a Daily YM chart showing our proprietary Fibonacci price modeling system.  Notice the upside and downside projected price targets on the right side of the chart.  When these price targets are at wide disparities, as they are now, it usually indicates that the markets are setting up for a bigger breakout move.  Additionally, it is easy to see the YELLOW Support Zone and the Key Price Support level on this chart.  Based on Fibonacci Price Theory, the YM price trend is already Bullish and within a minor price pullback.  As long as the Key Price Support level is not breached, the trend will stay Bullish.

Please pay special attention to the upside price targets near 27,500 to 28,500 (nearly 3000 pts higher).  We believe the upside price trend predicted by our ADL price modeling system will support a price move up to near these levels before or shortly after Jan 1, 2019.  We also believe any downside price risk will be contained with the BLUE Key Price Support level.

This next Daily chart is of the Transportation Index (TRAN).  We are certain you will notice the similarities between the two charts and our Fibonacci Price Modeling System.  The primary difference in this chart vs. the YM chart is where the Key Price Support level is located on the price axis of the chart.  Overall, the prediction and technical components of these two charts are similar.  As long as the Key Price Support level is holding, the upside price bias should drive an upward price breakout over the next few weeks and months.

As traders, we want to understand and identify where opportunities exist, when they become advantageous and when we need to act upon them.  Our research team believes the next 5~14 days will present incredible opportunities for skilled traders to identify and setup new trades in certain sectors of the market based on this analysis and our predictions of new price highs within 2+ months.

We’ve seen a similar pattern play out back in March and April of 2018, just before the YM rallied 3400+ pts.  If a similar price breakout occurs as we are suggesting, the 30,000 price level in the YM suddenly becomes a very valid price target.

If you like our analysis and research and want to know how we can help you find and execute better trades, please take a minute to visit www.TheTechnicalTraders.com. Our proprietary price modeling tools and our skilled team of traders and researchers attempt to bring you the very best and timely market research you can find.  Take a minute to read our September 17th research post to understand just how incredible our research really is.   Ask yourself this question, do you know of anyone else that can accurately predict stock market moves 4~6 months in advance?  Take a few minutes to learn how we can help you navigate these incredible market opportunities and find new success.

Chris Vermeulen

The recent upswing in NG prices has been an incredible trade for many, yet we believe a top is now forming in Natural Gas that could catch many traders by surprise.  The recent upside gap in price and upward price volatility would normally not concern long traders.  They would likely view this as a tremendous success for their long NG positions, yet we believe this move is about to come to a dramatic end – fairly quickly.

Our predictive price modeling systems are suggesting that Natural Gas may be setting up a topping pattern on weakness near our Fibonacci price target levels.  As you can see from this Daily NG chart, the upside price gap recently has prompted a big upside price move that ended near our Fibonacci price target levels marked as “Resistance” on the right side of this chart.  Normally, when the price reaches these levels, or near these levels, we expect price resistance to become a dominant factor.  Additionally, we need to highlight the potential for the higher Fibonacci target, near $4.00-4.15, to be reached on an extended move higher.  If this were to happen, we believe price would be strongly overextended and would likely rotate lower towards the $3.20 level rather quickly.

Support can be found near $2.60 to $2.80 on this chart and we believe the new highs, near $3.80, will likely extend the Fibonacci support targets a bit lower as price rotates to form the top pattern we are expecting.

It is a bit too early to actually “call a top” in Natural Gas at the moment, but we believe we are very near to setting up and forming a top reversal pattern in NG and are alerting our followers and members to this setup before it happens.  We believe a price top will continue to setup over the next week or so before a new downward price trend pushes prices back towards the $2.50 level where support will likely hold.

Historically, the month of November has shown a moderately positive outcome over the past 25 years (resulting in a +0.59 average upside bias with a nearly 52% probability ratio).  As of right now, NG is +0.46 for the November 2018 – indicating very limited upside range still exists.

For the month of December, NG historically results in a negative outcome (resulting in a -$2.61 average downside price bias with a nearly 60% probability ratio).  For the month of January, NG has shown a decidedly negative price outcome (resulting in a -$6.69 average downside price bias with a nearly 71% probability ratio).  Obviously, assuming these 25-year price studies are correct and their probability factors continue to be accurate, the upside move in Natural Gas may be very near a top and traders need to be aware of the potential for a quick and dramatic price trend reversal.

If you believe this type of research and analysis can assist you in finding and executing better trades, take a few minutes to learn about our team of researchers and how we can help you stay ahead of these market moves – visit www.TheTechnicalTraders.com today.  Our team of professional researchers and traders has been developing proprietary price modeling and analysis tools for decades and we believe we have some of the best predictive modeling systems on the planet.  Watch how this move in NG plays out to see how well we can help you find better trades and visit www.TheTechnicalTraders.com/FreeResearch/ to read more of our public research posts.

Chris Vermeulen

We are pleased to bring this new analysis to everyone’s attention because we strongly believe the bears and the shorts are in for a wild ride throughout the rest of 2018.  Our research team, at www.TheTechnicalTraders.com, have gone over the chart using our advanced predictive and price modeling tools and we are going to show you why we believe the ES could rally +400 points or more before the end of 2018 – leaving the shorts/bears wishing they had read this research.

Before we get too carried away, we need to highlight one thing regarding the current price setup we are illustrating with these charts.  A “Price Anomaly” has setup because of this deep October 2018 price correction.  This move has resulted in many industry researchers calling for further downside price action as they fear the beginning of a far deeper price decline in the future.  We believe this conclusion is absolutely false.  The price anomaly is the result of effective price rotation within volatility ranges that are acceptable to continue the current upward/bullish price trend and our modeling/research applications are suggesting we are about to see a +400 point rally in the ES (+11% or more; likely targeting 3100 or higher).

Let’s get into the charts and the data.

First, our TT Charger price modeling tool on an ES Weekly chart shows how volatility and price work hand-in-hand to create acceptable ranges of price rotation while still maintaining price trends.  At this point, on the hard right edge of the chart, we can see the Oct 2018 deep price rotation fell to near our support levels (near 2650 & 2588) before rebounding higher over the past two weeks.  Within this type of Price Anomaly setup, it is not uncommon for the price to “over-shoot” the targets before rebounding back towards the target levels.

This chart showing out Adaptive Dynamic Learning price modeling system highlights the “Price Anomaly” event as well as highlights the upside price ranges/targets that we are expecting to play out over the next few months.  Please pay special attention to the Aug/Sept 2018 price targets below 2600 that represent the Price Anomaly.  When our predictive modeling systems identify outliers like this, it usually means there is a potential for a price anomaly event to occur.  We call it a price anomaly event because the price may rotate and target these outlier areas in a broader price trend (in this case higher).  This type of setup creates an incredible opportunity for skilled traders to trade the reversion price trend, higher in this case, after the price anomaly event is completed.

As you can see from this chart, we are expecting the price to recover quickly to near 2900 with a strong potential for higher prices in early 2019.

Before we continue, we want to share some data that supports our research and to alert you as to why we believe this upside price move could be dramatic and very profitable for skilled traders.  One of the tools we use is a Probability Factoring Model while helps us understand what to expect in future price periods (Weeks, Months, Quarters).  This tool helps us to understand if there is a predominant bias in price over a certain period of time or not.  For example, it identified that October and November are typically very weak for Crude Oil and alerted us to the potential of falling oil prices in late September 2018.  Right now, these are the results for November and December 2018.


===================================================

Analysis for the month = 11

– Total Monthly Sum : 484.75 across 22 bars

——————————————–

– Largest Monthly POS : 79 NEG -119.75

– Total Monthly NEG : -266.5 across 5 bars – Avg = -53.30

– Total Monthly POS : 751.25 across 17 bars – Avg = 44.19


===================================================

Analysis for the month = 12

– Total Monthly Sum : 420.75 across 21 bars

——————————————–

– Largest Monthly POS : 93.25 NEG -57

– Total Monthly NEG : -121.5 across 4 bars – Avg = -30.38

– Total Monthly POS : 542.25 across 17 bars – Avg = 31.90


By reviewing this analysis, we can see that for the month of November 2018, the bias is clearly positive (17 bars positive vs. 5 negative; 3:1 ratio) and the upside price activity clearly outperforms the downside price activity (+751.25 vs. -266.50).  Resulting in a +484.75 upside bias result.  For December 2018, the results are equally impressive.  A 4:1 upside bias ratio with a +420.75 upside bias result.

Please keep in mind that these results DO NOT mean the ES is going to climb 900 points between now and the end of the year.  What we can pull from these results is that there is a clear upside price bias for both months and that we should expect, roughly, at least 50% of this pricing bias to materialize.  This means about 200~220 points in November and about 180~200 points in December – totaling about 400+ points overall.  Anything beyond that would be considered an extended price move higher based on this research.

Additionally, we would like to disclose that these analysis tools do not guarantee anything in terms of future price activity.  We can’t attempt to guarantee any future price moves or activity based on our research.  We simply attempt to use our proprietary tools to assist our members and followers in an attempt to stay ahead of these market moves so we can profit from them.

It is our opinion that the markets are poised for an incredible upside price advance from the correlative and combined research presented by our proprietary price modeling and adaptive learning systems.  It is hard to argue the facts that the price anomaly predicted this downside price rotation when we called this move on September 17th (nearly 45 days before it actually happened).  At that time, we called for an “ultimate price bottom” to occur between November 8 and November 12.  After that, we expected the markets to rally into the end of 2018 and well into 2019.  You can read all of our public research by visiting www.TheTechnicalTraders.com/FreeResearch/.

Our members are kept aware of these trends, rotations, cycles, rotations, and setups every day with our Daily videos and other research posts.  Additionally, we issue very clear trade alerts to our members so they can take advantage of timely trading signals for profits.  Get ready for an incredible end to 2018 and a fantastic 2019 by joining our other members in creating greater success at www.TheTechnicalTraders.com.

Chris Vermeulen

Our research team warned of this move in Crude Oil back on October 7, 2018.  At that time, we warned that Oil may follow a historical price pattern, moving dramatically lower and that lows near $65 may become the ultimate bottom for that move.  Here we are with a price below that level and many are asking “where will it go from here?”.

We believe the support near $65, although clearly broken, may eventually become resistance for a future upside price move.  Our proprietary Fibonacci price modeling system is suggesting a new target near $52~53 and we believe this downside move in Oil is far from over at this point.

The current global climate for Oil is that suppliers are pumping more and more oil into the market at a time when, historically, prices should continue to decline.  One of our research tools includes the ability to identify overall bias models for each week, month or quarter.  Historically, Oil is dramatically weaker in the month of November and relatively flat for the month of December.


Analysis for the month of November = 11

  • Total Monthly Sum : -44.52000000000001 across 36 bars


Analysis for the month of December = 12

  • Total Monthly Sum : -0.699999999999922 across 36 bars


We believe the price of oil will continue to drift lower to target the $52~53 Fibonacci support level before attempting to find any real price support.  This equates to an addition -6 to -8% price decline for skilled traders.  We will alert you with a new research post as this downward price move continues or new research becomes available.

We have been calling these types of market moves all year and recently called the top in the US Equity markets nearly 40 days before it happened.  Want to know what we think is going to happen for the rest of 2018 and into early 2019?  Visit www.TheTechnicalTraders.com/FreeResearch/ to read all of our public research posts.  Isn’t it time you invested in a team of researchers and tools to assist you in finding greater trading success?

Chris Vermeulen

Our research team is writing this message to alert all investors and traders of a pending rotation in the US stock market that may happen between now and November 15.  The upside price breakout that is occurring on November 7, the day after the US mid-term elections, is an incredible display of global investor sentiment regarding the GOP success in the Senate and the continued business-friendly expectations originating out of Washington DC.  The move, today, shows how clearly a global capital market shift is still engaged in the US markets and how much global investors are counting on the US to drive ROI and economic growth going forward.

Yet, we feel it is important to urge investors that our modeling systems are still suggesting an ultimate price bottom should be setting up near November 8~15 and that we could still see a bit of downward price rotation over the next few days before this ultimate price bottom completes.  It might be too easy to get caught up in this move, today, and fail to properly understand the price rotation risks that are still active in the time/price horizon.

The ES is currently +48.00 as of the creation of this post (+1.74%).  This is an incredible move higher and the 2790 level becomes critical support for the markets as long as price is able to stay above that level.

The NQ is currently +172.50 (+2.45%) and shows just how clearly investors are piling into technology, healthcare and bio-tech after the US elections.  This is a real vote from investors that they believe President Trump will be able to navigate any issues going forward and that the US economy will continue to push out strong numbers.

Follow our analysis to read our most recent research posts.  We have already positioned our members for this “ultimate bottom” that our predictive modeling systems suggest is in the midst of forming.  We called this entire downside move, bottom rotation and the ultimate bottom pattern setting up near November 12th back on September 17.  If you want to learn how we can help you find and execute better trades, visit www.TheTechnicalTraders.com to learn more.

Chris Vermeulen

Today is the day that most of the world, and certainly all investors/traders, are watching as the US mid-term elections play out.  The news channels and just about everyone is talking about how the results of these elections will potentially change or alter the US and global economies.  Many are prognosticating that a solid red or blue result will drive investor sentiment and capital shifts for many months – which is correct.

Capital is very fluid and actively hunts for the safest and best returns.  Over the past two+ years, our researchers, at www.TheTechnicalTraders.com, have authored countless articles highlighting our belief that a massive capital shift was taking place where global cash was rushing into the US markets after the 2016 Presidential election in an effort to ride the increased share price valuations and a safe-harbor element provided by US equities.  This current election may change this perception a bit based on the final outcome of the elections, but we continue to believe the US equities markets and economy will continue to drive renewed growth and opportunity for at least 3~4 more years.

We, certainly, believe that valuations within certain sectors may become a concern over the next 24 months or so.  Yet, we don’t believe the continue capital shift where cash has been rushing into the US markets and supporting the US Dollar is going to change dramatically with this current election cycle.  We believe the US economy is firing on nearly all cylinders right now and it would take a massive blow to the political, economic and geopolitical landscape to unravel the US economy as it sits currently.

If you’ve been following our research posts, you already know that we called a market bottom near October 15th – yes, a bit early – we get it.  Our proprietary indicators did not foresee the Fed/housing data news that resulted in the extended pricing pressure, lower, to the ultimate lows near October 25th.  Yet, with October behind us and the US mid-term elections playing out, we are certain many of you want to know what we see in the future for the markets.  So, here we go…

The reality is that our analysis has not changed much since we posted, on Sept 17th, our warning that the US stock market would likely experience a 5~8% price correction on or after September 21 and find an ultimate price bottom near November 8~12th before beginning a new upside price rally.  These predictions were made nearly 60 days ago and our analysis has been quite accurate since we made our predictions (yes, we know we missed the extended downside move near October 25).  When you consider the fact that we made these predictions using our proprietary price modeling and adaptive learning systems many months ago, one has to ask the question “if they can predict the markets with this type of accuracy, what else can they predict?”

The answer is quite simple, our analysis models and predictive learning systems are capable of identifying high probability price trends and key “price anomaly” structures before they happen – in some cases, many months before price rotates.  Right now, the most important aspect of our predictive modeling that we urge all of our readers to understand is that an ultimate price bottom should be set up between Nov 8 and Nov 12.  After that time, we expect a new price rally to begin sometime near after Nov 15th.  We will continue to alert our followers with new predictive modeling as these key dates/predictions play out.

Now, let’s take a look at some charts to highlight what we believe will take place over the next few weeks.

This Daily ES (S&P) chart shows our ongoing research and predictions from the week ending Nov 2 and earlier.  At that time, we predicted the future price activity of the ES would stay within the YELLOW ARROWS range headed into the US elections and through our ultimate bottom price date range between Nov 8 and Nov 12.  The vertical thin blue lines highlight those two key dates.  The heavy GREEN LINE (1.618) reflects a key Fibonacci time/price cycle that is occurring on or near Nov 12.  This is a very important indicator that a key price inflection point is likely to drive a massive price rotation near this date.  Our expectations are that price will rotate and likely fall into the BUY ZONE over the next 5+ days, setting up a very important opportunity for skilled traders.  As we move closer to the Nov 8~12 ultimate bottom date, we expect the price to begin a moderate rally higher and eventually breakout to the upside targeting the 2830~2840 level initially.


We expect the Transportation Index (IYT) to mimic the ES, to some degree, and present a new opportunity for skilled traders near the BUY ZONE.  We believe this rotation will be the result of shifting perspectives and expectations as the election data is released.  We’ve read that the true final outcome of the US mid-term elections may not be known for many weeks after the elections are completed, today.  This means we could see an extended period of uncertainty in the US and global markets over the next few weeks.  Additionally, we believe the general outcome will become known on or after November 15th.  Thus, we believe our predictive modeling systems are accurately suggesting the final outcome of this election cycle will result in a positive outcome for the markets – likely a result of the continued strength of the US economy and the expectations of a Christmas Rally unfolding.

This IYT BUY ZONE presents a very clear opportunity for skilled traders to target a 10~15% upside potential if our predictions play out as expected.  Get ready for some great trades to set up over the next 5+ months.

Saving the best for last, this XLF Daily chart (financials) highlights our Adaptive Dynamic Learning (ADL) predictive price modeling system at work.  The interesting thing about this predictive modeling tool is that it can show us where we should expect the price to go well out into the future, but it can also highlight what we call “Price Anomalies” where price MAY rotate in a way that is counter to our predictive models.  When this happens, we consider it an Anomaly where price is moving against predictive norms and, thus, is likely to and may “revert” back to the predicted price levels.

In the XLF example, below, you can see one of our predictive models suggested prices may move in a lower price range than the other predictive models.  This is an “anomaly price range” and the way we interpret it is “if price does rotate lower, near the lower ADL price targets, then this sets up a potential for a very good Reversion Trade where price will attempt to move back towards the higher ADL prices” – roughly +5 to +8% or more.  Therefore, if the price of the XLF falls below the GAP high, on Oct 30, of $25.94, we believe this sets up a very high probability “reversion trade” for a move back to near $26.90 or higher.

By this time, you should be seeing a common theme within our analysis.  If you were paying attention, you will notice that we are suggesting the US equity markets will likely rotate a bit lower over the next 5+ days before finding and setting up for our predicted “ultimate price bottom” near November 8~12.  These predictions allow for skilled traders to set up and position their portfolios for some incredible opportunities headed into the end of 2018.

We believe the outcome of the US mid-term elections may change some perspective of the economy and expectations a bit, but overall the US economy will continue to push along and drive greater expectations of capital growth and improving outcomes.  Our opinion is that a massive price, and potentially global price destructive event, would have to take place to derail the current capital shift that is taking place throughout the planet.  This current capital shift will not last forever, nor should we expect it to continue as it has for the past 24+ months at the same, or similar, levels.  Yet, as of right now, we believe the outcome of the US mid-term elections will not dramatically alter the future pricing and valuation predictions of the US stock market going forward for at least 5+ months.

In closing, if you value the research, analysis and trading signals we share with you, as well as the effort we take to make sure you are keenly aware of our expectations and pricing models, then do yourself and our research team an favor and visit www.TheTechnicalTraders.com and consider subscribing to our services as a member.  Our followers and members have commented that we are “the only team that can accurately predict prices and price rotation many months into the future” and we believe our proprietary predictive modeling tools are the best on the planet.  If you like our research and have profited from our efforts to help you find and execute better trades, then please consider supporting our work by visiting www.TheTechnicalTraders.com.  Get ready to make 2019 a fantastic year with great trades.

Chris Vermeulen