In this short conversation, we talk about Palladium and how it topped last week, and this metal has already dropped 5.5% in value since then.
We also mentioned a few days ago when gold was testing key resistance that traders should expect a correction in gold and mining stocks. This week we already locked in a quick 11% profit with DUST inverse ETF for gold miners and there is likely more selling to come!
Our articles, Technical Trading Mastery book, and 3 Hour Trading Video Course are designed for both traders and investors to explore the tools and techniques that discretionary and algorithmic traders need to profit in today’s competitive markets. Created with the serious trader and investor in mind – whether beginner or professional – our approach will put you on the path to win. Understanding market structure, trend identification, cycle analysis, volatility, volume, when and when to trade, position management, and how to put it all together so that you have a winning edge.
https://thegoldandoilguy.com/wp-content/uploads/2016/06/selloff.jpg485840adminhttp://www.thegoldandoilguy.com/wp-content/uploads/2014/11/tgaoglogo.pngadmin2018-01-30 22:37:052018-01-30 22:37:06Panic Selling On New York Exchange – Get Ready!
How sensible is it to invest in gold? There is no blanket answer to this frequently asked investor question. Much more depends on what you personally expect from an investment in gold.
10 experts give their blunt opinion about investing in Gold. They talk the pros and cons of buying gold, each from their own perspective.
By Chris Vermeulen – Chris Vermeulen is the founder of Technical Traders Ltd. He is an internationally recognized technical analyst, trader, and author of the book: 7 Steps to Win With Logic. and his newsletter www.TheTechnicalTraders.com
There are really only a few short and simple answers to the question why you should consider buying Gold? Investing in Gold provides a hedge against risk, capital preservation and opportunity for returns.
First, Gold, historically, has been and will continue to be the basis of physical wealth for the foreseeable future. Currently, Gold and Silver are relatively low cost compared to other assets offering similar protection. As of right now, Gold and Silver are nearing the lowest price ratio levels, historically, that have existed since 1990. This means, the relationship of the price ratio for Gold and Silver are comparatively low in relationship to how Gold and Silver are priced in peak levels. So, right now is the time to be acquiring Gold and Silver as a low price hedge against another global crisis event or market meltdown.
Second, the fact that the Gold and Silver price ratio is historically very low (meaning they provide a very good hedging opportunity at historically very low price ratio levels) also means that cash can be traded for physical gold with very limited risk and provide an excellent hedge for inflation, global market crisis events and as long term investments. Taking advantage of the current market conditions, one has to be aware that crisis events do exist and present a clear risk to future equity investments. One could decide to risk further capital hedging with options or short positions as risk becomes more evident, but these are inherently more risky than a physical Gold or Silver investment. Physical Gold or Silver, especially rare coins which include greater intrinsic value, can provide real capital, real gains, real hedging of risk and real return – whereas the short positions or options are only valuable if the trade is executed to profit.
Lastly, Gold and Silver are very limited in supply on this planet and, unless society decides that Gold or Silver is absolutely worthless as a substance, will likely continue to increase in value. News that China and Russia are acquiring hundreds of tons of gold each year in preparation for a gold based currency are another set of reasons that you should consider starting your own physical hoard of precious metals. The most important thing for you to understand about owning physical Gold and Silver is that it is a protective investment that can be liquidated or resold at almost any time in the future. It can be traded, held, secured and transported easily. You can physically take possession of your Gold and Silver and be assured that through any banking crisis, global market crisis or major global event, you have enough physical precious metal to operate in a crisis mode and likely attain great wealth/gains in the process.
Think of physical Gold and Silver like an “emergency kit”. You hope you never need it, but when you do need it, you had better be prepared and have set aside some physical holdings before the crisis event happened. Out here in California, we keep “Earthquake Kits” with emergency supplies, water, lanterns, food and other essentials. Well, guess what is included in my Earthquake Kit? Yup – Gold and Silver in proper quantities that I could barter and trade for items that are essential.
The point of my post is that I can think of no reasons why anyone would not want to attain some physical Gold and Silver at today’s prices to protect against known risks, provide a hedge against inflation and crisis events and to protect wealth from what we all know will happen in a crisis event – the banks will close or limit cash availability (think of Greece). So, it is really up to you to determine if and how you want to prepare for what could happen in the future. Will you have your “emergency kit” and be prepared or not?
You can read more expert opinions on what makes gold a sensible investment – Click Here
https://thegoldandoilguy.com/wp-content/uploads/2018/01/goldbars.jpg533800adminhttp://www.thegoldandoilguy.com/wp-content/uploads/2014/11/tgaoglogo.pngadmin2018-01-29 14:31:312018-01-30 07:23:0110 experts give their blunt opinion about investing in Gold
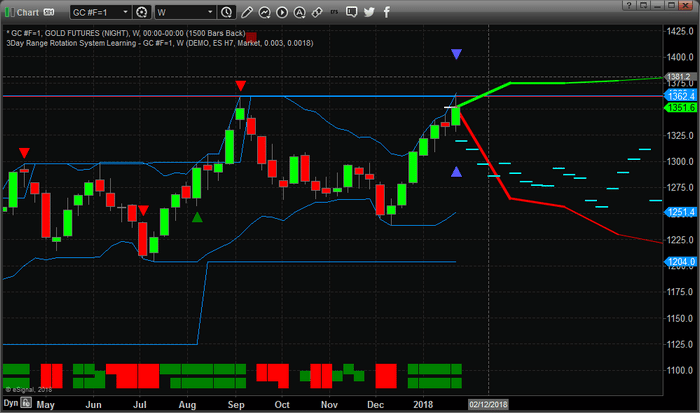
We’ve been warning our members that this move was going to happen and it looks like it is just starting to initiate. The US Dollar and Metals markets are about to rotate in dramatic form over the next few weeks – possibly months. Right now, what we can tell you is that our cycle analysis and adaptive learning models are showing we are in for a very dramatic move in these markets.
This first chart is a GOLD Weekly chart showing our adaptive learning price modeling system and the predicted price activity going forward. One can easily see this weekly double top formation is predicting prices to drop by nearly 5~8% over the next few weeks before basing near the $1250 to $1275 levels. This should be a very clear warning to metals investors that Gold and Silver are setting up for a lower price rotation before the next big move higher.
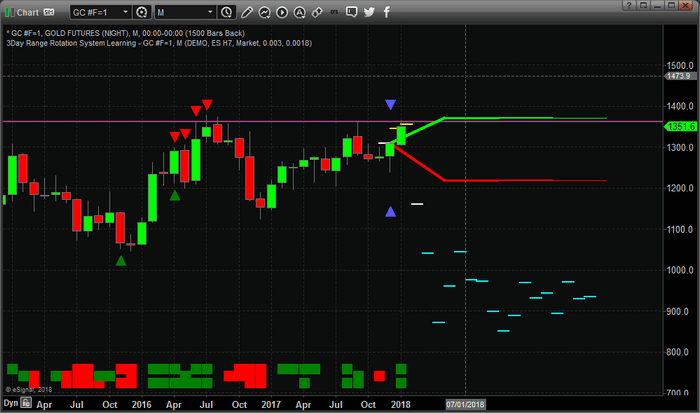
This next chart is a GOLD Monthly chart and one can easily see the adaptive learning modeling system is predicting massively lower prices over the next few months. We would caution our reader that these dramatically lower prices (toward and below $1000) would be an incredible downward move in the metals. It would also indicate that the US and global economies continue to “melt-up” extensively over the next few months. We believe the downside rotation is accurate, yet we don’t believe prices will fall below $1000 within 2~3 months in Gold. Although, one can never accurately predict the future with any degree of certainty.
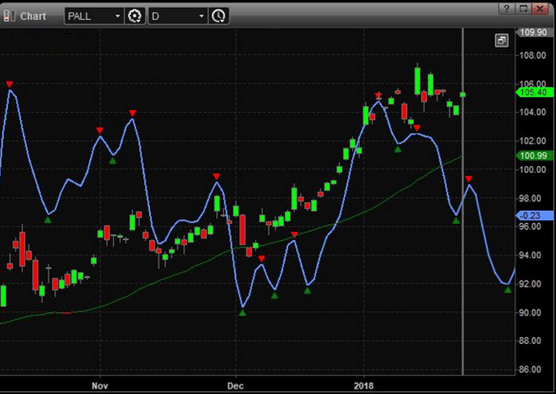
This next chart of a Daily Palladium chart showing our cycle analysis. Once can clearly see the relationship between the cycle levels and price activity. Currently, the cycles are showing use that price is weakening and that a lower price cycle is setting up to drive prices back to near of below $100. All of the metals markets are setting up like this currently and Silver is the only metal that shows the potential for a muted downside price swing.
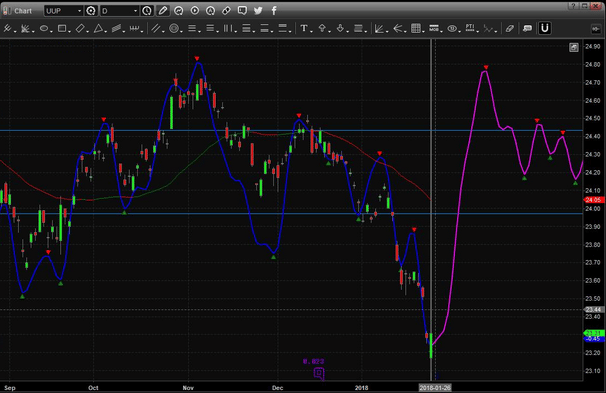
This last chart of a Daily US Dollar cycle analysis chart showing what we believe will be a primary driver of the rotation in the metals markets – the predicted US Dollar price advance. Take a look at this chart and see the aggressive cycle levels that are expected to happen in the immediate future? This type of advancement is usually associated with a fairly dramatic upward price move. We expect this move to mature over the next 2~3 weeks culminating in a general market top formation for the US majors near March 15~19, 2018 – as our earlier research has shown.
You don’t want to miss this move, folks. Visit www.TheTechnicalTraders.com to learn how we can assist you in finding great trades and profiting from these future moves. Please take a few minutes to read some of our research reports from the beginning of 2018 to see how well we’ve been calling these market moves weeks in advance. If you are a GoldBug or you want to find new opportunities in the markets, visit www.TheTechnicalTraders.com to learn how we help you achieve success.
Chris Vermeulen
https://thegoldandoilguy.com/wp-content/uploads/2018/01/Dollar.png393606adminhttp://www.thegoldandoilguy.com/wp-content/uploads/2014/11/tgaoglogo.pngadmin2018-01-28 07:57:042018-01-28 07:57:04Metals and US Dollar Set To Rollover
Our articles, Technical Trading Mastery book, and 3 Hour Trading Video Course are designed for both traders and investors to explore the tools and techniques that discretionary and algorithmic traders need to profit in today’s competitive markets. Created with the serious trader and investor in mind – whether beginner or professional – our approach will put you on the path to win. Understanding market structure, trend identification, cycle analysis, volatility, volume, when and when to trade, position management, and how to put it all together so that you have a winning edge.
https://thegoldandoilguy.com/wp-content/uploads/2016/09/spikeicon.png300399adminhttp://www.thegoldandoilguy.com/wp-content/uploads/2014/11/tgaoglogo.pngadmin2018-01-25 10:24:032018-01-25 10:26:43Bitcoin, Oil, Gold, and SPX Price Prediction Next 5 Days
Are you prepared for the next big move in the metals markets? Would you like to know what to expect in the immediate future that could save you thousands of dollars? Then pay attention to this message as we share something most traders are overlooking right now.
Our research team at Technical Traders Ltd. have spent years developing our skills and financial modeling systems. Right now, many traders are seeing the big upward price swings in the metals as a sign that prices will continue higher. Well, in the long run, they are correct. But right now we believe the metals will roll over and trend lower for the next few weeks setting up for the next leg higher.
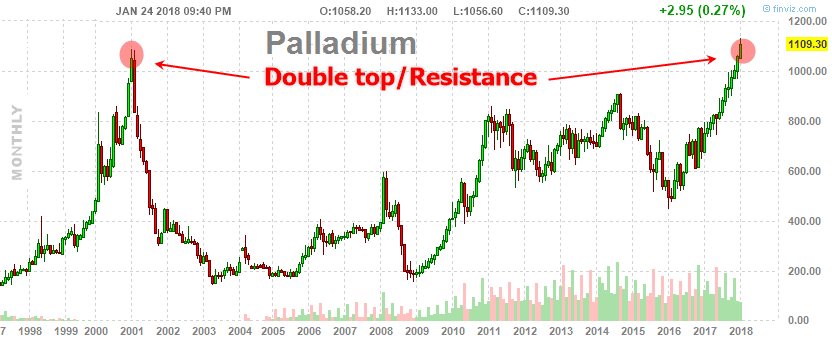
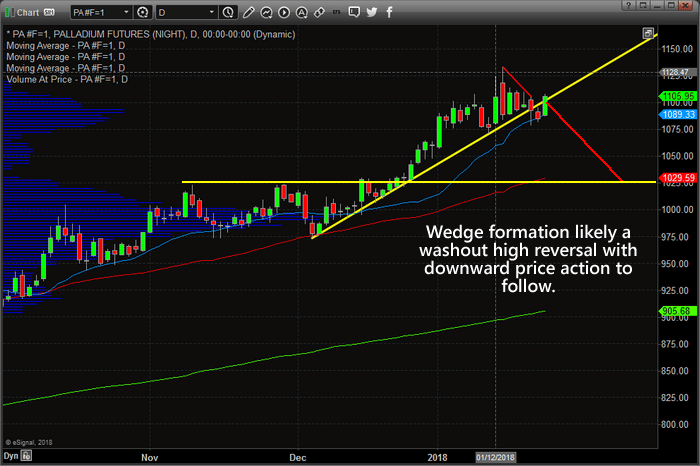
Palladium is a perfect example of this Rollover expectation. Both the current long-term monthly chart shows signs of a massive double top, and the daily chart WEDGE/Pennant formation is likely a washout high rotation pattern that will prompt lower prices over the next few days/weeks.
MONTHLY PALLADIUM CHART
This monthly chart to us is nothing more than a reason for the overbought Palladium market to have a minor pullback before potentially running to new highs. We could see a couple weeks or potentially a few months of weaker prices, but the point here is that price is overbought and at resistance on the long-term chart and imminent pullback is likely to occur for a tradable short or to re-enter after the price has corrected and shows signs of strength for another run higher.
DAILY PALLADIUM CHART
As you can see from this chart, we are expecting a rotation lower based on our modeling systems predictive capabilities that will result in a substantially lower price swing – possibly as much as -8 to -10%. We believe support will be found just above the $1000 price level.
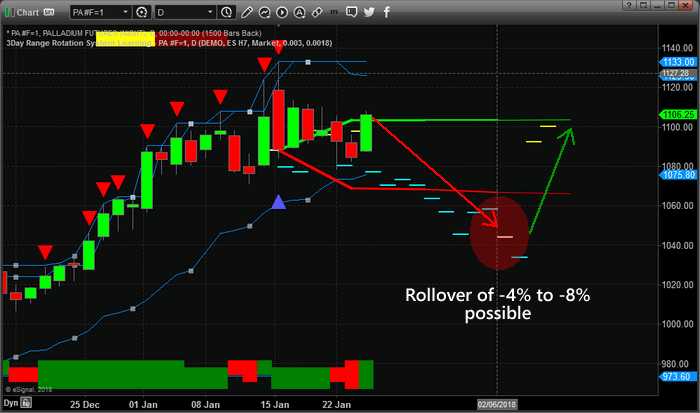
Additionally, our Adaptive Dynamic Learning (ADL) modeling system is designed to scan historical price activity of any chart and find the unique price and technical indicator formations that operate as DNA markers for the price. It then continues to scan for new or repeating DNA markers in the market to determine probable outcomes of the price going forward. In this case, the ADL system is predicting a lower price swing to near $1020 near or after February 8th. After this price contraction, the ADL system is expecting a solid rally to form.
This should be important to all investors because long traders in the metals should wait for this pullback to happen before getting into heavy positions. Our analysis shows we should see a -4 to -8% price pullback within the next week or two before support will be found. Obviously, buying near the lowest point is the objective of trading and we believe the February 5th through February 8th timeframe should provide the optimal bottom rotation period for metals traders.
Would you like to receive daily video analysis of our research for all the major markets as well as continue to receive our advanced research reports? Want to know that the US majors Indexes are going to do tomorrow or next week? Take a minute to investigate www.TheTechnicalTraders.com to learn how we can assist you in your trading. Learn how we called this move in the US Indexes for 2018 and how we can continue to identify market moves before they happen with our proprietary modeling systems.
Chris Vermeulen
https://thegoldandoilguy.com/wp-content/uploads/2018/01/pall-dt.png338832adminhttp://www.thegoldandoilguy.com/wp-content/uploads/2014/11/tgaoglogo.pngadmin2018-01-25 06:53:522018-01-25 06:53:52Have You Seen Palladium’s Tradable Price Pattern?
Chris Vermeulen, Founder of TheTechnicalTraders.com joins met today to look at the markets that are breaking out in early 2018. The USD, oil, copper, and treasuries are all at levels not seen since 2014. Plus as Chris notes the precious metals are also very close to breaking out which could be the final push to make traders move into the commodities sector even more.
https://thegoldandoilguy.com/wp-content/uploads/2018/01/korelin.png250494adminhttp://www.thegoldandoilguy.com/wp-content/uploads/2014/11/tgaoglogo.pngadmin2018-01-23 15:26:352018-01-23 15:32:414 Key Markets At Levels Not Seen In 3 Years
Recent downside price rotation in Bitcoin has caused quite a bit of concern for Crypto traders and investors. This recent breakdown move represented a failure of continued strength and has, and still is, testing critical support for a bottom.
http://www.thegoldandoilguy.com/wp-content/uploads/2014/11/tgaoglogo.png00adminhttp://www.thegoldandoilguy.com/wp-content/uploads/2014/11/tgaoglogo.pngadmin2018-01-22 18:07:252018-01-22 18:07:25If You Own Bitcoin This Rotation Causes Concern
Over the past few weeks, we have been writing about our US major price predictions for the beginning of 2018 and how they have played out. If you have been following our analysis, you have already learned that we predicted a 3~5% price increase in early January 2018 for most of the US major equity indexes as well as a period of brief stagnation near the middle of February. Today, we are going to revisit these predictions to attempt to provide you with our updated price expectations.
As you read this article and review our analysis, please keep in mind that we are showing you an advanced price modeling system that is capable of learning from historical price activity as well as illustrating the highest probability outcomes of price based on its analysis of key “genomic” price patters and technical patterns. The reason this is so important to understand is that we are illustrating 2~3+ month in advance based on our modeling systems interpretation of price action. Imagine having the ability to predict 2 to 3 months in advance with a relatively high degree of accuracy for any stock symbol you like? This is a very powerful analytical modeling system and we are happy to be sharing this research with our readers.
First, let’s review the SPY and the possibilities our Adaptive Dynamic Learning (ADL) price modeling system is showing us as well as how accurate the first few weeks predictions have been for 2018.
As you can see from the chart, below, our analysis on December 11, 2107 presented a series of YELLOW DASH lines that represent the highest probability outcome of price going forward. If you take a close inspection of the price levels and Yellow Dash Lines near the end of 2017, you will see that actual price levels were muted in comparison to our predicted levels. This happens when we get a brief anomaly in price action whereas price fails to meet our expectations. When this happens, most of the time price will recover to near our predicted levels at some future point in time which makes these “anomaly triggers” quite profitable. Imagine knowing that price “should be” near a certain price level but is currently 2~5% lower. Obviously, one could take a long position and wait for the equity price to simply recover to the projected price level for easy profits.
This is one reason why we believed early January 2018 would prompt a strong rally and a continued rally. The first few weeks of January 2018 were predicted to be well above $276-278 while price was hovering near $268 at the end of this year – that’s a 4% easy move.
Currently, the predicted price levels are still moderately bullish for the next 2~3 weeks before we begin a rather sharp “washout high rotation” – peaking near $285 by March 5th, 2018. This means, we should be expecting some more narrow price rallies to continue with somewhat diminishing volatility in the SPY before expecting a POP rally (really a “washout high candlestick pattern”) to form near February 15th.
After this Washout High patter forms, traders should protect longs and expect a 4~6%+ price contraction that will scare the markets. Any price contraction of more than about 5% typically frightens the markets to a degree that people start talking about “bear trend possibilities”. From the prediction of our ADL system, this looks to be a very fast and aggressive downward price swing in the SPY – so it could be news related.
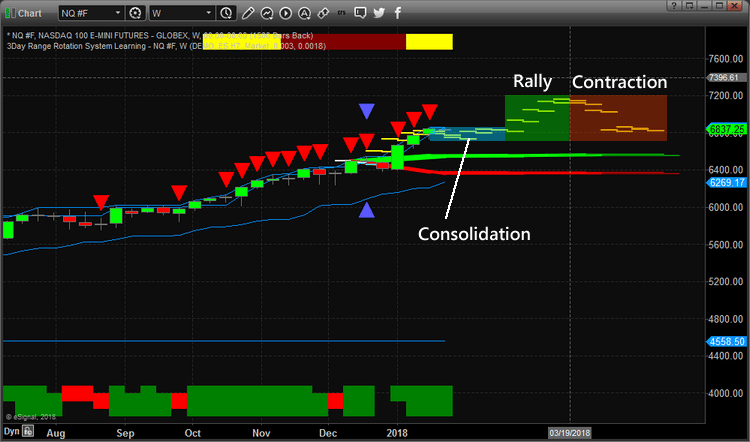
Our ADL system is predicting somewhat similar price action for the NASDAQ, yet we have a period of consolidation to get through first. As you can see from the YELLOW DASH lines originating at the same December 11, 2017 time frame, the same type of setup happened in the NQ as with the SPY. By the end of 2017, the NQ was dramatically lower ADL predicted price levels. The ADL system was predicting the NQ would reach $6725 by the end of the first week in January 2018 while the actual price at the end of 2017 was $6408 – that represents a +315 pt range. We took advantage of that “anomaly” by predicting a 3~6% rally in the QQQ ETF in the early portion of 2018 to our members.
Now that our predictions for the first part of 2018 have played out, lets focus on what is next. The ADL system is predicting a stagnation in price action for the next 4~5 weeks with narrowed volatility and rotation. We could still see some moderate volatility in price ranges, yet we expect the overall price advance to slow considerably over the next few weeks.
Somewhere near or after February 19th, we expect the NQ price to break to the upside with another 3~5% rally (again, another 350+ pt swing) that should end near March 15th and begin a dramatic downward price move. The ending prediction of the ADL system for April 23, 2018 is $6846.25 – pretty much exactly where we are at right now.
So, knowing this information and knowing that both the SPY and NQ will likely top, or present a short-term topping formation near the middle of March 2018, what should you be doing? How are you going to trade these opportunities? Do you want more of our help in understanding how to profit from these moves? Also, if you own Bitcoin you should read our most recent post and see our technical analysis on what to expect next.
That is exactly what Technical Traders Ltd. offers to our members through the Wealth Building Trading Newsletter. Each day we provide detailed video market analysis and detailed market research to our members. We identify trends, reversals, trading setups and global market research for all our valued members. We help them find ways to profit from these moves while keeping them aware of the markets longer term objectives.
We’ve just completed the initial move of 2018. The rest of this year is sure to be full of interesting and exciting trading activity. We can’t wait to show you what happens with other asset classes and with equities after the March 2018 correction. Visit www.TheTechnicalTraders.com to see how we can assist you in profiting from these market moves. We just laid out a price map of the markets for the next 2~3 months for you to trade with. Maybe it is time you considered the value we can offer you in terms of advanced predictive analysis and more?
Continued moderate bullish price action in the US majors with the VIX dropping right on queue and markets popping (pure sentiment call). Gold and Silver pushed higher today while Oil contracted. The NQ is still pushing into the range of our upper boundary with moderate bullish price action. The The DOW closed +53.91 (+0.21%), the ES closed +14.50 (+0.52%) and the NQ closed 32.50 (+0.47%). Gold closed +4.80 (+0.35%) and Silver closed +0.086 (+0.54%). Oil closed -0.45 (-0.70%).
We are expecting Metals and Oil rotate a bit lower over the next few weeks in relation to our price cycle analysis. Gold should rotate back below $1300 and Silver should settle near $16.00 before this downward rotation ends. Oil may rotate moderately lower over the next few weeks, but overall price cycle analysis shows consolidation and sideways trending for a few more days. Be prepared.
Bitcoin reacted today by consolidating within the Price Channels we have been discussing. These channels are currently at $11,000 & $11,130. Within this $130 range, we expect Bitcoin will consolidate before attempting a breakout move. At this point, upside rotation is possible, but the news relating to BlockChain and Bitcoin tend to point to a lower price breakout. Currently, Bitcoin is trading at $11,515.00. Be prepared for additional downside risk at this point. $7,800 is now a very real downside target.
GET THIS VIDEO EVERY MORNING
+PLUS OUR TRADE ALERTS
CLICK HERE
https://thegoldandoilguy.com/wp-content/uploads/2018/01/video-featured-image.jpg246336adminhttp://www.thegoldandoilguy.com/wp-content/uploads/2014/11/tgaoglogo.pngadmin2018-01-21 11:29:122018-01-21 11:29:12Stock Market Forecast For Next Week Jan 22-26


 So, knowing this information and knowing that both the SPY and NQ will likely top, or present a short-term topping formation near the middle of March 2018, what should you be doing? How are you going to trade these opportunities? Do you want more of our help in understanding how to profit from these moves? Also,