Recently business and financial guru Mark Cuban wrote an article about why this tech bubble is going to be worse than the tech bubble of 2000. This made me take another look at the long term charts again, but instead of looking up the NASDAQ or the tech sector I decided to check out gold mining stocks, gold price and the Dollar index.
From looking at the price action among the precious metals sector and the dollar it looks and feels like these markets are very close to repeating what happened in the year 2000.
The chart below is a monthly chart looking all the way back to 1996. I have color coded areas of the chart that represent weak and strong times for the price of gold.
Gold Price
Key Points:
The US Dollar is trading roughly at the same level and trending higher as it was in 2000.
Rising dollar is neutral/negative on commodity prices and resource stocks like gold miners.
Gold price struggled as the dollar rose in value.
Gold stocks fell sharply during the last year of their bear market.
Gold stocks bottomed before physical gold by several months.
Concluding Thoughts on Dollar, Miners & Gold Price:
In short, I feel most of the downside damage has already been done to the price of gold. Gold stocks on the other hand could still get roughed up for a few more months before finding a bottom.
Money is likely to continue rolling into the dollar as a safe haven and this will keep gold and silver prices relatively flat. But once the dollar starts to show signs of increased volatility (top) similar to 2000 – 2001 money will find its way into other currencies and precious metals as the new trade and safe haven.
https://thegoldandoilguy.com/wp-content/uploads/2014/06/goldbreakout.png158238adminhttp://www.thegoldandoilguy.com/wp-content/uploads/2014/11/tgaoglogo.pngadmin2015-04-16 13:42:172015-04-16 14:17:43Gold Price: Year 2000 All Over Again – How Will You Play It This Time?
A couple of weeks ago I was listening to an hour-long segment on CNBC with Warren Buffett. He brought up a great point about the type of investments he prefers and the difference between an investment versus a speculative trade. I feel what he mentioned is worth sharing so here it is.
He stated that he prefers to hold an investment which is earning money and generating cash flow. Meaning he prefers to own equities of companies which generate income for its shareholders versus a commodity which does not generate any revenue.
While Mr. Buffett said that gold is a commodity everyone should own some of, he also clearly stated that buying a commodity in hopes that someone will pay you more for it later is purely speculative. Lets face it, would you rather own something that paid you monthly or annually a cash dividend or something that might go in in value, but may also lose value?
Investors and traders are primarily focused on purchasing gold stocks, physical gold via ETF’s, gold bars and coins which none of these provide any income the holder. But after doing some in-depth research I have found another way to invest in precious metals and commodities that will not only give you exposure to the gold, silver, and oil sector but it can also generate a monthly income stream to your portfolio.
Through Gabelli closed-end funds like the Global Gold, Natural Resource & Income Trust (GGN), or Natural Resource, Gold & Income Trust (GNT) you can get the best of both worlds.
Each fund is currently providing a 10% annual dividend paid out in monthly distributions. The Fund’s investment objective is to provide a high level of current income. The Fund’s secondary investment objective is to seek capital appreciation consistent with the Fund’s strategy and primary objective. Under normal market conditions, the Fund will attempt to achieve its objectives by investing 80% of its assets in equity securities of companies principally engaged in natural resource and gold industries, and by writing covered call options on the underlying equity securities.
If you don’t know what covered calls – Explained Below:
A “covered call” is an income-producing strategy where you sell, or “write”, call options against shares of stock you already own. Typically, you will sell one contract for every 100 shares of gold or oil stock. In exchange for selling the call options, you collect an option premium.
With the US stock market slowly nearing a bull market top and with commodities trading at multiyear lows we should eventually see a shift in money flows out of stocks and into commodities. With rising commodity prices resource base stocks should start a new bull market that will send these funds dramatically higher in value while still paying a juicy dividend income.
In conclusion, if you want to invest in precious metals long-term I think owning an income strategy based around that investment is a great way to add diversification and income to your portfolio. Learn more about trading ETFs, funds and copy every trade I place with my own money at www.TheGoldAndOilGuy.com
Chris Vermeulen
Disclaimer: I currently own shares of GGN
https://thegoldandoilguy.com/wp-content/uploads/2015/04/gamco.png246267adminhttp://www.thegoldandoilguy.com/wp-content/uploads/2014/11/tgaoglogo.pngadmin2015-04-12 18:16:552015-04-10 15:19:01True Investments VS Speculative in Gold & Oil
Everyone is looking for the holy grail of the financial market which will tell what will happen next in stocks, commodities, bonds etc… Knowing that the holy grail of trading does not exist I am going to step out on a limb and share my four month stock market forecast along with commodities and bonds.
It is vital that you understand this is a 2-4 month forecast only and as the market evolves my outlook will change as I follow price action as closely as possible.
Here are some key points you need to know:
Bonds should perform well for a few months and possibly a long time until the bear market in US stocks takes hold and is well under way. BUT, the bond bubble will burst eventually when rates start to climb. This could be June, or much later in the year but until then I expect them to rise as the safe haven.
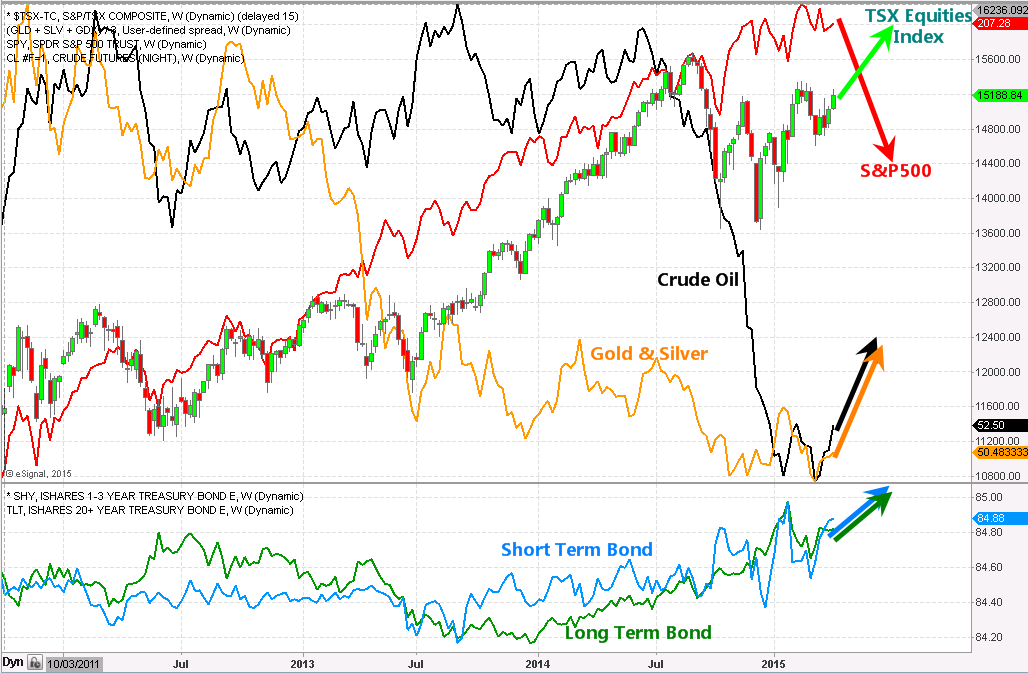
Commodities typically outperform equities during the late staged of the bull market which is what I feel the US stock market is. Resource stocks and resource rich countries like Canada should hold up well, and possibly make new highs going into summer.
Notice how gold and oil have moved from opposite corners of the chart compared to the US and Canadian stock indexes.
During the 2000 and 2008 bear market we saw gold, silver, oil and mining stocks get hit very hard in the second half of the bear market. Will this happen again? I do not think it will because this time rates are at zero and there is only one way to go when they are at the bottom… Up!. This means stocks and bonds will likely both enter a bear market, maybe not at the same time, but they will eventually. This means the only places to protect your capital will be commodities, resource based investments, or simply cash CAD & USD.
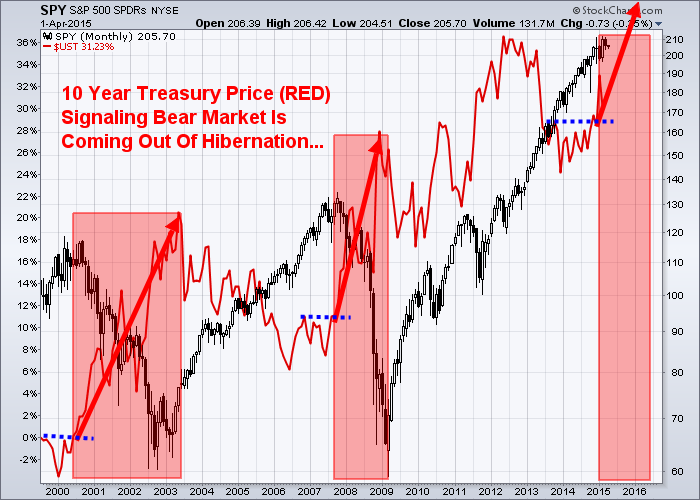
Take a look at this 10 year bond price overlaid on the S&P 500 index. So far this year bonds have popped and rallied above short term resistance which we have seen in the past. Big money is rotating into bonds for the time being and this is a warning sign of a stock market top. If you want to learn more about the technical and fundamentals in motion about what is about to happen, why, and when read my ebook “The Global Economic Collapse Of 2015”
Market Forecast Conclusion:
In short, safe havens for investor’s capital will be more of a dance during the next bear market in US equities.
With many countries devaluing their currencies and a potential bull market in commodities I expect the Canadian Loonie and US Green Back to hold the value if not rise over the next year or two.
If you want my long term investing signals my ETF swing trades so you can protect your capital and profit during the next bear market – Sign Up Today!
This week I would like to share with you the strategy that I am deploying to my own investment portfolio. As the US stock market nears completion of a major topping pattern I expect a multiyear decline in the price of equities.
During the past month my focus has been on big picture analysis. Because what I believe is about to unfold will have a dramatic life-changing affect on your financial situation and it is crucial that you realize what is very likely going to happen.
The worst case scenario is that you give back come gains generated during this year bull market, and best case is that you not only avoid the bear market but profit substantially from it.
Let’s talk about the masses for a moment. Unfortunately most traders and investors are extremely bullish on stocks right now and for good reason. Over the past six years you virtually had to just throw a dart at the board and over time you would have generated substantial gains. But because of this luck/success most investors have become overly bullish and continue to buy stocks at an alarming rate even though evaluations are high and warning signs of the stock market top is near.
Simply put there is a time in the market when you should be accumulating shares. And there is also a time when you should sell your equity positions and exit the equity market.
According to my analysis and experience I feel investors should exit positions in equities and focus on a large cash position and/or moving thier money into bonds and other asset classes.
Looking forward 8 to 24 months to protect your portfolio and continue to grow its value will be in Canadian bonds (not US Bonds), precious metals, and in the commodity market as a whole.
Let me explain my thought process behind these ideas briefly:
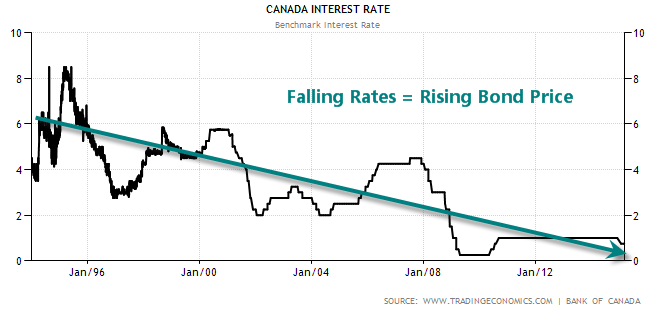
Canadian Bonds: unlike the US Canadian rates continued to decline. As rates fall we tend to see the price of bonds rise. And when fear hits the overall stock market in both Canada and the USA money will naturally flow out of equities and into bonds as a safe haven. This double flow of money will send the price of bonds dramatically higher.
Precious Metals: precious metals will act as a safe haven, a hedge against currency devaluation which is a huge concern in the future. Small speculative traders are finally not interested in this sector which can been seen by reviewing the COT report on gold. Speculative traders (small average Joe) are now net short gold.
Commodities: resources tend to perform well during late stage bull markets and bear markets. With several of the main commodities trading at long-term support levels and have formed basing pattern we should expect strength in commodities over the next 12 months.
The Plan Conclusion:
Last week I started liquidating a large portion of my equity positions in my long-term investment account. I am currently sitting heavily in cash and will be liquidating more of my equities and rotating money into bonds, precious metals and commodities.
My recent investment purchased was precious metals (gold and silver). This accounts for roughly 2.8% of my portfolio. I intend to build my precious metals holding to be roughly 10% of my portfolio over the next few months. I do have a potential downside target for gold to reach $815 per ounce before bottoming and rocketing higher. Because this is a long-term investment looking forward one to five years I will be scaling into this precious metals position each week as I see fit.
The commodity portion of my portfolio is 3.4% of commodity related investments with a plan to build it to 5%.
After six years of gains in my long-term portfolio I am very comfortable holding 75% Canadian bonds, 10% precious metals, 5% commodities basket, and 10% equities.
Until we get a bear market correction or new analysis points to substantially higher prices for equities I will be playing defense to preserve capital so I have lots of gun powder to re-enter the equities market when valuations, dividends, and higher share prices are in favor.
If you want to avoid the next bear market and possibly generate oversize gains from falling equity prices then join my newsletter today!
https://thegoldandoilguy.com/wp-content/uploads/2015/04/bondsCad.png231305adminhttp://www.thegoldandoilguy.com/wp-content/uploads/2014/11/tgaoglogo.pngadmin2015-04-05 13:10:282015-04-03 17:22:19A Trading Plan That Could Save Your Portfolio
The question on everybody’s mind for 2015 is when will the stock market start to correct in value and will it turn into a 50+% collapse?
Over the last 15 years investors has been through a lot in terms of market volatility. From the 2000 tech bubble bear market and the 2008 financial crisis bear market investors are far from having their investment psyche scars healing and is for good reason. Many sustained 50+% loss in their portfolio value more than once and are not willing to do it for a third time.
A large group of investors exited the stock market and has never returned. Unfortunately those who exited have missed the seven-year bull market rally to all-time highs. Those who remain in the market are in constant fear that a new bear market will emerge.
The stock market has a tendency to move in a 6 to 8 years cycle. With the current bull market now lasting seven years and was several indicators signaling weakness within the equities market it makes logic sense that a bear market is about to emerge.
The stock market cycle and technical indicators are not the only causes the trigger a bear market. A rising Fed funds rate can cause weakness in the equities market and if you know what to look for you can escape the next bear market and profit from falling prices.
Question: if you could put your money in a guaranteed investment not to lose any principle and receive a 1% per annum return on investment or receive potentially 7% per year but with no guarantee on your principle, which would you choose?
Most people would choose the 7% return option because they understand financial rewards almost always require some risk. Over the last 90 years the stock market has on average returned 7% annualized gains.
Obviously not all years will have a positive gain, but when averaged over many years, it is reasonable to expect an annual return of 7% from the stock market.
What if I told you there is a way to improve on this? For example, if you simply moved your equity investments to a large cash position at the start of each bear market?
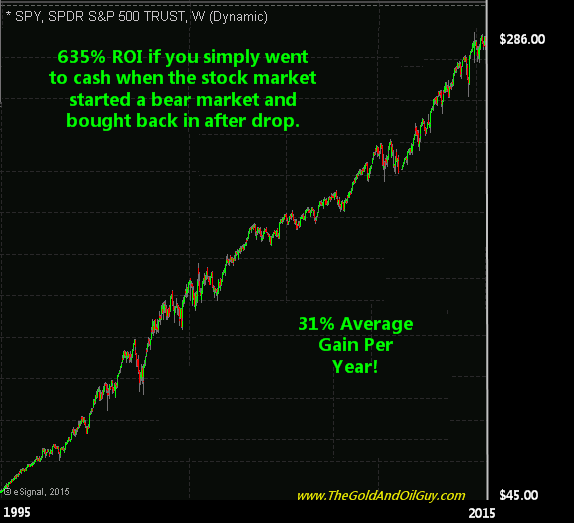
The chart below showing the gain from your would have has from 1995 to 2015 by selling all stock holdings when the US stock market topped during 2000 and 2007 avoiding the last two bear markets.
100% cash position during bear markets would have generated 635% ROI, which is a 31% average annual return. The numbers are staggering to say the least. But obviously you cannot pick the exact top and bottom, but even if your timing was way off and you only pocketed half of those gains you would still be way ahead of game.
You may be asking yourself: How do I avoid a bear market?
I believe for investors this is not that difficult because a major trend change takes time and because the moves are so large you don’t need to be perfect with your timing.
Take a look at my analysis charts below. The first one shows the 10 year treasury price which is broken its short term resistance levels and is rocketing higher. We have seen this happen 6-12 months before the last two bear markets started.
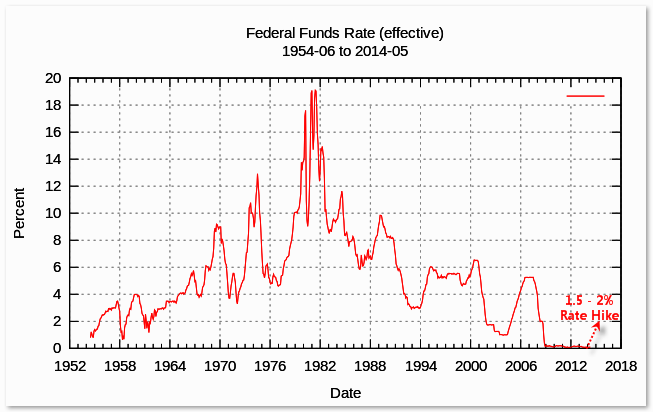
Let’s take a look at the Fed rates
Not every rate rise turned into a recession, but nearly everyone has. Rising rates will lead to a market downturn.
Could the next bear market/recession occur when rates start to climb? After analyzing economic data provided by Brad Matheny I have a max rate at 2% over the next couple years.
That combination of technical indicators, analysis above couple with the rising fed rate hikes had created the perfect storm for a bear market to emerge which I expect to last 1-2 years.
Bottom line, we are still in a bull market but only months away from a bear market. Do not ignore these warning signals.
Keep your eye on the 2 year treasury rates instead because they usually lead Fed funds, and will provide an earlier warning signal as to the markets down turn.
When rates start to rise, we may only be weeks, instead of months, before the stock market starts to collapse.
Get My Trade & Investment Alerts:www.TheGoldAndOilGuy.com – Limited Offer!
Chris Vermeulen
https://thegoldandoilguy.com/wp-content/uploads/2015/04/econcrash.png278280adminhttp://www.thegoldandoilguy.com/wp-content/uploads/2014/11/tgaoglogo.pngadmin2015-04-02 03:02:542015-04-02 03:05:23Do Equities Just Correct or Collapse in 2015?
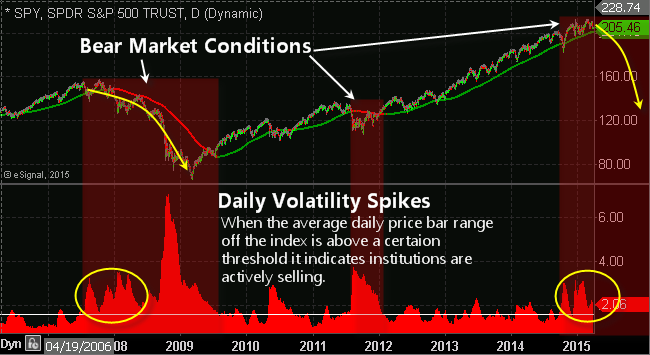
Since the beginning of January 2014 stocks have shown signs of institutional selling. This can be seen in the small capitalization stocks index the Russell 2000. This group of stocks generally leads the S&P 500.
Most bull market tops in the S&P 500 shown below take 8-12 months to form before it starts to fall in value. So far the market has been under distribution selling meaning the large traders (institutions, hedge funds) is selling their positions to the average investor to be left holding the bag when things go south.
The chart posted below shows some of my analysis of the SP500 index. This chart shows the 200 day moving average which is a great indicator of the major trend of the market. Green means bull market, red indicates bear market.
Also you will see the red ATR (Average True Range) indicator at the bottom. This tells us if the average daily movement for the index is high or low. When this red area rises we know there is a large amount of money flowing in and out of the equities market. It takes large amounts of capital to do this and is why the sellers are most likely hedge funds and institutions rebalancing their portfolios for an upcoming trend change.
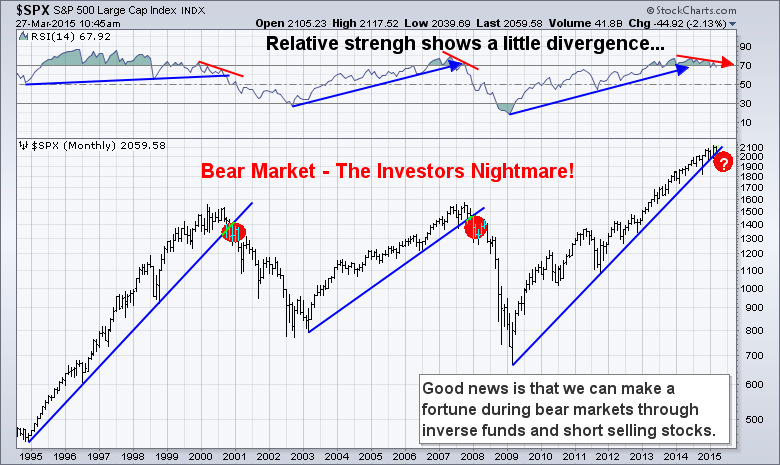
If we step back and take a look at the bigger picture using the monthly chart of the S&P 500 we can foresee what is likely to happen in the next 12-36 months. The US stock market is losing momentum which can be seen by the relative strength indicator at the top of the chart.
Also the support trend line give us a feel on how soon a breakdown in price may happen. It appears to be just months away…
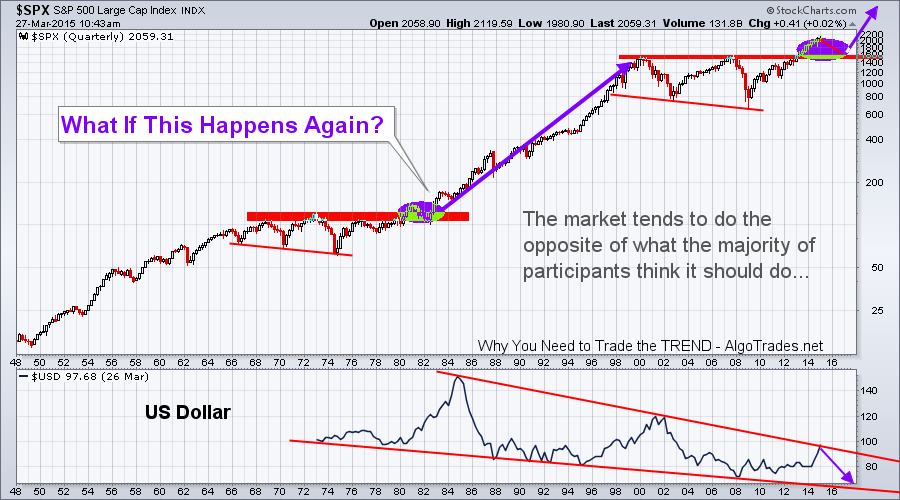
Taking things one large step further back, roughly 70 years you can see some patterns of that in the past. The question is not will there be a bear market, but how far will it correct?
The cart below shows a very bullish outlook of a minor correction of 30% in the next 36 months. Also I do have analysis that shows that if we break below the 30% level we could have a 50-60% correction which could trigger a chain reaction of issues including the US bond bubble to burst.
US Stock Market Conclusion:
In short, the US stock market continues to grind higher but with several warning signs to investors who know how to spot them.
There are three ways to play a bear market. The first is to do nothing, which is what most people do as they watch their life savings slowly evaporate right in front of them month after month.
Second, is to liquidate a large portion of equities and sit safely in cash while others lose money.
The third and last is to position yourself to profit from a falling market. It’s known that stocks fall 4-7 times faster than they rise, which means you can potentially make 7 years’ worth of profits in just 1-2 years if done correctly.
These are ways to play a bear market, and I say play because you do need to be a little more active to enter and lock in profits in this market condition. This is something I can help you with through my trade alert newsletter.
https://thegoldandoilguy.com/wp-content/uploads/2015/03/bear.jpg300300adminhttp://www.thegoldandoilguy.com/wp-content/uploads/2014/11/tgaoglogo.pngadmin2015-03-27 15:59:462015-03-27 16:17:22Index Market Range Points Is Warning Us
Protecting Yourself with Gold, OIL and Index ETF’s
In 2009 I shared my big picture analysis, investment forecast and strategy in a book called “NEW WORLD ORDER ECONOMICS – What you can do to protect yourself”. In January 2009 I forecasted that the Dow Jones Industrial Average was going to make a bottom within a couple months which it did. I also predicted the price of gold to start another major rally, and for crude oil to bottom and rally for years, which were also correct.
You can call it luck, skill or a mix of both… but the truth is that the markets cannot be predicted with 100% certainty. With that said, the US stock market, gold and oil look to be setting up for their NEXT BIG multiyear moves.
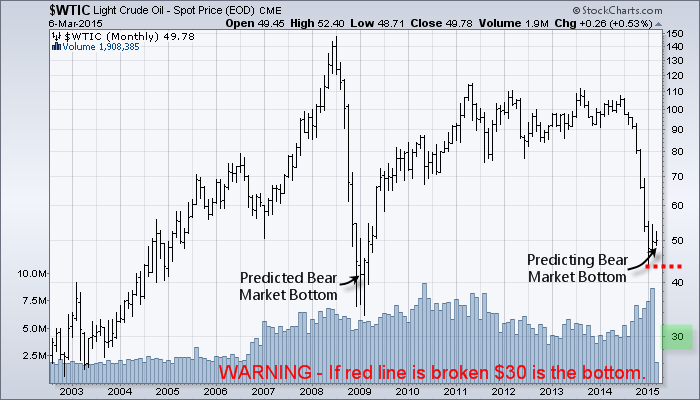
THE OIL BEAR MARKET IS ABOUT TO END
Crude oil and energy stocks are tricky to navigate in a situation like this where the equities market is nearing a bull market top.
It is critical to remember that when the US stock market turns down and starts a bear market virtually all stocks and commodities will fall in value including oil and energy stocks. Investors need to understand that even though the price of crude oil is nearing a bottom it could and will likely stay low for a considerable amount of time “IF” the stock market turns down.
Over the last 100 years we have seen nearly 30 bear markets. The average length of a bear market is 18 months and has an average decline of 30%.
I do feel currency problems and a war breakout will be bullish for both oil and gold. So if we get a bear market in equities, and a war oil and oil should rally while stocks in general fall.
But if we do not have those sever crisis’ then if gold and oil break below their critical support level which is the red line on the charts and a bear market in stocks start you do not want to be long stocks or commodities.
PRICE CHART OF OIL
The chart below shows the line in the sand for the price of crude oil. If this level is broken with a monthly bar close below $43 per/barrel I think $30-$33 will be the next stop and the low for the oil market. It seems everyone is bullish on precious metals and have been buying like crazy.
The points I made about gold which I talked about in PART II should be reread because if the support levels are broken oil will fall 40%, and gold another 35% from their current prices.
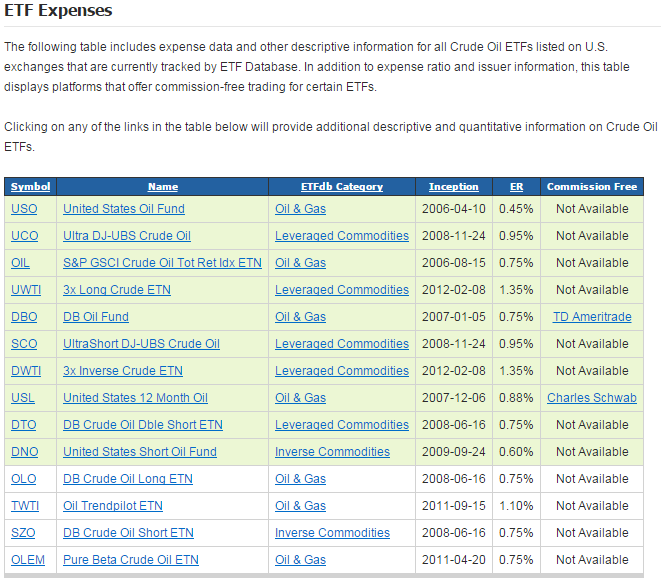
Below are some ETFs that takes advantage of rising oil prices. While there are other funds that cover oil stocks I feel they may not perform well during the equities bear market. Investing in physical oil is the best play at this stage of the game but when the equities bear market looks to be nearing an end, energy stocks will be the best place to invest.
PART 3 CONCLUSION:
In short, I feel crude oil will has or will find a bottom within the next couple months. Long term the value is great, but we must be aware that if equities start a bear market it will be best close all equity positions and wait for the bear market to subside. When the time is right investing in crude oil and energy stocks which pay high dividends will generate life changing gains and an income stream. Patience is the key.
I hope you enjoyed this three part series which covers how to invest in indexes, gold and oil.
Join My Free Newsletter and Receive More Trading and Investment Ideas: www.GoldAndOilGuy.com
Chris Vermeulen
https://thegoldandoilguy.com/wp-content/uploads/2015/03/bullmarket.jpg25193270adminhttp://www.thegoldandoilguy.com/wp-content/uploads/2014/11/tgaoglogo.pngadmin2015-03-23 14:52:152015-03-23 14:54:39NEXT FINANCIAL CRISIS – Part III – OIL
Protecting Yourself with GOLD, Oil and Index ETF’s
In 2009 I shared my big picture analysis, investment forecast and strategy in a book called “NEW WORLD ORDER ECONOMICS – What you can do to protect yourself”. In January 2009 I forecasted that the Dow Jones Industrial Average was going to make a bottom within a couple months which it did. I also predicted the price of gold to start another major rally, and for crude oil to bottom and rally for years, which were also correct.
You can call it luck, skill or a mix of both… but the truth is that the markets cannot be predicted with 100% certainty. With that said, the US stock market, gold and oil look to be setting up for their NEXT BIG multiyear moves.
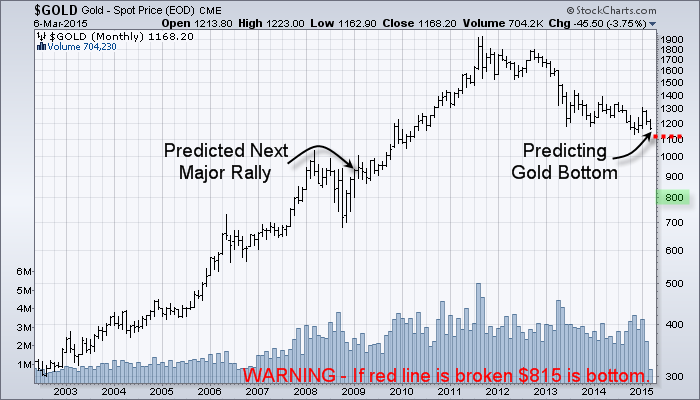
GOLD BEAR MARKET IS ABOUT TO END
Gold and silver have a little trickier of a situation to navigate and invest for maximum returns over the next 2+ years.
The most important thing to realize is that when a full blown bear market starts virtually all stocks and commodities drop including gold, silver and oil. Knowing that, investors must be aware that when the stock market starts its bear market the fear will rise and investors will inevitably sell their holdings and this means we could see gold and oil continue to fall much further from these levels before a true bottom is in place.
Is this time different than the 2008/09 bear market? Yes, this time we have possible wars starting, oil pipelines overseas being cut off, counties and currencies failing and even negative bond yields in some parts of the world – it’s a mess to say the least. There are a lot of things unfolding, most seem to be negative for the economy.
The currency problems and possible war breakout will be bullish for gold and oil. So if a bear market starts in equities, and a war or currency fails gold and oil should rally while stocks fall.
But if we don’t have those sever crisis’ then if gold and oil break below their critical support level which is the red line on the charts and a bear market in stocks start you do not want to be long stocks or commodities.
I have drawn a line in the sand for gold at $1050. If this level is broken then $815 per/ounce is not out of the question. It seems everyone is bullish on precious metals and have been buying like crazy. But as I wrote in 2009 this bullish sentiment actually pointing to much lower prices if support is broken.
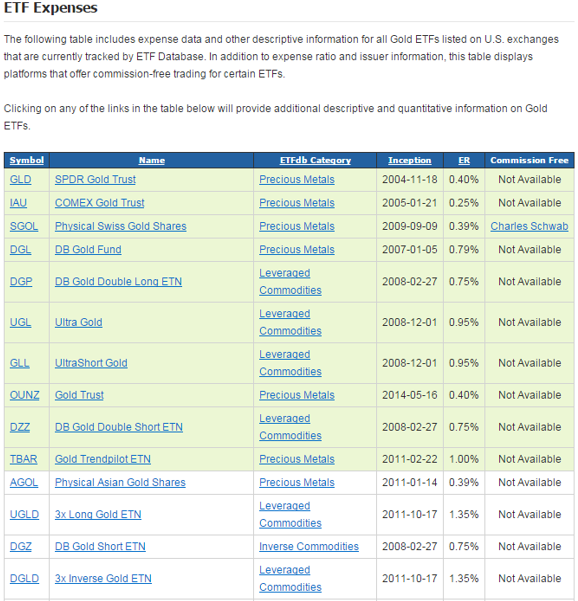
Below are some ETFs that can be used to take advantage of rising gold prices. While there are other funds that cover gold miners I feel they may not perform well during the equities bear market. Investing in physical gold is the best play at this stage of the game but when the equities bear market looks to be nearing an end, gold mining stocks will be the best place to be.
PART 2 CONCLUSION:
In this article we talked about gold and gold stocks which are showing signs of a major bottom being put in place this year. And in the next article PART 3 I will who you what to expect long term for crude oil, how we are up 28% in our short oil trade, and how you can play this multi-year cycle bottom when the time is right.
In the meantime, be sure to join my Free Newsletter so that you receive PART 3 along with more trade ideas: www.GoldAndOilGuy.com
Chris Vermeulen
https://thegoldandoilguy.com/wp-content/uploads/2014/05/gold-predictions.png141171adminhttp://www.thegoldandoilguy.com/wp-content/uploads/2014/11/tgaoglogo.pngadmin2015-03-18 13:31:342015-03-18 13:40:02THE NEXT FINANCIAL CRISIS – Part II
Protecting Yourself with Gold, Oil and Index ETF’s
In 2009 I shared my big picture analysis, investment forecast and strategy in a book called “NEW WORLD ORDER ECONMICS – What you can do to protect yourself”. In January 2009 I forecasted that the Dow Jones Industrial Average was going to make a bottom within a couple months which it did. I also predicted the price of gold to start another major rally, and for crude oil to bottom and rally for years, which were also correct.
You can call it luck, skill or a mix of both… but the truth is that the markets cannot be predicted with 100% certainty. With that said, the US stock market, gold and oil look to be setting up for their NEXT BIG multiyear moves.
US EQUITIES BULL MARKET IS ABOUT TO END
2014 was a tough year for small cap stocks. The Russell 2000 index which is a great barometer of what speculative money is doing as a whole. History has shown that small capitalization stocks are the first group to show weakness after a multi-year bull market.
For all of 2014 this group of stocks has been struggling to hold up. Each time it nears a previous high, sellers come out of the woodwork and unload shares in large volume. This was the first tell-tale sign that institutions are starting to rotate their positions out of these high beta stocks.
Later that year in October 2014 the S&P 500 fell 10% in just a few weeks. The speed of the selloff and the heavy volume that accompanied it are yet another warning sign that the underlying strength of the stock market is weakening. This broad market selloff included the large capitalization stocks which means the end is nearing.
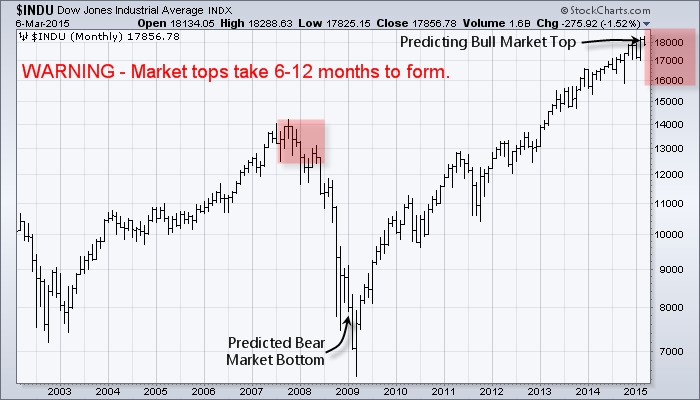
If we turn our focus to the Dow Jones Industrial Average and look at the chart below you will see my prediction for 2015/2016.
I should be clear on what to expect during market tops because they differ than market bottoms. Most bottoms that occur are powered by fear. A
nd fear has a price pattern on the chart that is much different than what we see during market tops when optimism is high.
Bottoms tend to be more violent with large range bars and the process happens in half of the time than what a bull market top requires.
Bull market tops take longer to form and for price to actually breakdown and confirm it’s headed lower. My thinking is that a market top may have already started. The underlying metrics are eroding and the heavy volume selloff in Oct 2014 was the first major signal that big money is selling.
I do feel the market as a whole can and will make some minor new highs, but will have strong bouts of selling shortly after. Late 2015 and going into 2016 is when the US stock market will likely start to get volatile and we will see the first MAJOR drop in value. It will be similar to the first breakdown bar that took place Jan 2008. A 15-20% drop that breaks the Oct 2014 low is going to be the straw that breaks the camel’s back.
Once we get the initial break in price the market should pause or bounce for a few months as investors are still overly bullish at these BARGAIN prices “they think” and buy more shares. In reality it’s the worst thing an investor can do at this stage of the stock market life cycle.
Once the bear market starts investors should expect 12-24 months of lower and sideways price action.
So How Do We Take Advantage Of This?
There are two ways to play the next bear market. First is to simply move your money out of stocks. This means sell long positions, pull money out of mutual funds etc… and just hold your money in cash. Cash is king and by doing this you will retain your current level of wealth and be ready to invest when the time comes later in 2016/2017.
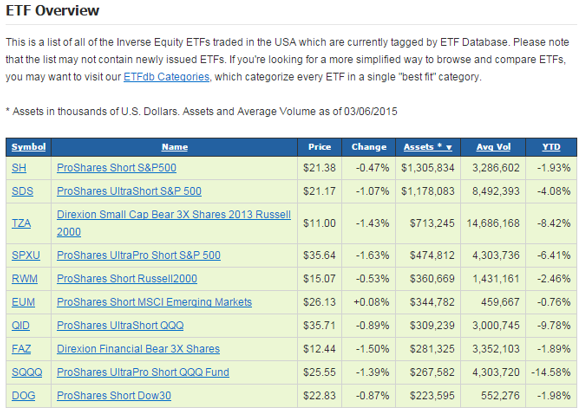
The second option is to do the same as above but to put a portion of your money to work in a way that will allow you to profit from a falling stock market. That is to invest in ETFs specifically inverse funds.
Inverse funds rise in value as the stock market price falls. For example if the Dow Jones Industrial Average drops 35% over the next 24 months, your investment would rise 35%, 70% or even 105% depending on the type of fund purchased.
Below are some ETFs that can be used to take advantage of the next bear market
PART 1 CONCLUSION:
In this article we talked about how the US stock market is showing signs of a major top being put in place later this year. And in the next article PART 2 I will who you what to expect long term for crude oil and how to play this multi-year cycle.
In the meantime, be sure to join my Free Newsletter so that you receive PART 2 & 3 over the next week plus updates as these investments take place: www.GoldAndOilGuy.com
Chris Vermeulen
https://thegoldandoilguy.com/wp-content/uploads/2015/03/Chris-V.jpg180121adminhttp://www.thegoldandoilguy.com/wp-content/uploads/2014/11/tgaoglogo.pngadmin2015-03-13 16:56:322015-03-13 17:07:45THE NEXT FINANCIAL CRISIS – Part I
On Friday, March 6 the US jobs report hit the wires. Equities were trading higher in premarket, and the previous session we had seen strong selloff followed by an equally strong high-volume rally. No one was expecting the massive selloff that was about to hit the stock market when the good jobs numbers were posted.
Later that day after 6 1/2 hours of heavy volume selling in the stock market the closing bell rang. The big selloff pulled most stocks and commodities into an extremely oversold market condition. Traders were waiting all day for some type of bottom to be put in place so they can reenter a long position and day trade the rebound.
But as we learned when the closing bell was ringing, there was no bottom and there was no bounds in equities. From looking at my trading platform dashboard virtually every stock sector country and commodity ETF was trading sharply lower.
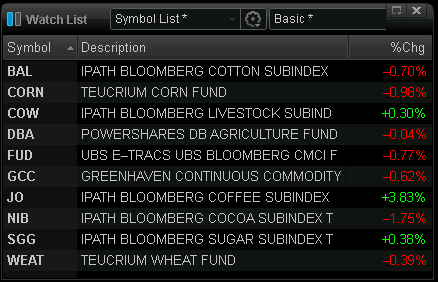
Only four things were green on my dashboard. The first one was the VIX which makes sense as people become fearful the sell stocks and the volatility index rises. But what was interesting was that the other three were food commodities.
The first commodity trading higher was coffee. This makes sense because it was a stressful day and everyone was drinking coffee. The second was sugar. Obviously the majority of coffee drinkers enjoy sugar in their coffee.
The last commodity which rallied late in the day was the ETF cow. Cow is a livestock commodities fund. And so it seems after a long hard in the financial market we find comfort in a big juicy steak. Subscribers to my newsletter and I just happened to get long this fund recently. The chart from a technical stand point is very bullish.
On a more serious side of things… though, the stock market is still in an uptrend. Today’s news was a surprise and surprised data will always cause a severe reaction in the market. History has proven that news based selloffs tend to be a blip on the chart and market recovers within a couple days and the previous trend once again continues.
After the weekend when the stock market reopens and traders had time to digest the news about the FED possibly raising rates if the economy continues to show strength it is going to be interesting to see how the market reacts. My guess is that we see higher prices early next week for US equities.
https://thegoldandoilguy.com/wp-content/uploads/2015/03/coffee.png224338adminhttp://www.thegoldandoilguy.com/wp-content/uploads/2014/11/tgaoglogo.pngadmin2015-03-08 19:57:022015-03-06 22:01:54Three Fear Resistant Commodities That Look Tasty


 In 2009 I shared my big picture analysis, investment forecast and strategy in a book called “