Since the beginning of January 2014 stocks have shown signs of institutional selling. This can be seen in the small capitalization stocks index the Russell 2000. This group of stocks generally leads the S&P 500.

Most bull market tops in the S&P 500 shown below take 8-12 months to form before it starts to fall in value. So far the market has been under distribution selling meaning the large traders (institutions, hedge funds) is selling their positions to the average investor to be left holding the bag when things go south.

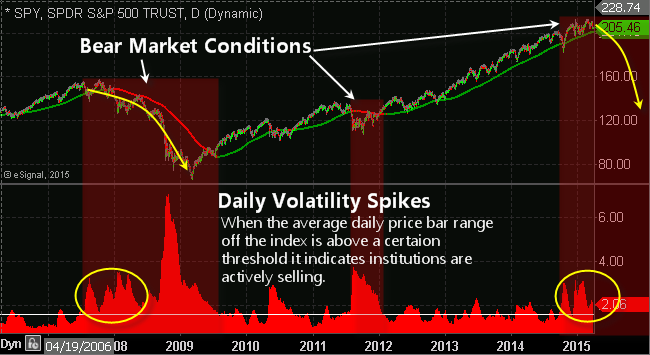
The chart posted below shows some of my analysis of the SP500 index. This chart shows the 200 day moving average which is a great indicator of the major trend of the market. Green means bull market, red indicates bear market.

Also you will see the red ATR (Average True Range) indicator at the bottom. This tells us if the average daily movement for the index is high or low. When this red area rises we know there is a large amount of money flowing in and out of the equities market. It takes large amounts of capital to do this and is why the sellers are most likely hedge funds and institutions rebalancing their portfolios for an upcoming trend change.

ATR-Spkiing-2


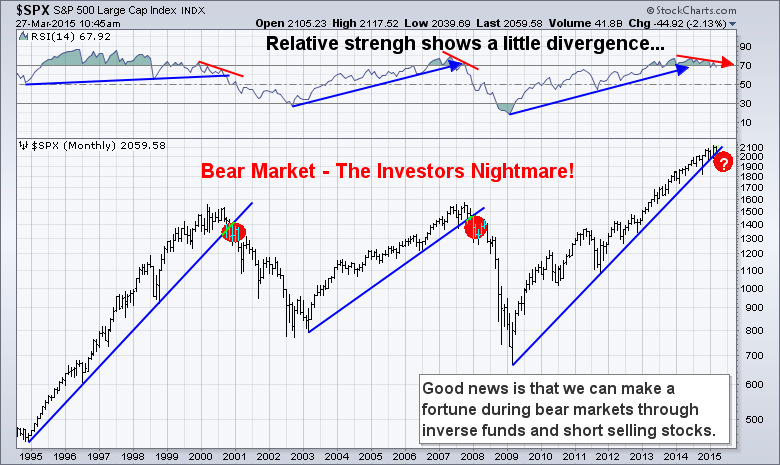
If we step back and take a look at the bigger picture using the monthly chart of the S&P 500 we can foresee what is likely to happen in the next 12-36 months. The US stock market is losing momentum which can be seen by the relative strength indicator at the top of the chart.

Also the support trend line give us a feel on how soon a breakdown in price may happen. It appears to be just months away…

nightmare


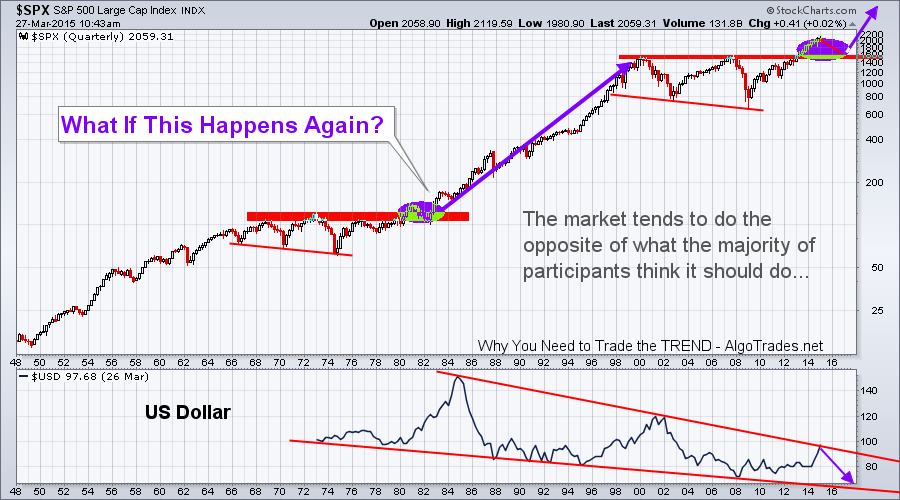
Taking things one large step further back, roughly 70 years you can see some patterns of that in the past. The question is not will there be a bear market, but how far will it correct?

The cart below shows a very bullish outlook of a minor correction of 30% in the next 36 months. Also I do have analysis that shows that if we break below the 30% level we could have a 50-60% correction which could trigger a chain reaction of issues including the US bond bubble to burst.

70yr


US Stock Market Conclusion:

In short, the US stock market continues to grind higher but with several warning signs to investors who know how to spot them.

There are three ways to play a bear market. The first is to do nothing, which is what most people do as they watch their life savings slowly evaporate right in front of them month after month.

Second, is to liquidate a large portion of equities and sit safely in cash while others lose money.

The third and last is to position yourself to profit from a falling market. It’s known that stocks fall 4-7 times faster than they rise, which means you can potentially make 7 years’ worth of profits in just 1-2 years if done correctly.

These are ways to play a bear market, and I say play because you do need to be a little more active to enter and lock in profits in this market condition. This is something I can help you with through my trade alert newsletter.

Happy Trading!

Chris Vermeulen
www.TheGoldAndOilGuy.com – Bear Market Offer – Save Now!

Protecting Yourself with Gold, OIL and Index ETF’s

Chris-VIn 2009 I shared my big picture analysis, investment forecast and strategy in a book called “NEW WORLD ORDER ECONOMICS – What you can do to protect yourself”.  In January 2009 I forecasted that the Dow Jones Industrial Average was going to make a bottom within a couple months which it did. I also predicted the price of gold to start another major rally, and for crude oil to bottom and rally for years, which were also correct.
You can call it luck, skill or a mix of both… but the truth is that the markets cannot be predicted with 100% certainty. With that said, the US stock market, gold and oil look to be setting up for their NEXT BIG multiyear moves.


THE OIL BEAR MARKET IS ABOUT TO END

Crude oil and energy stocks are tricky to navigate in a situation like this where the equities market is nearing a bull market top.

It is critical to remember that when the US stock market turns down and starts a bear market virtually all stocks and commodities will fall in value including oil and energy stocks. Investors need to understand that even though the price of crude oil is nearing a bottom it could and will likely stay low for a considerable amount of time “IF” the stock market turns down.

Over the last 100 years we have seen nearly 30 bear markets. The average length of a bear market is 18 months and has an average decline of 30%.

I do feel currency problems and a war breakout will be bullish for both oil and gold. So if we get a bear market in equities, and a war oil and oil should rally while stocks in general fall.

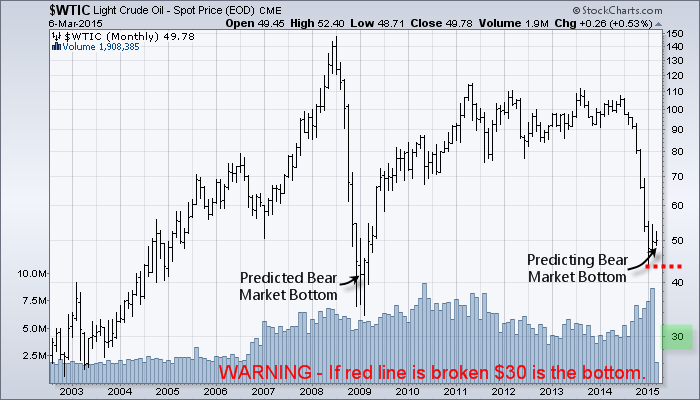
But if we do not have those sever crisis’ then if gold and oil break below their critical support level which is the red line on the charts and a bear market in stocks start you do not want to be long stocks or commodities.


PRICE CHART OF OIL

The chart below shows the line in the sand for the price of crude oil. If this level is broken with a monthly bar close below $43 per/barrel I think $30-$33 will be the next stop and the low for the oil market. It seems everyone is bullish on precious metals and have been buying like crazy.

The points I made about gold which I talked about in PART II should be reread because if the support levels are broken oil will fall 40%, and gold another 35% from their current prices.

oilchart2

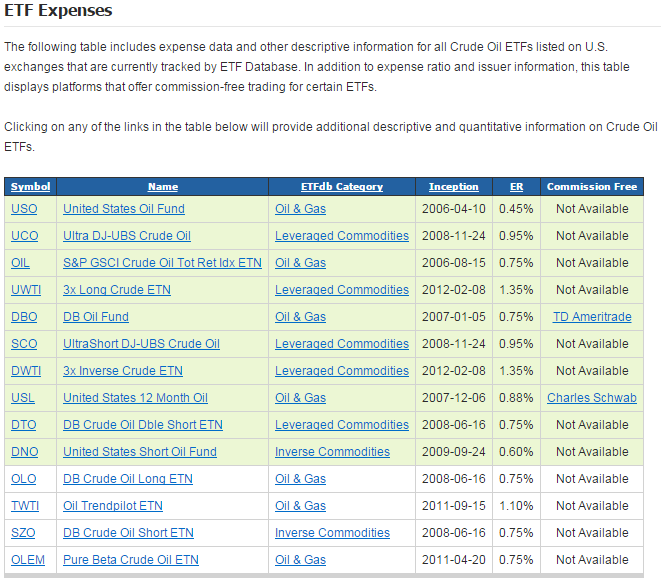
Below are some ETFs that takes advantage of rising oil prices. While there are other funds that cover oil stocks I feel they may not perform well during the equities bear market. Investing in physical oil is the best play at this stage of the game but when the equities bear market looks to be nearing an end, energy stocks will be the best place to invest.

oilETF

PART 3 CONCLUSION:

In short, I feel crude oil will has or will find a bottom within the next couple months. Long term the value is great, but we must be aware that if equities start a bear market it will be best close all equity positions and wait for the bear market to subside. When the time is right investing in crude oil and energy stocks which pay high dividends will generate life changing gains and an income stream. Patience is the key.

I hope you enjoyed this three part series which covers how to invest in indexes, gold and oil.

Join My Free Newsletter and Receive More Trading and Investment Ideas: www.GoldAndOilGuy.com

Chris Vermeulen

Protecting Yourself with GOLD, Oil and Index ETF’s

Chris-VIn 2009 I shared my big picture analysis, investment forecast and strategy in a book called “NEW WORLD ORDER ECONOMICS – What you can do to protect yourself”.  In January 2009 I forecasted that the Dow Jones Industrial Average was going to make a bottom within a couple months which it did. I also predicted the price of gold to start another major rally, and for crude oil to bottom and rally for years, which were also correct.

You can call it luck, skill or a mix of both… but the truth is that the markets cannot be predicted with 100% certainty. With that said, the US stock market, gold and oil look to be setting up for their NEXT BIG multiyear moves.


GOLD BEAR MARKET IS ABOUT TO END

Gold and silver have a little trickier of a situation to navigate and invest for maximum returns over the next 2+ years.

The most important thing to realize is that when a full blown bear market starts virtually all stocks and commodities drop including gold, silver and oil. Knowing that, investors must be aware that when the stock market starts its bear market the fear will rise and investors will inevitably sell their holdings and this means we could see gold and oil continue to fall much further from these levels before a true bottom is in place.

Is this time different than the 2008/09 bear market? Yes, this time we have possible wars starting, oil pipelines overseas being cut off, counties and currencies failing and even negative bond yields in some parts of the world – it’s a mess to say the least. There are a lot of things unfolding, most seem to be negative for the economy.

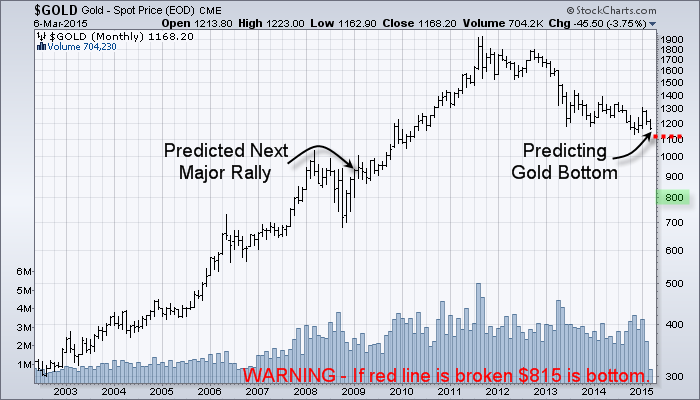
The currency problems and possible war breakout will be bullish for gold and oil. So if a bear market starts in equities, and a war or currency fails gold and oil should rally while stocks fall.

But if we don’t have those sever crisis’ then if gold and oil break below their critical support level which is the red line on the charts and a bear market in stocks start you do not want to be long stocks or commodities.

I have drawn a line in the sand for gold at $1050. If this level is broken then $815 per/ounce is not out of the question. It seems everyone is bullish on precious metals and have been buying like crazy. But as I wrote in 2009 this bullish sentiment actually pointing to much lower prices if support is broken.

gold etf newsletter

LISTEN TO LIVE FORECAST OF GOLD & OIL

howegold
Click Here


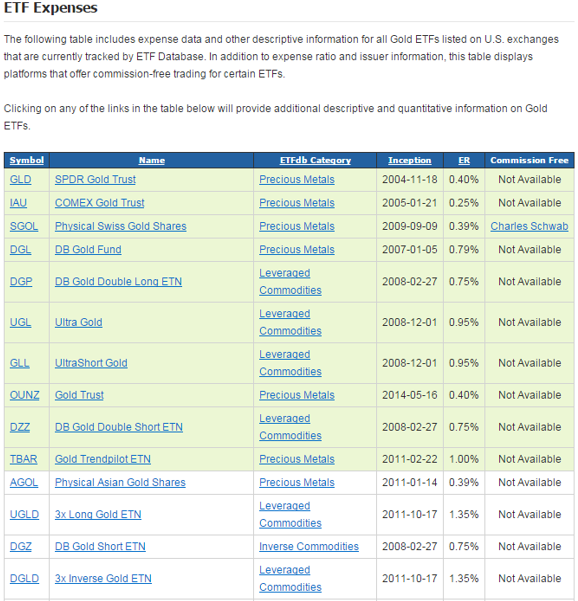
Below are some ETFs that can be used to take advantage of rising gold prices. While there are other funds that cover gold miners I feel they may not perform well during the equities bear market. Investing in physical gold is the best play at this stage of the game but when the equities bear market looks to be nearing an end, gold mining stocks will be the best place to be.

gold etf fund alerts


PART 2 CONCLUSION:

In this article we talked about gold and gold stocks which are showing signs of a major bottom being put in place this year. And in the next article PART 3 I will who you what to expect long term for crude oil, how we are up 28% in our short oil trade, and how you can play this multi-year cycle bottom when the time is right.

In the meantime, be sure to join my Free Newsletter so that you receive PART 3 along with more trade ideas: www.GoldAndOilGuy.com

Chris Vermeulen

Protecting Yourself with Gold, Oil and Index ETF’s

Chris-VIn 2009 I shared my big picture analysis, investment forecast and strategy in a book called “NEW WORLD ORDER ECONMICS – What you can do to protect yourself”.  In January 2009 I forecasted that the Dow Jones Industrial Average was going to make a bottom within a couple months which it did. I also predicted the price of gold to start another major rally, and for crude oil to bottom and rally for years, which were also correct.

You can call it luck, skill or a mix of both… but the truth is that the markets cannot be predicted with 100% certainty. With that said, the US stock market, gold and oil look to be setting up for their NEXT BIG multiyear moves.


US EQUITIES BULL MARKET IS ABOUT TO END

2014 was a tough year for small cap stocks. The Russell 2000 index which is a great barometer of what speculative money is doing as a whole. History has shown that small capitalization stocks are the first group to show weakness after a multi-year bull market.

For all of 2014 this group of stocks has been struggling to hold up. Each time it nears a previous high, sellers come out of the woodwork and unload shares in large volume. This was the first tell-tale sign that institutions are starting to rotate their positions out of these high beta stocks.

Later that year in October 2014 the S&P 500 fell 10% in just a few weeks. The speed of the selloff and the heavy volume that accompanied it are yet another warning sign that the underlying strength of the stock market is weakening. This broad market selloff included the large capitalization stocks which means the end is nearing.

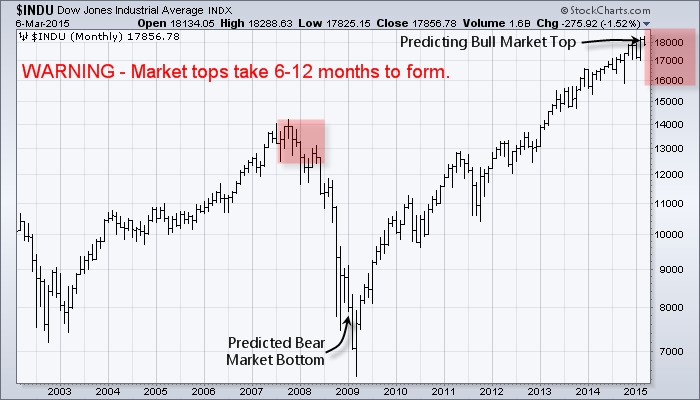
If we turn our focus to the Dow Jones Industrial Average and look at the chart below you will see my prediction for 2015/2016.

I should be clear on what to expect during market tops because they differ than market bottoms. Most bottoms that occur are powered by fear. A

nd fear has a price pattern on the chart that is much different than what we see during market tops when optimism is high.

Bottoms tend to be more violent with large range bars and the process happens in half of the time than what a bull market top requires.

Bull market tops take longer to form and for price to actually breakdown and confirm it’s headed lower. My thinking is that a market top may have already started. The underlying metrics are eroding and the heavy volume selloff in Oct 2014 was the first major signal that big money is selling.

I do feel the market as a whole can and will make some minor new highs, but will have strong bouts of selling shortly after. Late 2015 and going into 2016 is when the US stock market will likely start to get volatile and we will see the first MAJOR drop in value. It will be similar to the first breakdown bar that took place Jan 2008. A 15-20% drop that breaks the Oct 2014 low is going to be the straw that breaks the camel’s back.

Once we get the initial break in price the market should pause or bounce for a few months as investors are still overly bullish at these BARGAIN prices “they think” and buy more shares. In reality it’s the worst thing an investor can do at this stage of the stock market life cycle.

Once the bear market starts investors should expect 12-24 months of lower and sideways price action.

So How Do We Take Advantage Of This?

There are two ways to play the next bear market. First is to simply move your money out of stocks. This means sell long positions, pull money out of mutual funds etc… and just hold your money in cash. Cash is king and by doing this you will retain your current level of wealth and be ready to invest when the time comes later in 2016/2017.

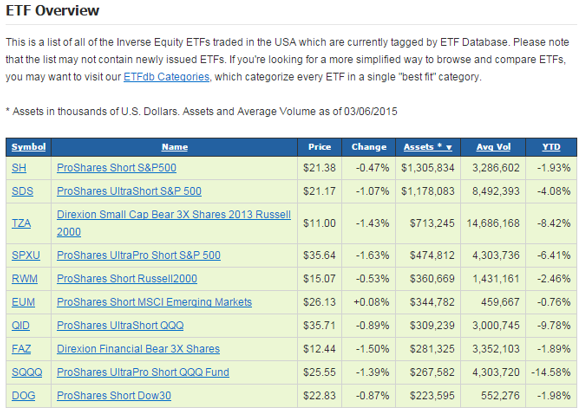
The second option is to do the same as above but to put a portion of your money to work in a way that will allow you to profit from a falling stock market. That is to invest in ETFs specifically inverse funds.

Inverse funds rise in value as the stock market price falls. For example if the Dow Jones Industrial Average drops 35% over the next 24 months, your investment would rise 35%, 70% or even 105% depending on the type of fund purchased.

dowchart2

Below are some ETFs that can be used to take advantage of the next bear market

index-etfs


PART 1 CONCLUSION:

In this article we talked about how the US stock market is showing signs of a major top being put in place later this year. And in the next article PART 2 I will who you what to expect long term for crude oil and how to play this multi-year cycle.

In the meantime, be sure to join my Free Newsletter so that you receive PART 2 & 3 over the next week plus updates as these investments take place: www.GoldAndOilGuy.com

Chris Vermeulen

On Friday, March 6 the US jobs report hit the wires. Equities were trading higher in premarket, and the previous session we had seen strong selloff followed by an equally strong high-volume rally. No one was expecting the massive selloff that was about to hit the stock market when the good jobs numbers were posted.

Later that day after 6 1/2 hours of heavy volume selling in the stock market the closing bell rang. The big selloff pulled most stocks and commodities into an extremely oversold market condition. Traders were waiting all day for some type of bottom to be put in place so they can reenter a long position and day trade the rebound.

But as we learned when the closing bell was ringing, there was no bottom and there was no bounds in equities. From looking at my trading platform dashboard virtually every stock sector country and commodity ETF was trading sharply lower.

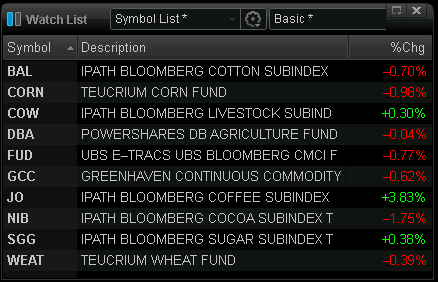
Only four things were green on my dashboard. The first one was the VIX which makes sense as people become fearful the sell stocks and the volatility index rises. But what was interesting was that the other three were food commodities.

EatAndDrink

The first commodity trading higher was coffee. This makes sense because it was a stressful day and everyone was drinking coffee. The second was sugar. Obviously the majority of coffee drinkers enjoy sugar in their coffee.

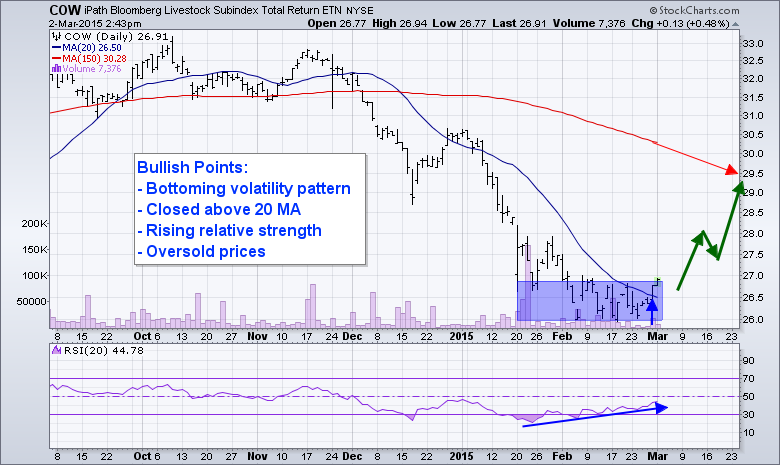
The last commodity which rallied late in the day was the ETF cow. Cow is a livestock commodities fund. And so it seems after a long hard in the financial market we find comfort in a big juicy steak. Subscribers to my newsletter and I just happened to get long this fund recently. The chart from a technical stand point is very bullish.

On a more serious side of things… though, the stock market is still in an uptrend. Today’s news was a surprise and surprised data will always cause a severe reaction in the market. History has proven that news based selloffs tend to be a blip on the chart and market recovers within a couple days and the previous trend once again continues.

After the weekend when the stock market reopens and traders had time to digest the news about the FED possibly raising rates if the economy continues to show strength it is going to be interesting to see how the market reacts. My guess is that we see higher prices early next week for US equities.

GET MY FREE TRADING NEWSLETTER: www.GoldAndOilGuy.com

Chris Vermeulen

I just issued a special WSW Power Investor report members only report outlining my top ten mining stocks for 2015 and beyond.  These are not mere short-term momentum plays, but stocks to take real investment positions in that are at cheap valuations, have good earnings growth prospects, and have fantastic entry points on their stock charts.

In short these stocks have both elements of my “Two Fold Formula” when it comes to picking stocks.  These are the type of stocks that I have found to be the most profitable ones to buy and own over my years of investing and trading in the markets.

We have seen gold and mining stocks put on a tremendous rally after bottoming in November.  The HUI mining stock index went up 40% from its December low to January high and is now pausing before it goes higher.

That pause is providing an incredible entry point for those that want to take a position in mining stocks.

I have done a little extra buying myself this week and released this special report of the top ten mining stocks to buy right now.

You can get instant access to this report by becoming a member of my special WSW Power investor inner circle.

This is a monthly elite membership group that consists of people of all walks of life from hedge fund managers to taxi cab drivers all united in the desire to put money to work in only the best investment opportunities in the financial markets.

It is not for “Fast Money” gamblers, but only for people serious about their investing.

Included with membership is a special Stock Market Mastery Course that can bring you up to speed if you are new to the financial markets or have yet to make serious money in them.

I keep the group closed to new members most of the time so that I can focus on the members of the group and doing research for them instead of spending all of my time on trying to get new members, which is what most people do.

However, thanks to this moment in time when it comes to metals and mining stocks and the release of this special report I am opening up access to WSW Power Investor to you today.

This offering will close though on Thursday at 11:00 PM EST so that I can return my focus to the Power Investor members and also to encourage you to act now and get access to my list of Top Ten Mining Stocks before they go up in price.

Once you join you’ll receive on average a full PDF research report from me every week among other things.  Membership renews every 30-days until you cancel it and you can cancel at anytime.


Your charge will be for $97.00.  ClickBank sells our products – they are a trusted online retailer specializing in digitally delivered products, which will refund any customer “requesting a return within 60 days of purchase.”  What this means is that if you ask them for a refund within 60 days of today they’ll give it to you no questions asked.

CLICK HERE: JOIN WSW POWER INVESTOR $97.00

Mike Swanson

Best Opportunities Outside of North America

Investors tend to focus on investment opportunities that are well known and also those which have been headline news for several months. This allows the investor to become familiar with main stream news which eventually leads to a comfort level that makes them want to get involved with what is hot or not.

While there is nothing wrong with this process it’s widely known that self directed investors tend to get involved with these investments with their money on the wrong side of the market. Simply put, they buy at highs or sell at the lows.

By the time an opportunity becomes headline news most of the opportunities have already made the bulk of their move. Investors buy into good news and sell or short sell investments which are having negative news and this lag time between the investor receiving the news, processing it for a few weeks, then taking action makes for poor entry and exits for their investments.

As hard as it may seem, buying into investments that are getting a lot of negative news are likely going to be some of your best performing investments. For example getting long precious metals here is a tough pill to swallow, but there at least 10 gold stocks that look ready to make big moves.


“Buy When Everyone Is Negative and Fearful,

Sell When Everyone Is Positive”

Recently I talked with Jim Goddard of HoweStreet about the best opportunities I see in the market and they all happened to be international investments. Feel free to listen to our thoughts about these opportunities: HoweStreet Story

howstreet

Best International Opportunities Explained Visually

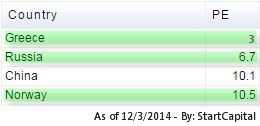
Finding low hanging fruit or stock markets that provide value is the key for investments you plan to hold for 1-3 years in length. The table below show the three countries with the lowest PE ratios and the best looking chart in terms of buying near long term support.

PEratios

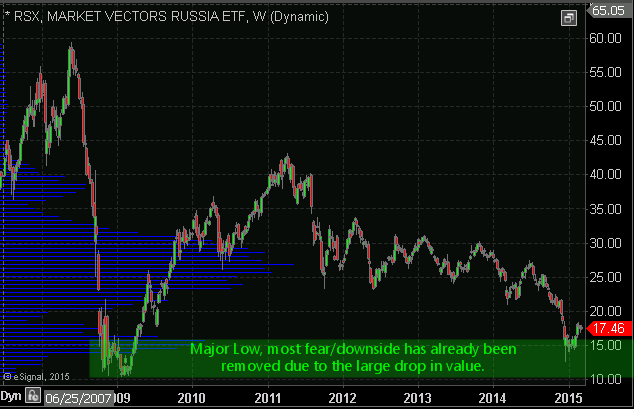
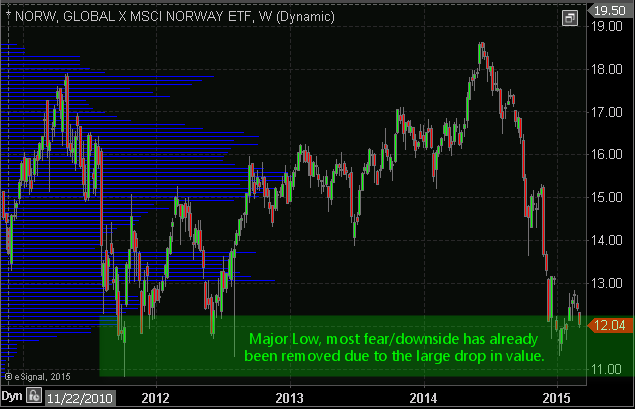
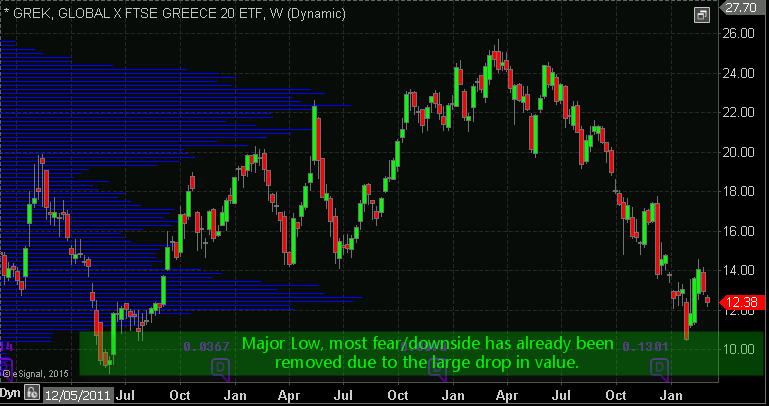
Looking at the charts you will how each of these markets has been under heavy selling along with negative headline news. Know what we know, it is very likely most investors holding equities within these countries that are scared by the news have already sold their positions. Those who have not will likely continue to hold long term for prices to rise eventually.

rsx

norw

grek


What Should You Invest In Next?

Investing is one part time, and one part timing. What I mean by that is if you have a long time 10+ years for an investment to mature you should be rewarded for holding and committing to that investment. But if you want real eye popping performance year after year it is important to try to time your entry and exits.

Every year you should review their portfolio and rebalance. Shuffle funds out of mature markets and into ones which provide more value and have room to grow in excess of 30% or more. These ETF’s I show are some of the investments I currently like.

Slowly averaging in, meaning buying a small portion ever week or every month is the best way to get involved in long term investments. I do feel these county ETFs could make minor new lows before going higher but we never really know what an investment will do and when, which is why we need to slowly build positions when you know a particular market is ripe for the picking.

FOLLOW ME AND GET MY TRADES TODAY: www.GoldAndOilGuy.com 50% OFF SPECIAL!

Chris Vermeulen

The past year month has been flowing into risk on assets like US equities. And when money is flowing into one investment class there is typically an outflow in others. Commodities in general have been beaten up bad but there is some money to be made here using the livestock COW ETF.

I is amazing how almost all us equity sectors have rallied as big as they have with many still making new sector highs. The only true weak areas in the market look to be commodities specifically precious metals, oil, natural gas, grains, sugar and livestock.

When the US equities market starts to sell off and volatility rises money should start to flow into some of these underperforming areas. At the moment COW is the only one that looks ready for a bear market rally currently.

Precious metals miners are another area I am looking to trade but I have not seen any signs why anyone should enter yet.

The chart below shows my analysis and forecast going forward. Those who prefer trading spot gold via FOREX/CDF/Spread Betting and aren’t a U.S. resident like me can use a company like AVAFX. The nice thing about trading this way is that you can trade 24/7, you get a lot of leverage, and it’s commission-free trading.
cow

To Have A Cow Or Not? That Is The Question!

The COW ETF could be a choppy ride for a while, but the upward momentum looks to have started as of today.

I am currently long COW with my peak target set around the $29 level.
Follow all my trades in real time at www.TheGoldAndOilGuy.com

Chris Vermeulen