I think you will admit that we are in the middle of one major crazy financial mess.  The part that makes things really crazy is that it’s not just in the United States anymore but rather serious global problem which if not handled properly could change the way we live our lives going forward or possibly even spark some type of war, hopefully things don’t get that crazy… But I do know one thing. Fear is the most powerful force on the planet and people do some crazy things when they are backed into a corner.

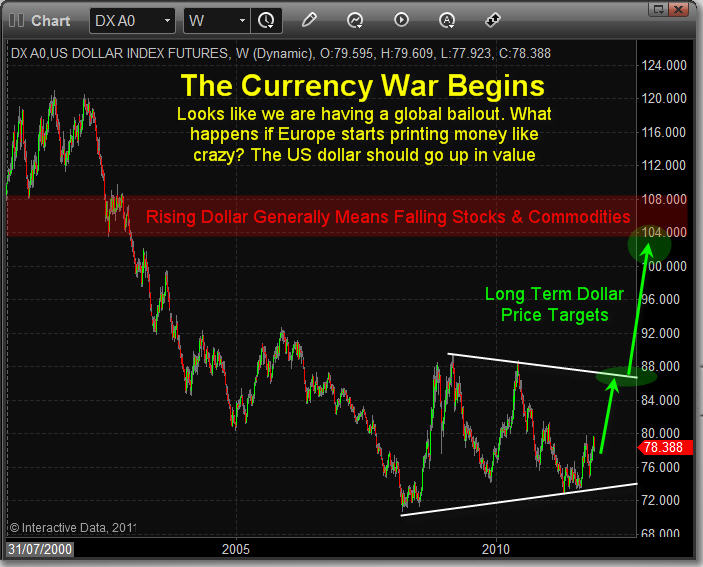
Anyways, on a more positive tone… today China decided to help provide more liquidity for the financial system along with the central banks. This news triggered a monster rally in overnight trading making the market gap up sharply at the opening bell. This news did hit the US dollar index hard sending it sharply lower but the question remains “Will today’s news be a one week hiccup in the market?” If Euroland starts printing money it will likely send the dollar higher and stocks lower for 6- 12 months.

Just today I was joking with Kerry Lutz of the Financial Survivor Network about how each country should just give each other country a second chance. Wipe the dept clean and start over knowing this time around exactly how each country truly operates at a financial level allowing everyone to avoid a repeat of this BS. Some countries will get off way better than others because they would get so much dept wiped clean but isn’t it better than years of problems and possibly wars over food, gold, guns, oil and Canadian water? – EH

All joking aside, let’s take a look at the weekly long term charts…

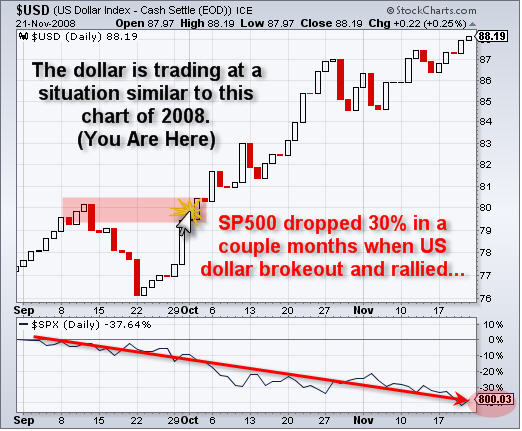
Dollar Index Showing Possible Massive Rally If Euro Starts Printing Money:

I’m sure my off the cuff options/thoughts will cause a stir but I am fine with that. Everyone I talk to is thinking the dollar is about to fall off a cliff while I think it’s very possible that it does just the opposite. Either way I will be looking to benefit from which ever move unfolds.

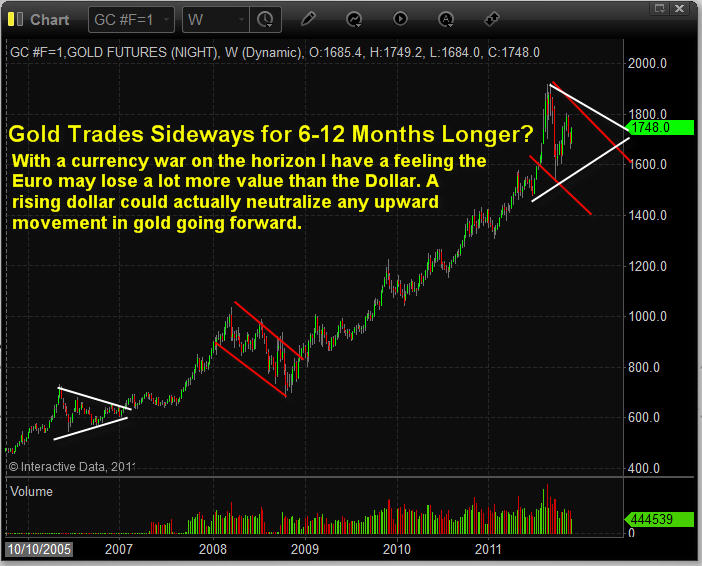
Weekly Gold Chart:


Weekly Silver Chart:


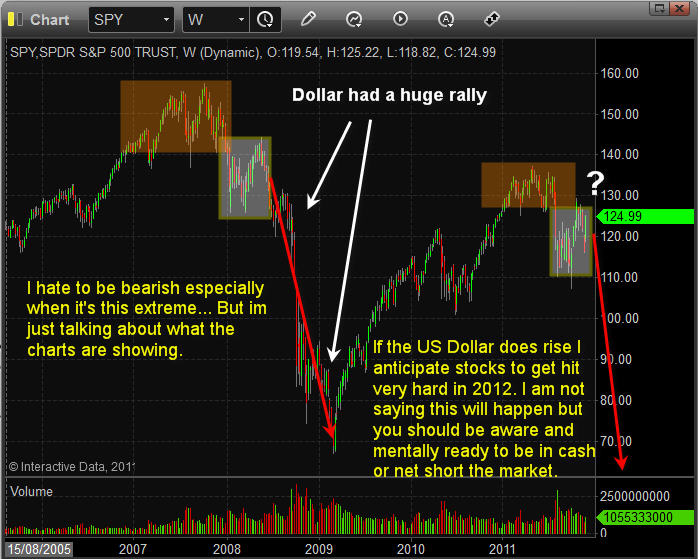
Weekly SP500 Chart:


Long Term Thoughts:

I would first like to say that tonight’s report is out of my norm. Generally I do not focus on the big picture negative stuff and I like to avoid it for a few reasons… One, it’s just downright depressing to talk and think about. And Second I don’t want to be labelled as one of those “The Sky Is Falling” kinds of guys.

So, that being said I think these charts above show a situation what is very possible to happen in the coming 6-12 months. Keep in mind that my focus is on short term time frames as it allows me to avoid and actually profit from major market moves while providing enough information for my followers to learn technical analysis and trade management. And the obvious idea of not looking too far into the future with a negative outlook…

With headline risk changing the market direction on a weekly basis, this negative outlook could easily change in a couple months. I will recap on the big picture as things unfold in January/February.

Get these Free Weekly Reports EVERY WEEK

Thus far in 2011 the overall stock market movement has been much different from what we had in 2010. This year we have seen nothing but sideways to lower prices with wild price swings on a day to day basis. There just has not been any really solid trends to take advantage of this year. Instead we had to actively trade the oversold dips and sell into the overbought rallies to just pull money out of the market on a monthly basis. Last year we saw 3 major rallies that lasted several months making it easy for anyone who bought into the trend to make money if managed properly.

Looking forward to 2012 it looks as though we are going to see some major changes unfold globally that will change the way we do things live our lives. Unfortunately its a very negative outlook but I do have hope that something will be done to perserve are somewhat normal lifestyles. I’m not one to talk doom and gloom, there are enough of those guys out there already so lets stick with the charts and focus on what is unfolding now in the present and how to take advantage of it…

The charts below show what I feel is likely to happen going into the new year IF we don’t get any major headline news in Europe that triggers another selloff.

Intermarket Analysis:

There are a lot of different things unfolding within stocks, commodities, currencies and bonds right now. And it is imporatnt to know that investments are inter-connected in some way. For example,  if one investment moves sharply in one direction it will have an effect on other investment classes.

My eye is focused on the US Dollar Index which has recently had a strong run up in price. For the past couple years we have seen stocks fall when the dollar moves up. So with the dollar index now trading at a key resistance level we should see the dollar top out for a few weeks and spark a Christmas rally into year end. After that, all bets are off and we re-analyze…

On the flop side of things, if Europe comes out with major negative headline news we could see the dollar index continue its rally and breakthrough this resistance level. If the dollar moves higher from here we could easily see a multi month run up in the dollar. You do not want to be long stocks if this happens, get short stocks and hold on tight.

Dollar ETF Trading


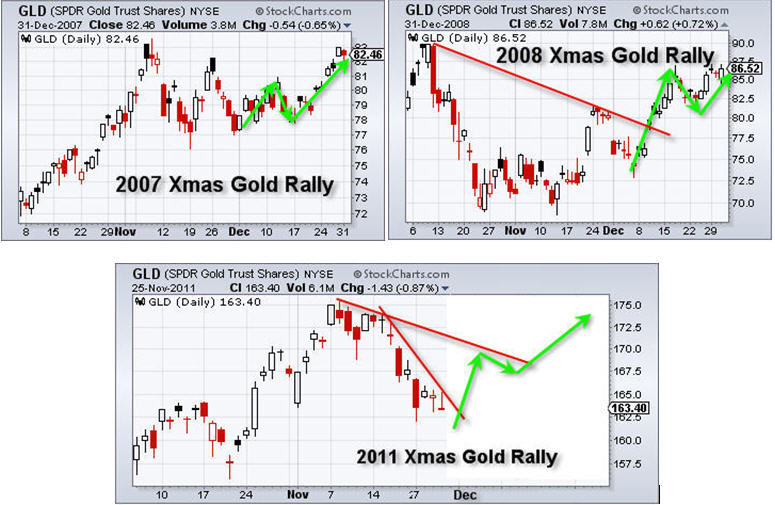
Gold Daily Chart Analysis:

Here is my positive out look for gold and what I feel is likely to unfold near term. But keep in mind what I just said about the US dollar index above. If the dollar continues its rally and breaks out it could actually put some pressure on gold. I know gold is a safe haven so I do expect it to hold up, but a strong dollar will neutralize a lot of the buying in gold in my opinion.

Gold Christmas Rally


SP500 Daily Charts:

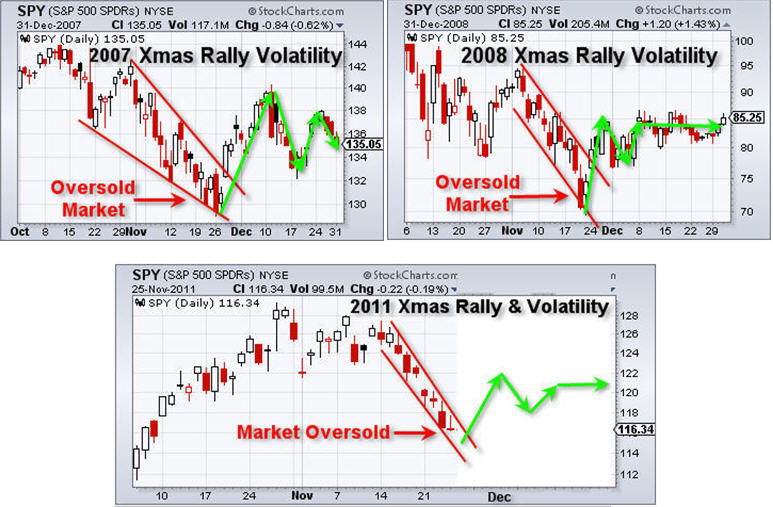
Stocks should have a solid bounce this December if the dollar finds resistance and pulls back in the coming weeks. I am expecting a bounce of 5-10% if all goes as planned.

SP500 Christmas Rally


Christmas Holiday Rally Trading Conclusion:

In short, we are entering a tough time to trade the market. Volatility is low, there are a few holidays and typically we see volume thin out as December unfolds. Light volume generally favors higher prices for stocks and commodities which is one of the reasons we get the holiday lift in prices.

The recent selloff in stocks is looking overdone to the down side and ready to bounce any day. So I am looking for signals to get long the SP500. Overall risk remains very high as sellers are still in control of the market and because we are looking to put on a trade against the intermediate trend which is down.

On Friday morning myself and my followers exited our short position on the SP500 at the open locking in 13.5% profit. We exited the position because the intraday charts are showing signs of a potential bottom and we want to avoid the tear your face off short covering rally that I feel is just around the corner. Now we are waiting for a another low risk setup and will take action to go long or short depending how things unfold in Europe.

I hope this report helped shed some light on the current market condition for you. Remember you can Get my daily pre-market trading videos, intraday updates , and trade alerts with my premium newsletter: www.TheGoldAndOilGuy.com

Chris Vermeulen

Get these Free Weekly Reports EVERY WEEK

By Chris Vermeulen: www.TheGoldAndOilGuy.com

The months of November and December are the second strongest back to back months for the financial markets. Many traders and investors use this time of the year to reap big gains as they close the year out. The fact that most traders and investors are sitting in cash and underweight stocks in their portfolio’s leaves me to believe a Santa Clause rally is just around the corner. Reason being is everyone has cash on hand to buy stocks because they are selling their positions in this pullback we are in right now. I know traders well enough, they will buy back into the market trying to catch the holiday rally in the coming weeks.

Subscribers and myself have been short the SP500 for a couple weeks after watching the broad market become overbought and sentiment levels became overly bullish with greedy pigs thinking they could buy stocks after a massive month long rally that had not pullback. Once the selling started you would either get you head handed to you or you were going to make a killing buying leveraged inverse ETFs.

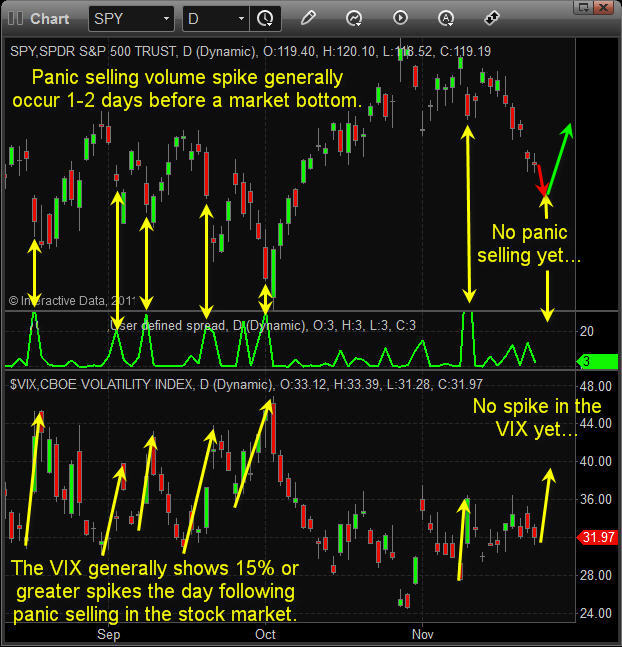
Those who arrived late to the rally are the ones selling out of their positions this week. The interesting thing about this week’s market condition is that I have not seeing any real panic selling in stocks, and I’m not seeing the volatility index spike in value yet.

What does this mean? Well it means we could actually see another big dip in the market which should last 1-2 days and then we get a sharp reversal to the upside.


Take a look at the SP500 & Volatility index below:

This chart allows us to get a feel for fear in the market. Me being a contrarian trader, I focus on market sentiment extremes. When the masses are losing money hand over fist I’m generally on the other side of that trade with open arms. Trading off fear is one of the easiest ways to trade the market. That is because fear is much more powerful than greed and it shows up better on the charts. Spotting panic selloff bottoms is something that can be traded successfully if you know what to look for and how to trade them.

On the chart you can see the pullbacks in the SP500 which triggered a panic selling spike in my green indicator. What I look for is a pullback in the SP500 and for my panic selling indicator to spike over 20. When that happens I start watching the volatility index for a spike also. The good news is that the volatility index typically rises the following day making my panic indicator more of a leading one…


Market Sentiment Trading

Market Sentiment Trading

I could write a 20 page report going into depth this with topic, but that’s not the point of this report. Just realize that the stock market is likely going to put in a bottom very soon and likely end with a STRONG panic selling washout this week or next. If you want to learn more about how to trade market sentiment and panic selling you can read my strategy which was published in Futures Magazine.

Prepare for a sharp drop in the market which should kick start a holiday rally in the next few trading sessions.

Get these Free Weekly Reports EVERY WEEK

Over the recent couple months the precious metals charts have made some sizable moves. Most investors and traders were caught off guard by the sharp avalanche type selloff and lost a lot of hard earned capital in just a few trading sessions. Gold dropped over 20% and silver a whopping 40%.

The crazy thing about all this is that these types of moves in precious metals can be avoided and even taken advantage of in certain situations. There is no reason for anyone to continue holding on to those positions after they pullback 6% of more because of the type of price and volume action both gold and silver had been displaying in the past few sessions.

I warned investors on Aug 31st that precious metals were about to top any day and that protective stops should be tightened or taking profits was also a smart move. It was only 2 trading sessions later that precious metals topped and went into a free fall. You can get my detailed analysis if you read my report Dollar’s On the Verge of a Relief Rally Look Out!”.

A couple weeks later once precious metals has found support and the uneducated investor’s were licking their wounds wondering what the heck just happened to their trading accounts… I put out another report but this time with a bullish outlook. Silver was currently trading at $29.96 and I had a $35-$36 price target over the next two months. Gold was trading down at $1611 and I saw it heading back up to $1750-$1775 area before finding resistance and pulling back. Both these forecasts were reached over the next two months. You can quickly review the report called “Precious Metals Charts Point to higher Prices” for more info.

With all that said, what exactly are the charts saying right now?

Current Precious Metals Charts Summary:

The past 6 weeks we have been watching both gold and silver struggle to hold up but they have managed to grind their way to my price targets. After reaching those targets a couple weeks ago sellers have stepped back into the precious metals market and put pressure these metals.

Last week gold and silver started to pullback in a big way with rising volume. This could just be the start of something much larger which I will cover in just a moment.

The wild card for precious metals and for every stock and commodity for that matter is Europe. Every other day there seems to be headline news moving the market and most of takes place in overnight trading for those of us living in North America. It’s this wild card which is keeping me from getting aggressive in the market right now.

Let’s take a look at the charts…

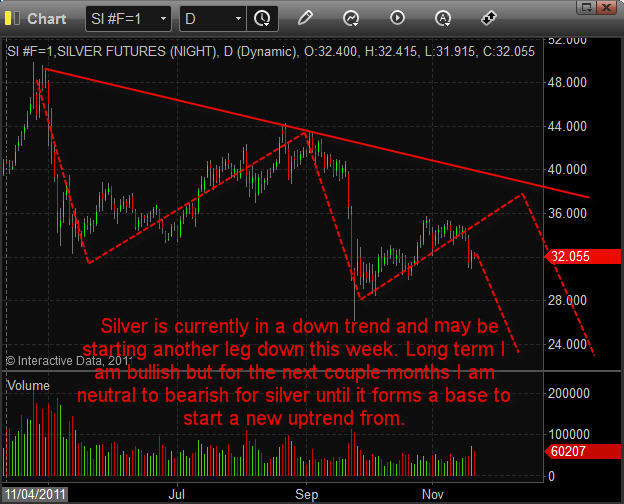
Silver Precious Metals Chart:

Silver is currently in a down trend and may be starting another leg down this week. Long term I am bullish but for the next couple months I am remain neutral to bearish for silver until it forms a base to start a new uptrend from.

Precious Metals Charts

Precious Metals Charts


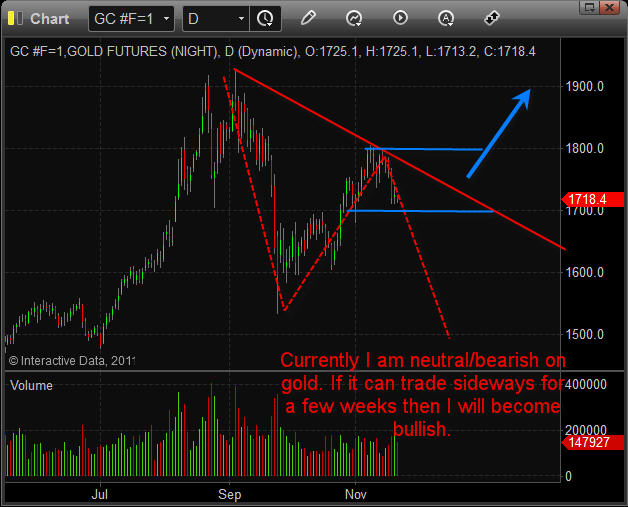
Gold Precious Metals Chart:

Currently I am neutral/bearish on gold. If it can trade sideways for a few weeks then I will become bullish.

Precious-Metals-Charts

Precious-Metals-Charts


Precious Metals Charts Conclusion:

In short, I feel there is a good chance the US dollar will continue higher and if that happens we should see strong selling in North American equities, commodities and likely on the precious metals charts.

Financial markets around the world are at a tipping point meaning something really big is about to take place. The question is which way will investment move. The only thing we can do is trade with the current trends, price patterns and volume.

At this time I still see a higher dollar and that means lower stocks and commodities. This could change at the drop of a hat depending on the news that comes out of Europe so the key to trading right now is to remain cash rich and taking only small positions in the market.

If you would like learn more about etf trading and receive my daily pre-market videos, intraday updates and detailed trade alerts which even the most novice trader can follow then join my FREE trading education newsletter and my premium trading alert service here: http://www.GoldAndOilGuy.com

Chris Vermeulen

With all eyes on the unemployment report and Europe, the CME Group’s PR Department nearly created an all out panic with their announcement after the market close on Friday relating to futures maintenance margin. The original statement was vague and I was quite concerned until I checked out the CME Group’s web-page and the PR Department sent an update clarifying their position. At this point I think the crisis has been averted, but this is just another reminder that we live in “interesting times.”

Keep in mind that if the CME starts raising margin rates across the board for futures contracts in order to protect themselves stocks and commodities could collapse. Silver recently has is margin rates increased and silver since then dropped 25% in value. So imagine if they raised the rates for more commodities…

The current price action in the marketplace pales in comparison to the world’s geopolitical tensions and deteriorating social mood. In my trading career, I have never seen the price action in the indices react so violently to intraday headlines and rumors. Risk is high and the types of traders profiting from this market are day traders and very short term traders with trades lasting  just a couple hours to 24 hours in length. Aggressive trading which small position sizes is all that can be done right now. This is not meant to be investment advice, but more as a function of the market environment in which we find ourselves currently trading within.

Right now it is hard to say where price action in the broader indices heads in the short-run.  One headline out of Greece or Italy could dramatically alter economic history. In the intermediate term I remain neutral to bearish for a number of reasons. One indicator I follow is the bullish percent index on the S&P 500 which at this point is arguing for lower prices.

The chart below illustrates the S&P 500 Bullish Percent Index:

How to trade S&P 500 Headline Driven Market

As can be seen above, the S&P 500 Bullish Percent Index is presently at an overbought status. When looking at the relative strength and full stochastics indicators one would argue that a pullback is warranted. Historically when the S&P 500 Bullish Percent Index is this overbought, a pullback ensues which ultimately sees the S&P 500 Index selloff. The more arduous task is trying to determine just how deep the pullback on the S&P 500 Index might be.

It is critical to point out that while I do believe a pullback is likely, I will not rule out a rally into the holiday season. Much of the near-term price action is going to be dictated by headlines coming out of Greece and the rest of Europe. In addition to Greece, Italy is also starting to see increased concern regarding an unsustainable fiscal condition. Depending on how the European Union handles the varying degrees of risk in the near term, we could see price action react violently in either direction.

With the market capable of moving in either direction, I wanted to point out some key price levels which should act as clues regarding potential future price action in the S&P 500. The two key support levels to monitor on the S&P 500 Index are the 1,240 and 1,220 price levels.

The daily chart of the S&P 500 Index below illustrates the price levels:

How to Trade Large Cap Stocks

For bullish traders and investors the key price level to monitor is the recent highs on the S&P 500 around the 1,290 area. The weekly chart below demonstrates why this price level is critical and which overhead levels will offer additional resistance should the recent highs be taken out to the upside.

SP500 Weekly Chart Analysis:

How to Trade Weekly Charts

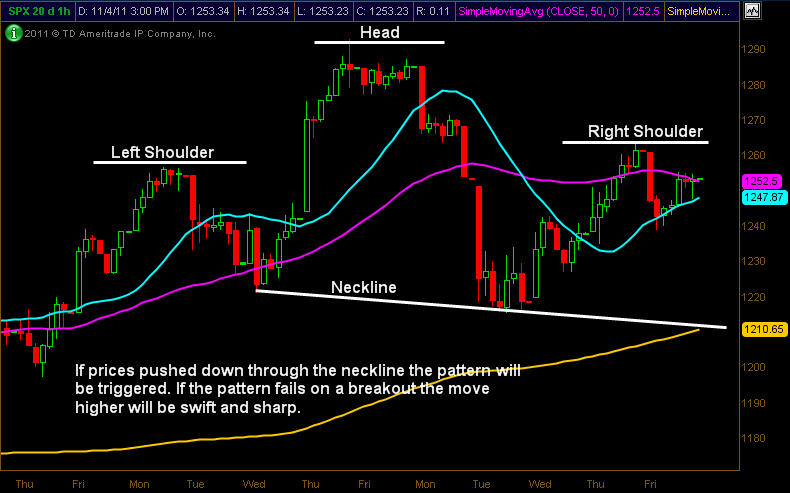
While I am neutral in the intermediate to longer term presently, in the short run I have to lean slightly bearish simply because of the future headline risk and also because a major head and shoulders pattern has been carved out on the hourly chart of the S&P 500 Index. This type of chart pattern is synonymous with bearish price action.


The hourly chart of the S&P 500 Index is shown below:

How to Trade Hourly Chart

Right now I remain slightly bearish, but should the head and shoulders pattern fail and/or we begin to see multiple positive reactions to news coming out of Europe a strong rally into the holiday season is likely. Unfortunately all we can do is monitor the key price levels and wait patiently for Mr. Market to tip his hand.

Until we see a breakout in either direction, we could see price action inhabit the 1,220 – 1,290 price range for several weeks before we get any more clarity of future direction. Until I see a breakout, I will remain relatively neutral with a slight short term bias to the downside based on price patterns in the shorter term time frames. This is a tough market to trade in, and I don’t want to get chopped around or do any heavy lifting. I’m going to focus my attention on high probability, low risk trade setups until directional biased trades make more sense.

In closing, I will leave you with the thoughtful muse of the late Texas Congresswoman Barbara Jordan,

For all of its uncertainty, we cannot flee the future.

Market Analysis and Thoughts By:

Chris Vermeulen – ETF Trading Videos & Trade Alerts

JW Jones – Options Trading videos & Options Alerts


This material should not be considered investment advice. Under no circumstances should any content from this article be used or interpreted as a recommendation to buy or sell any type of security or commodity contract. This material is not a solicitation for a trading approach to financial markets. Any investment decisions must in all cases be made by the reader or by his or her registered investment advisor. This information is for educational purposes only.