I am not one to discuss fundamentals or macro views, but this situation in Europe is beginning to morph into a media frenzy. Price action in the marketplace is changing rapidly in short periods of time based on the latest press releases coming from the Eurozone summit.

I cannot help but comment on the seemingly arbitrary actions coming from this high profile meeting. Nothing has happened that market participants were not already privy too. The European Union is going to strengthen their EFSF fund by levering it up roughly 4 : 1. I have yet to hear how exactly they plan on doing this, but this action was no surprise to anyone that has read an article about the sovereign debt crisis in the past month.

There was also discussion about backstopping European banks’ capital position. Since European banks are holding billions (Euros) of risky sovereign debt instruments, it would make sense that their capitalization is a primary concern of Eurozone leaders based on current fiscal conditions. I would argue that the banks should be well capitalized regardless of economic or fiscal conditions in order for a nation to have a strong, vibrant economy that has the potential to grow organically.

The final piece of this week’s political nonsense involves write-downs on Greek debt in the neighborhood of 50% – 60% in order to stabilize Greece’s debt to GDP ratio. Apparently Eurozone leaders want to structure the write down so as to avoid payouts by credit default swaps which act as insurance against default. How does a bond take a 50% – 60% valuation mark down without a creating an event that would trigger the payout of CDS swaps?

If a write down of that magnitude does not trigger the CDS swaps, then I would argue they are useless as a tool to hedge against the default risk carried by sovereign debt instruments. If the CDS swaps do not payout as projected by European politicians, the risk assumed by those purchasing government debt obligations around the world would be altered immediately.

The impact this might have on the future pricing of risk for government debt instruments could be extremely detrimental to their ability to raise funds in the private market. Additionally, the write downs would hurt European banks’ capital positions immediately. If the CDS swaps were to pay out, bank capital ratios would suffer as those who took on counter party risk would be forced to cover their obligations thereby straining capital positions even further potentially.

Price action today suggested that the equity markets approved of the package that European leaders were working on. However, the biggest push higher came when news was released that China was interested in purchasing high quality debt instruments as a means to help prop up poorly capitalized banks and sovereign nations in the Eurozone through an IMF facility.

The market did an immediate about-face which saw the Dollar selloff while the S&P 500 rallied higher into the close reversing a great deal of Tuesday’s losses. Inquiring minds wish to know where we go from here? I would be lying if I said I knew for sure which direction Mr. Market favored, however that did not stop me from looking for possible clues.

It has been a while since I checked out the short-term momentum charts that are focused on the number of stocks in U.S. domestic equity markets that are trading above their 20 & 50 period moving averages. The charts below illustrate the current market momentum:

Equities Trading Above the 20 Period Moving Average

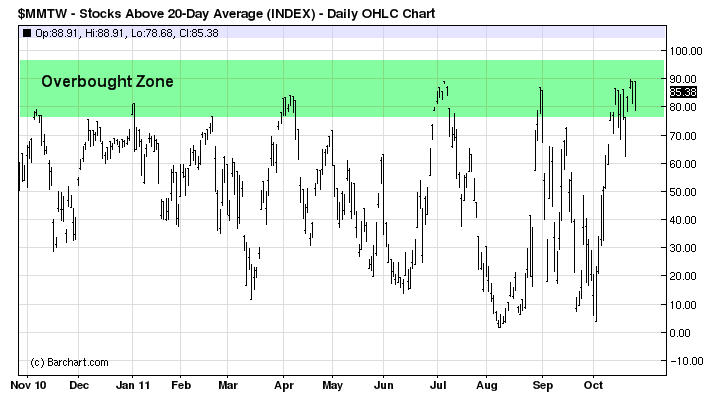
Stock Above the 20 Day Average

It is rather obvious that when we look at the number of stocks trading above their 20 period moving average that momentum is running quite high presently. This chart would indicate that in the short-term time frames equities are currently overbought.

Equities Trading Above the 50 Period Moving Average

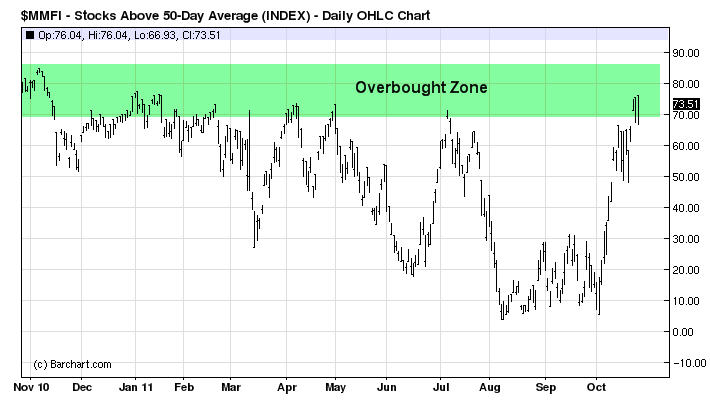
Stock Above the 50 Day Average

A similar conclusion can be drawn when we look at the number of stocks trading above their 50 period moving averages. It is rather obvious at this point in time that in the short to intermediate term time frames, stocks are currently at overbought levels. This is not to say that stocks will not continue to work higher, but a pullback is becoming more and more likely.

Additional evidence that would support the possibility that a pullback is likely would be the  recent bottom being carved out in the price action of the U.S. Dollar Index. The U.S. Dollar has been under selling pressure since the beginning of October, but has recently started to show signs that it could be stabilizing and setting up to rally higher.

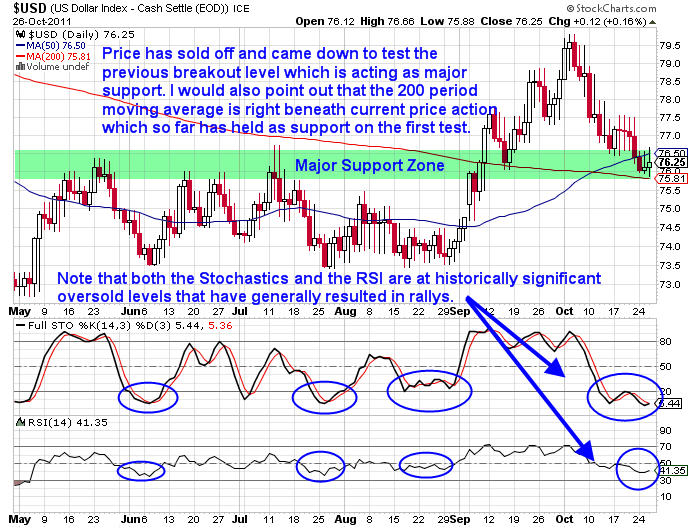
The daily chart of the U.S. Dollar Index is shown below:

US Dollar Chart

The U.S. Dollar Index is sitting right at major support and is oversold based on historical price action. If the Dollar begins to push higher in coming days and weeks it is going to push equity prices considerably lower. Other risk assets such as gold, silver, and oil would also be negatively impacted by higher Dollar prices.

Members of my service know that I focus on several sectors to help give me a better idea about the broader equity markets. I regularly look at the financial sector (XLF), the Dow Jones Transportation Index (IYT), emerging markets (EEM), and the Russell 2000 Index (IWM) for clues about future price action in the S&P 500.

During my regular evening scan I noticed that all 4 sector/index ETF’s are trading at or near major overhead resistance. With the exception of the Dow Jones Transportation Index (IYT), the other 3 underlying assets have yet to breakout over their August 31st highs. The significance of August 31st is that is the date when the S&P 500 Index put in a major reversal right at the 1,230 price level before turning lower. It took nearly two months to regain the 1,230 level and its significance continues to hold sway.

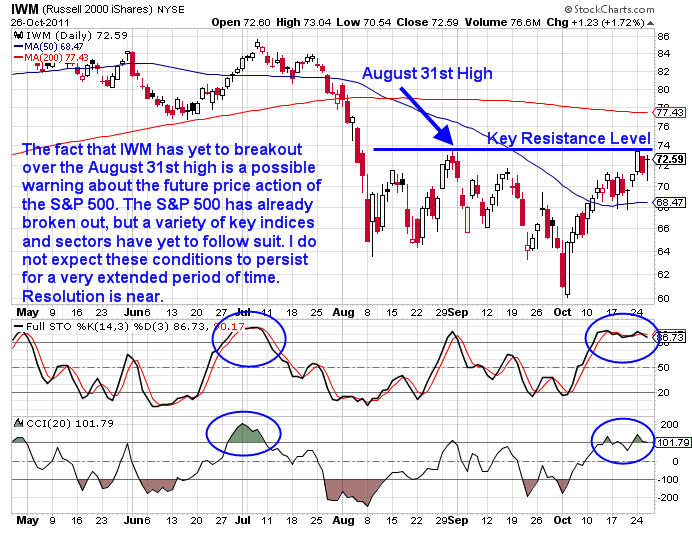
The daily chart of IWM is shown below illustrating its failure to breakout over the August 31st highs:

IWM Russell 2000 ETF

The chart above illustrates clearly that IWM has failed to breakout above the August 31st highs. I am going to be watching IWM, XLF, & EEM closely in coming days to see if they are able to breakout similarly to the S&P 500. If they start to rollover, it will not be long before the S&P 500 likely follows suit.

Currently the underlying signals are arguing for lower prices in the short to intermediate term. While it is entirely possible that the S&P 500 rallies higher from here, it is without question that current market conditions are overbought in the short to intermediate terms.

Key sectors and indices are not showing follow through to the upside to help solidify the S&P 500’s recent break above the key 1,230 price level. Additionally, the U.S. Dollar Index is currently trading right at key support in addition to being oversold. At this time I am not playing the S&P 500 in either direction, but I will be watching the underlying price action in the U.S. Dollar Index closely. I will be watching for additional clues in the days ahead.

Market and headline risk is high presently.

Subscribers of OTS have pocketed more than 150% return in the past two months. If you’d like to stay ahead of the market using My Low Risk Option Strategies and Trades check out OTS at http://www.optionstradingsignals.com/specials/index.php and take advantage of our free occasional trade ideas or a 66% coupon to sign up for daily market analysis, videos and Option Trades each week.

By: Chris Vermeulen & JW Jones

This material should not be considered investment advice. J.W. Jones is not a registered investment advisor. Under no circumstances should any content from this article or the OptionsTradingSignals.com website be used or interpreted as a recommendation to buy or sell any type of security or commodity contract. This material is not a solicitation for a trading approach to financial markets. Any investment decisions must in all cases be made by the reader or by his or her registered investment advisor. This information is for educational purposes only.

How To Trade Gold & Oil – The past couple weeks have been tough for most investors. The recent light volume rallies which have taken place in gold, oil and stocks has been generating mixed signals for technical analysts like myself. In order avoid a large draw down on your trading capital you must focus on the long term intraday charts.

What is a long term intraday chart you ask? It is simply a 4 or 8 hour candlestick or bar chart. For example the charts below in this report are 4 hour charts. So each candlestick represents 4 hours.

Why should you use these long term intraday charts instead of say a daily chart? There are four main reasons for this:

  1. If you used a daily chart then this information would be condensed showing you the daily high, low, open and closing prices. While the 4 hour futures chart shows you large multi intraday chart patterns that most traders would never see…  Patterns not seen by the average investor have a higher probability of working in your favour. Also these patterns are much larger than just normal intraday patterns which you see on the 5, 10, or 60 minute charts. Remember the larger the pattern the more potential profit there will be.
  2. These longer time frames allow us to follow gold, silver, oil and stock indexes around the clock 24/7 using futures contracts. Think about it… regular trading hours from 9:30am – 4pm ET only allows you to see 1/3rd of the price action each day. That means you are only seeing parts of larger patterns while the 24/7 contracts show you ALL Price Action.
  3. The last reason you must use futures charts is for the volume readings. Futures show real volume levels which can be used for trading. So the volume you see on ETFs will not have the proper volume levels for that specific commodity or index. More times than not it almost the opposite…
  4. My last reason for trading long term intraday futures charts is because the price of the underlying commodity or index moves true while the ETFs which try to shadow these commodities generate false breakouts and breakdowns on a regular basis. Watch my video about this here: http://www.thetechnicaltraders.com/ETF-trading-videos/TTTOct19Oil/index.html


Let’s take a look at the charts…

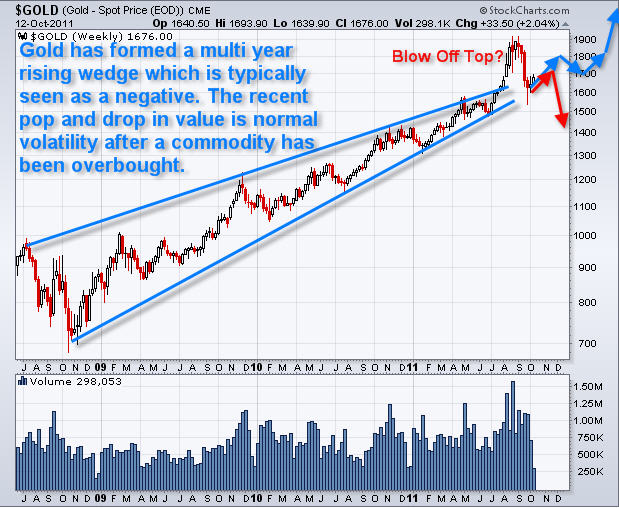
Gold Futures Contract – 240 Minute (4 Hour) Chart

Gold finally broke down from the bearish rising wedge which it had been forming through late September until mid October. I know the majority of traders, investors, and financial newsletters have already positioned themselves either long or short the metal as they anticipate the next major move.

I will agree that a large move either up or down is just around the corner but what sets me apart from others is the fact that I don’t bet my hard earned money when the odds are 50/50. I don’t pick tops or bottoms; rather I wait for a clean break out or low risk entry point. Only then will I take action. Until the blue box on the chart has been broken with some type of retest I will continue to observe and analyze the chart of gold.

How To Trade Gold


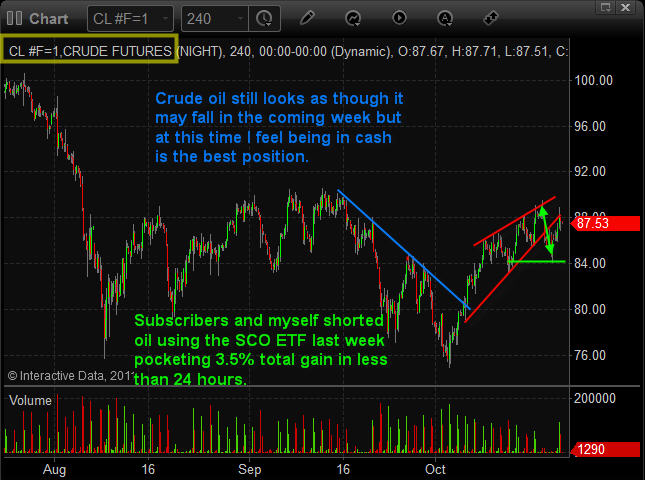
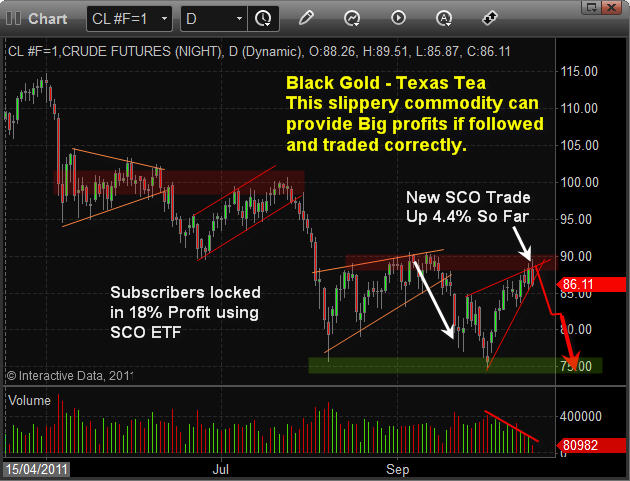
Crude Oil Futures Contract – 240 Minute (4 Hour) Chart

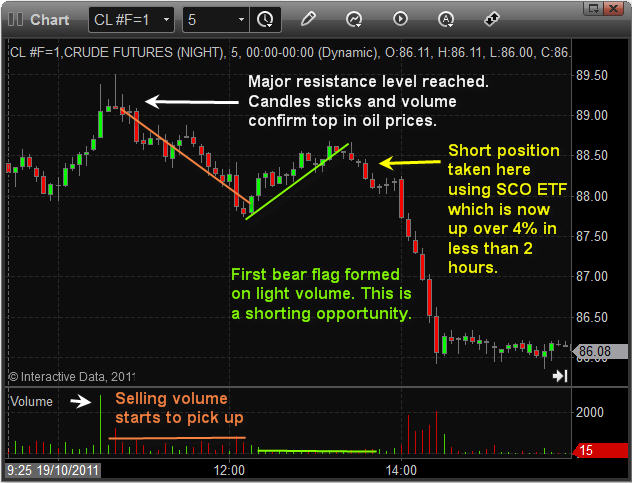
The past month crude oil trading has been very profitable for subscribers and me. We shorted crude oil using an inverse etf in September which moved over 20% in our favour within a few trading sessions. And just last week we shorted it again for a 7.5% move in less than 24 hours.

Overall I am still bearish on oil but have moved to cash until I see another high probability setup unfolding. The recent price action in crude oil makes the odds about a 50/50 bet as to which way it will break next. This is why I have moved back to cash and pocketed the quick gain.

How To Trade Oil


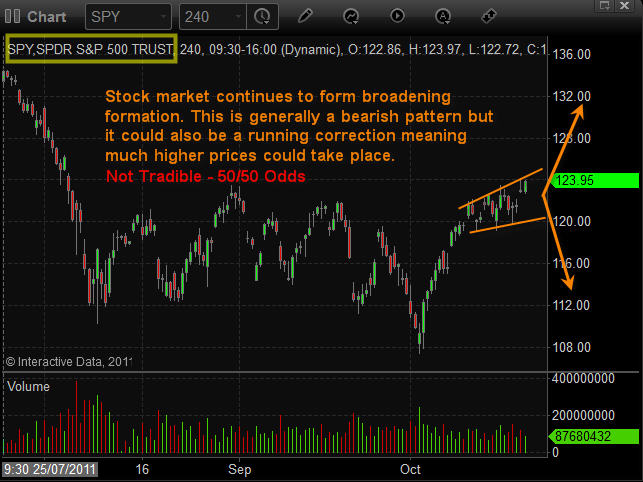
SP500 Exchange Traded Fund – 240 Minute (4 Hour) Chart

This chart is not the SP500 futures contract. This is just the SPY ETF but what I wanted to show was how the market was showing mixed signals. The past couple weeks price has been broadening and this can be taken two different ways…

More times than not it is seen as a bearish pattern and price generally falls afterwards. But in rare situations which I think we could be experiencing now this broadening price action can be very bullish, meaning much higher prices ahead. So I continue to observe and prepare for a possible trade setup.

How To Trade Indexes


Weekend Gold, Oil and Stocks Trend Conclusion:

In short, I feel the market is on the verge of a strong move. The problem is that price action, market sentiment and economic news are all giving mixed signals…

The best position right now is in cash and if something unfolds this week to our favour, then we will get involved but I am not going to take a 50/50 guess on what the next move is until the odds are in favour to one side or the other.

August until now (October 24) the SP500 is down -3.7% and Gold is up 1.1%, Silver is down 20% and oil is down -7.2. Subscribers of my newsletter have pocketed over 38.5% in total gains using my simple low risk ETF trading alerts.

Get My FREE Bi-Weekly Trading Reports and Videos by joining my free newsletter here: www.GoldAndOilGuy.com

Chris Vermeulen

If you have a website and would like these reports and videos displayed instantly on your financial website use my Best Free Financial RSS Feeds.

In May of 2010, immediately following the flash crash many investors started to become bearish (nervous) regarding their position in gold and equities. Once the general public became aware that the stock market could fall 10% in a matter of minutes, investors became very cautious. Suddenly protecting their capital and current positions was at the forefront of their investment process.

A couple days later the market recovered most of its value, but it became clear that investors were going to sell their long positions if the market showed signs of weakness. It was this fear which pulled the market back down to the May lows and beyond over the next couple months which caused investors to panic and sell the majority of their positions. It is this strong wave of panic selling that triggers gold and stock prices to form intermediate bottoms. Emotional retail traders always seem to buy near the top and sell at the bottom which leads to further pain.

Now, fast forward to today…

This past August we saw another selloff similar to the “Flash Crash” in May of 2010. (I warned followers that gold was on the edge of topping and that stocks would take some time for form a base and bottom – Click Here To Read) Over the past couple months gold, silver, and stocks have been trying to bottom but have yet to do so.

Just a couple weeks ago we saw gold, silver, and equities make new multi-month lows. This has created a very negative outlook among investors which I highlighted in red on the chart below. Since the panic selling low was formed just recently we have seen money pile back into gold and stocks (more so stocks).

This strong bounce or rally which ever you would like to call it may be the beginning stages of a major bull leg higher which could last several months. Before that could happen, I am anticipating a market pullback which is highlighted with red arrows on the chart below.

Chart of SP500, Gold and Dollar Index Looking Back 18 Months


Reasons for gold and stocks to pullback:

  • Stocks are overbought and generally retracements of 50% or 61% are common following large rallies.
  • The dollar index looks ready to bounce which typically means lower gold and stock prices.
  • Gold continues to hold a bearish chart pattern pointing to lower prices still.

Weekly Trend Trading Ideas

A few weeks ago I warned my followers that stocks and gold are forming a bottom and that we should be on the lookout for further confirmation signs. I also mentioned that I was not trying to pick a bottom, rather that I was looking to go long once the odds were more in my favor.

This is a potentially very large opportunity unfolding and there will be several different ways to play this. However, right now I continue to wait for more confirming indicators and for more time to pass before getting subscribers and my own money involved.

From August until now (October 17) the SP500 is down -6.3% and gold is down -8.1%. Subscribers of my newsletter have pocketed over 35% in total gains using my simple low risk ETF trading alerts.

I can email you my bi-weekly reports and videos by joining my free newsletter here: www.GoldAndOilGuy.com

Chris Vermeulen

Over the past year we have been learning more about the financial situations across the pond in Europe. With international issues on the rise, investors are panicking trying to find a safest haven for their capital. This money has been bouncing from one investment to another trying to avoid the next major crash in stocks, bonds, currencies and commodities. It seems every 6 months there is a new headline news issue at hand forcing the smart money to withdraw from one investment class too another hoping to avoid the next meltdown.

To make a long story short, I feel the market (stocks, bonds, currencies and commodities) are about to see another major shift that will either make you a boat load of money or you lose a lot of money if you are not positioned properly.

So the big question is “Which direction will these investments move?”

Let’s take a look at the charts…

Gold Weekly Chart – Long Term Outlook

Gold has just finished seeing a strong wave of selling this summer so it’s early to give any real forecast for what is next. That being said this long term chart may be telling us that gold’s rally could be nearing an end or a 12+ month pause could take place. If you have followed the market long enough then you realize that when everyone is in the same trade/position the market has a way of re-distributing the wealth to those who are savvy investors. Over the next 4-6 weeks there should be more price action which will allow me to get a better read for what is going to happen next.

Gold ETF Trading Newsletter


Silver Weekly Chart – Long Term Outlook

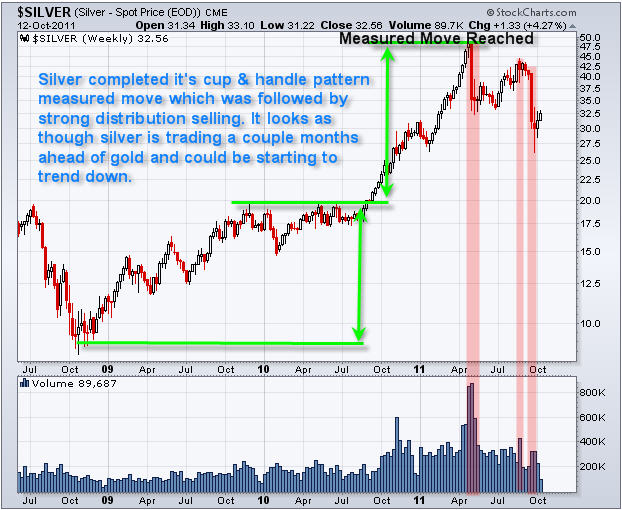
Silver has been showing strong signs of distribution selling. Meaning the big money is moving out of this industrial and highly speculative metal. The interesting part here is that silver topped out much sooner than gold. Many times in the past silver has topped and or bottomed before the rest of the market reverses direction. So it is important to keep an eye on silver as we go forward in time because it tends to lead the market 1-2 months in advance some times.

Silver ETF Trading Newsletter


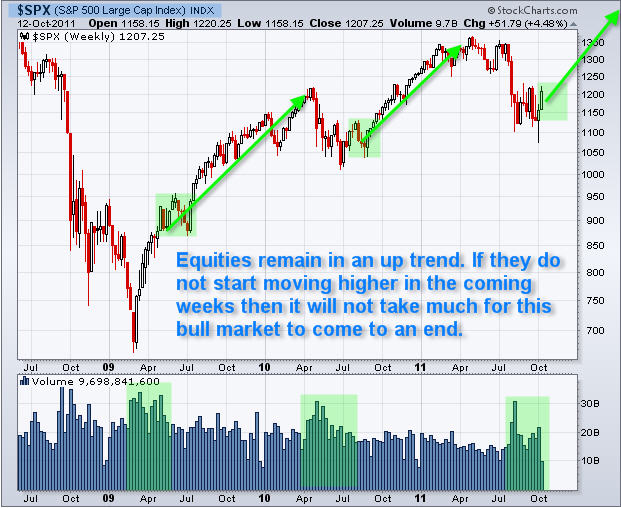
SP500 Weekly Chart – Long Term Outlook

Stocks in general are still looking ripe for another major bull market rally. But if we do not get some follow through in the coming 1-2 months then this almost 3 year bull market could be coming an end.

SPY ETF Trading Newsletter


Mid-Week Trend Trading Conclusion:

In short, the market as a whole is trying to recover from a strong bout of selling over the past few months. In my opinion the market is ripe for another leg higher. The reason I see higher stock prices is because decisions are being made across the pond to deal with their issues. Looking back it is similar to what the United States did in late 2008 – early 2009 just before the market bottomed.

Everyone right now seems to be saying Europe is screwed and that they are going about things in the wrong way, but if you think back that is exactly what took place in America not that long ago. And back then it was all over the news that the resolutions to fix the US would not work…. In the end, life continued, businesses continued to operate. Soon after decisions were made the stock market and commodities rallied and are still holding strong today.

Over the next week or two I am anticipating the market will provide some solid trade setups which I plan on taking advantage of using leveraged ETFS. During the volatile sideways market in August through till now I have navigated my subscribers using both bull and bear funds pocketing over 35% return in two months. If you would like to receive my pre-market morning videos, intraday updates and trade alerts visit my newsletter at: http://www.thegoldandoilguy.com/trade-money-emotions.php

Chris Vermeulen

The past month has been a wild ride for both equity and commodity traders around the globe. Novice traders have had their heads handed to them and their investment accounts drained. When fear, uncertainty and volatility are running high, some of the best opportunities become available to those who know what to look for. These market conditions force you to focus and strive for perfection in finding low risk entry setups and to also actively managing positions with laser focus because within hours a winning trade can turn into a losing trade.

Looking back on the daily charts of the dollar, SP500, gold, and also the overseas markets it looks as though we are nearing a market bottom. I say NEARING because I think investments need more time for the current selling pressure and bearish sentiment to run its course, which could take another few weeks and possibly a few month before truly bottoming.

Let’s take a quick look at some charts…

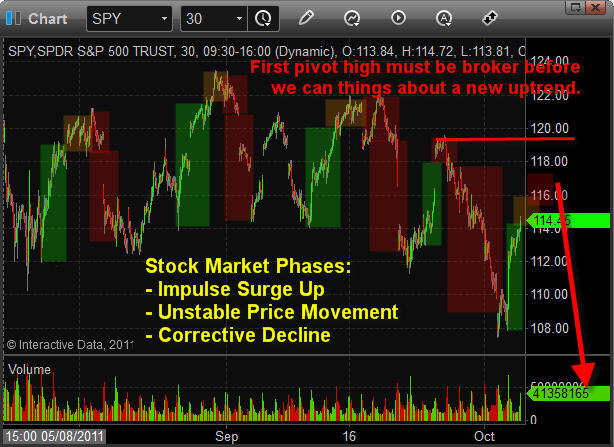
SPY 30 Minute Chart Looking Back 2 Months

As you can see below price action has been wild. But for subscribers to my newsletter it has been a fun and exciting time having pocketed over 40% return from August 1st – up until today.

The point of this chart is to show you the basic market phases (Impulse, Uncertainty, and Corrective). Understanding how to identify each phase using momentum, price action, volume analysis and market sentiment is crucial for success in today’s volatile market. Once mastered you can trade virtually any investment with a high level of confidence, though I recommend mastering 3-4 investments at most and just trading those full time with pinpoint accuracy. Through my newsletter members learn exactly how to read the market and manage positions from my daily video market analysis, intraday updates, trade alerts and trading tips.

As you can see below I am anticipating weakness in the market over the next few days. Once those levels are reached or if the charts start hinting that a reversal back down is imminent I will be ready to take action using an inverse leveraged ETF.

Index ETF Trading Newsletter


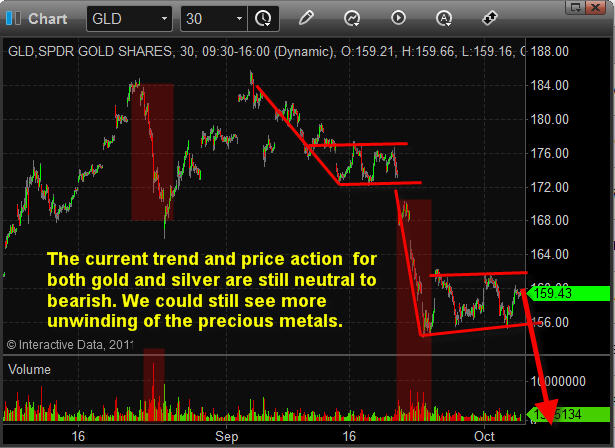
Gold 30 Minutes Chart Looking Back 2 Months

This chart will piss some people off for sure… but the chart to me is still pointing to lower prices at this time. Until we get a breakout above the upper resistance level I am not bullish on gold. Keep in mind that during strong selloffs in the stock market almost all investment drop together (gold, silver, oil, stocks).

Gold ETF Trading Newsletter


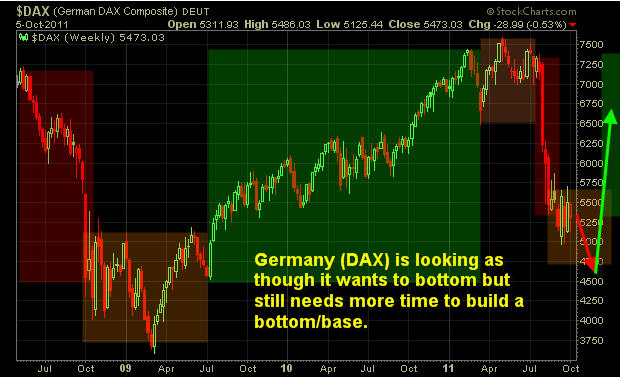
German DAX Daily Chart Looking Back 3 years

This chart shows the long term chart of the DAX which I think is giving us some insight to a global market bottom in the coming months. You will notice I painted the phases over the chart and where I feel the market is trading and where it is headed looking forward.

Dax ETF Trading Newsletter


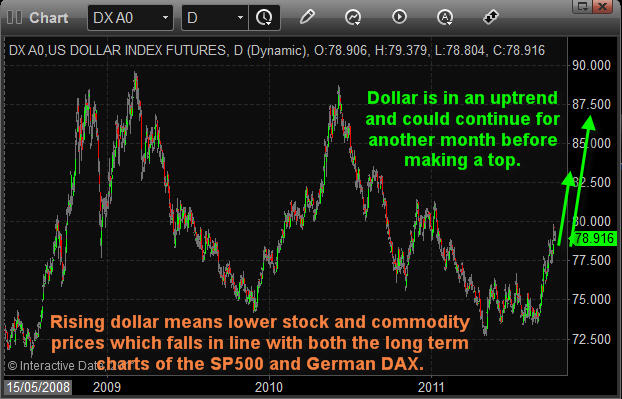
Dollar Index Daily Chart Looking Back 3 Years

The dollar also shows us three years for price action. If this strong rally continues in the dollar we will see lower stock and commodity prices for a few more months.

Dollar ETF Trading Newsletter

Trend Trading Idea Conclusion:

In short, I feel we have some very exciting times ahead along with huge potential trades starting to unfold. While I don’t want the market to collapse I will admit I prefer trading the short side of the market because fear is easier to trade than greed, not to mention prices drop much quicker than they rise… I’m sure you like making money fast also… J

I can email you my bi weekly reports and videos by joining my free newsletter here: www.GoldAndOilGuy.com

Chris Vermeulen

It seems everyone is looking for a place to put their hard earned money as uncertainty around the globe continues to rise. Oil, Gold, and Silver which have been the hot investments for the past few years took it on the chin over the past month with oil falling 13%, gold dropping 15%, and silver with a whopping 30% decline. We did actually see sharply lower prices, but last week these oversold commodities had a bounce and recouped some of their losses.

It has been a month since I covered the dollar index in detail and back on August 31st I pointed to a potentially large shift in the US dollar. The charts were pointing to a sizable rally which would likely send stocks and all commodities crashing lower. Since then we have seen just that and the so called safe havens (Gold, Silver, Oil) have dropped taking most investment and retirement accounts down with them. I did talk about these so called safe havens a couple weeks back stating my point of view on them.

My Cole’s Note Summary: “I do not consider any investment vehicle a safe haven if it can drop 15% in value within 1-2 days. And I would never put a large position of my account especially a retirement account into these investments if I were over 50 yrs of age.”

So where are the big, smart, and conservative traders putting their money to work?

Let’s dig down and take a quick look at the charts…

The 20 Year Bond – Daily Chart:

US Dollar – Daily Chart:


Utility Sector (Dividend Paying Stocks) – Daily Chart:


Weekend Trading Conclusion:

In short, I feel both stocks and commodities are oversold but need more time to bottom and we may see a few more days of lower prices in the near future. I see the dollar starting to get toppy on the daily chart and once that rolls over then stocks should bottom along with gold, silver, and oil.

Once equity prices start to bounce I anticipate money to flow out of the safe haven (Bonds) and into stocks where there are much larger potential gains to be had. All this could play out in a couple days so I am keeping a very close eye on everything.

Last week we bought the inverse SP500 etf (SDS) anticipating another surge higher in the dollar which would send stocks down in value. So far we are sitting with a gain of 8.2% and the potential for another 4 – 10% if things play out as I expect. If you would like to receive my daily pre-market trading videos so you know exactly what to expect each session along with my ETF trades be sure to join my free newsletter and get my free book here: http://www.thegoldandoilguy.com/trade-money-emotions.php

Chris Vermeulen

Get these articles, reports and videos directly and instantly on your website using the Best Financial RSS Feed