Over the past couple months everyone seems to have been preparing for a sharp market correction. Crazy part is that the SP500 dropped about 10% from the high and that is a typical bull market correction. The thing is… the stock market has a way of slowly unfolding making it look and feel minor, then before you know it, the correction is over and it’s back to an uptrend. That is kind of how this one unfolded.

The good news is that we caught the low risk portion of the correction locking in a 4.5% drop, and we are now in a long trade and in the money by 2.5% with very little down side risk at this point. Time will tell if this up trend is sustainable or not…

Now, let’s take a look at the charts…

Dollar 60 minute intraday chart
As you can see below the dollar looks to have started a breakdown today. If there is continued selling pressure in the next couple days then expect to stocks and commodities to move higher as the US Dollar drops. It is important to know that when a bullish pattern fails we typically see a very strong reaction in the opposite direction (down) catching the majority off guard and they rush to the door.

SPY Broad Market ETF – Daily Chart
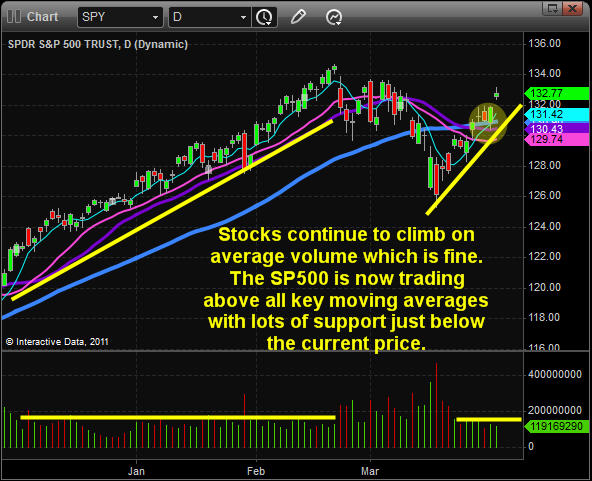
A couple weeks ago we watched the market go into a free fall creating a washout bottom. From there we saw prices bounce back and retake my key moving averages. This gave us a bullish bias and dips should be looked at as buying opportunities. I will admit that stocks still have a long way to go before the masses are convinced. I feel we need to see the February and March highs get taken out first. Once they get taken out there should be strong buying as short covering (protective stops from traders who are short) causes a surge in buying pressure sending stocks sharply higher yet again.

My trading buddy David Banister at Active Trading Partners is starting to see small cap stocks come back to life. Money is starting to flow into these lucrative areas of the market and he is on top of things… This week’s trade is up 20% in less than 24 hours which is very exciting.

Gold Daily Chart
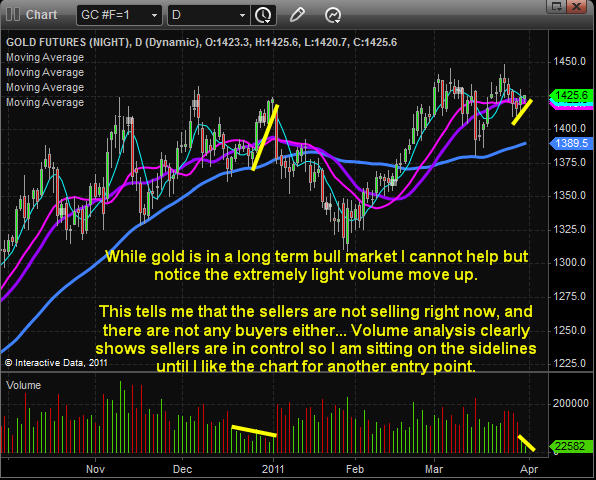
Gold has been moving up this year but the current price action is not really getting me excited to buy just yet. Recently we have seen strong selling volume and very light buying volume. My bias still favors higher prices but there is still a good chance we get another dip in the coming sessions.

Mid-Week Trading Conclusion:
In short, I feel as though the dollar will trigger the next wave of buying in stocks and commodities for the next week or two… We should see the dollar make a clean moving in either direction shortly and that will help guide my analysis, positions and setups. I hope this analysis helps you to see the market from a different perspective.

If you would like to get my mid-week reports free please join my free newsletter here: http://www.thegoldandoilguy.com/trade-money-emotions.php

Chris Vermeulen

Equities and Precious Metals are on the edge of another rally and it could start as early as tomorrow.

On March 13th I posted some of my analysis online showing how the market was trading at a key pivot point and that a sharp price movement was about to unfold. I also provided everyone with the direction in favor which played out perfectly catching a 4.5% in three days.

As of today we are getting the same setup I saw on March 13th, but this time it’s pointing to higher prices. Take a quick look at the charts I was looking at for both the SP500 and gold and you will notice that the SP500 and gold both moved to the support levels before starting to bounce: http://www.thegoldandoilguy.com/articles/it%E2%80%99s-do-or-die-week-for-equities-and-gold/

While we caught the move down on the SP500 playing the SDS Double leveraged inverse fund we did not take part in falling gold prices. Reason being, there is so much fear in the market and the amount of surprise news popping up each week I don’t think shorting precious metals is a safe call. Rather I am looking for a pullback to cleanse the holders of the commodity then I will buy once price confirms the continuation pattern has completed.

Now, stepping forward to this week’s price action

SPY Daily Chart
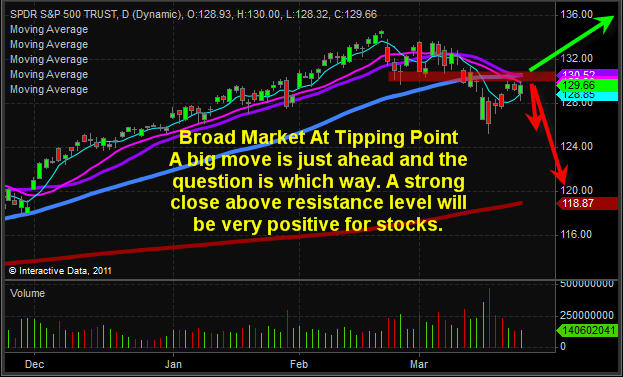
We can see in the chart below that price is currently testing a key resistance level. Before the week is over we could see some big price movement equities. I need to see what happens tomorrow but I have a feeling we could see a breakout to the upside for a long position.


Gold Miners Fund Daily Chart
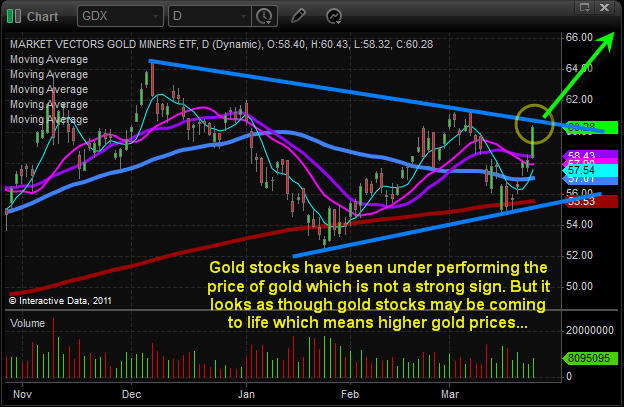
Gold stocks have be under performing the price of bullion for a few months but it looks as though they could be starting a sizable rally. If gold stocks continue to move sharply higher out of this pattern, then it’s a positive sign that gold and silver bullion will both continue to move up.


Gold Daily Chart
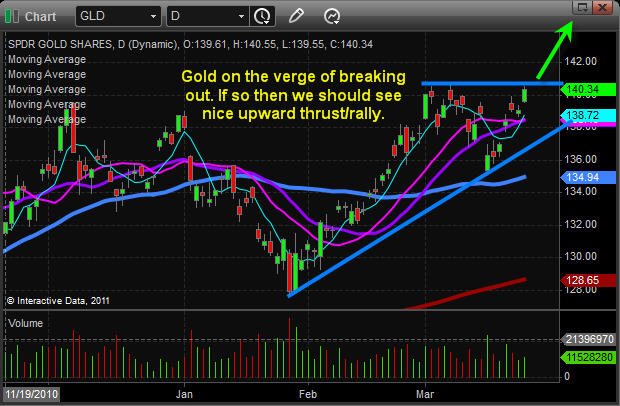
Gold is testing a key resistance level and if it breaks above this pattern then expect much higher prices. I can see GLD moving up $5 from this level and gold futures moving up $60 per ounce fairly quickly.


Mid-Week Trend Report:
In short, stocks and commodities may have shaken the weak positions out of the market during the recent pullback in price. Things could be ready to start another multi month rally and trade setups. Keep your eyes on the charts…

Get these reports sent to your inbox each Sunday & Wednesday: http://www.thegoldandoilguy.com/trade-money-emotions.php

Chris Vermeulen
?

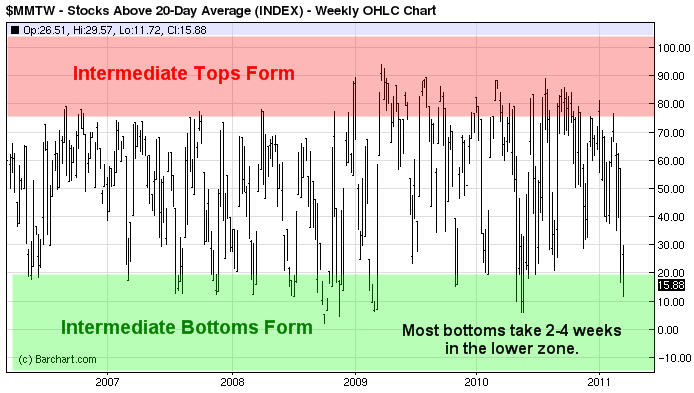
Over the years I have found an indicator/trading tool which I find help spot intermediate trend reversals. I am going to quickly cover in this report. As most of you know the 20 simple moving average is a great gauge for telling you if you should be looking to buy the dips or sell the bounces. It’s an indicator I keep on the broad market charts like the SP500, Dow and NASDAQ.

The chart below shows the percentage of stocks trading above the 20 moving average. When this indicator falls below 20%, I make sure I start to protect my short positions with more aggressive protective stops and keep an eye on short term sentiment, volume ratios, options and price action as a bottom can take place at any time and very quickly. Bottoms tend to be more of an event happening quickly with a washout/panic selling day followed by a sharp rally, while intermediate market tops drag out taking weeks if not months to roll over and are very difficult to trade which is what we have been experiencing so far this year.

Mr. Jones once of my trading buddies who focuses strictly on Options Trading has been cleaning up with the current volatility making 21%, 50% and 67% returns on his last threes trades. This guy loves volatility and always seems to have an options strategy for every situation the market dishes out. Check out his service at OptionsTradingSignals.com

As you can see this indicator is currently trading in the lower reversal zone and I feel a bottom will form before March is over.

SP500 Daily Chart
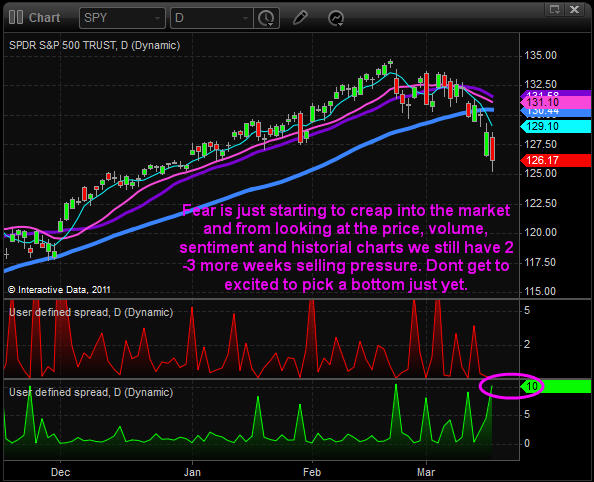
The SP500 continued lower today, which is what I mentioned, would most likely take place in my pre-market video this morning. The trading session was a roller coaster with news on Japans reactors causing large waves of buy and selling throughout the day. I have not seen traders follow the news so close like this in some time… Everyone has their fingers hovering over the buy and sell button these days.

Looking at the bottom indicator which is my gauge of panic selling within the market, it has yet to close above 15 which is the minimum number I typically look for before I start zooming into the intraday charts for a long entry (market bottom). We still could see much lower prices before we see that.

Gold 4 Hour Chart
This chart is the same one I showed in my Sunday night report, which explained why gold should test the $1380-90 level in the coming days. We did see that unfold this week but now the chart is pointing to possibly even lower prices with a support range between $1360 -1380 taking place this week. Keep an eye on it as it should be swift if it does occur.

Mid-Week Trend Report:
In short, we are finally getting the correction everyone has been waiting for and now that it’s started and we are short, we must start watching closely for a bottom because they can take place very quickly.

My focus is still on playing the short side but I have my antennas up just in case signs of a bottom start showing up.

If you would like to get my free weekly reports please visit my website: http://www.thegoldandoilguy.com/trade-money-emotions.php

Chris Vermeulen
The past couple weeks have been choppy in the equities market. While the strong intraday moves are great for day traders, it is extremely difficult for swing/position traders who normally hold positions for 3-60 days in length, which is my focus with this newsletter. That being said, we are reaching a do or die point for the equities market and next week there should be a strong move out of this trading range.

On the volume side of things, we have been seeing distribution taking place. Heavy volume continues to step into the market unloading large amounts of shares. The interesting part is that the majority of traders are bullish and sentiment levels are at extremes. Also, we are seeing the retail trader enter the market… What does this mean? It means we must trade very cautious and large positions on the long side shouldn’t be taken. The selling volume and extreme bullish sentiment are warning us that a correction is near.

There are a few things I watch to identifying trend reversals and they are accumulation or distribution of shares, Extreme sentiment readings, Market internals/breadth, and if the price relative to the 20 SMA. Currently we are seeing all the signs of a reversal to the down side, but it has yet to be confirmed.

My trading buddy JW Jones who focuses strictly on Options Trading has been cleaning up with the current volatility making 21%, 50% and 67% returns on his last threes trades. This guy loves volatility and always seems to put together an option play with very little risk yet big upside potential.

Let’s take a look at a couple charts…

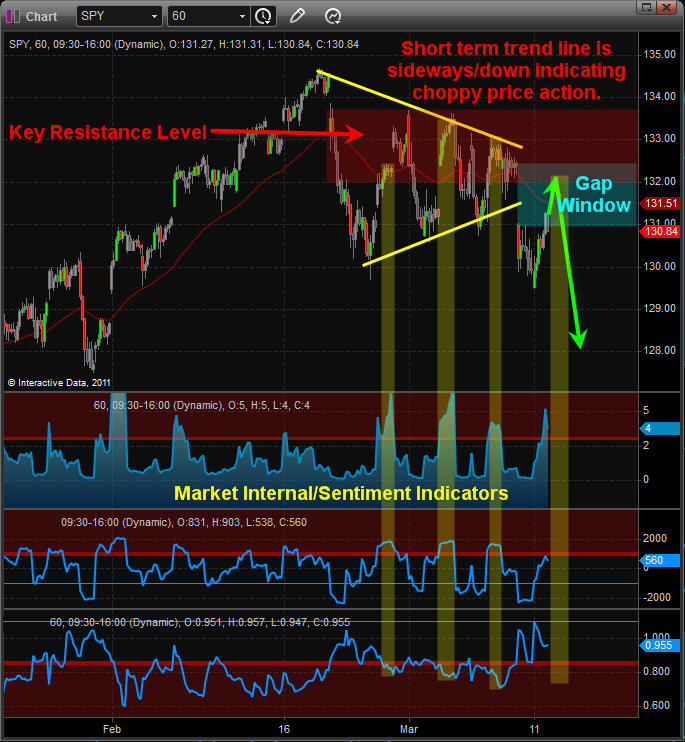
SP500 60 minute chart going back 2 months
This chart shows a possible trend reversal unfolding. We are seeing distribution selling, lower prices with the current price trading under a key resistance level. Also my internal/sentiment indicators are showing waves of buying/bullish market action which is quickly met with strong selling pulling prices back down.

Trading during trend reversals is difficult because the potential downside risk is higher when entering a position. If traded, only small positions should be taken until a trend is established, then you can build/add to your position on pullbacks or bounces depending on the direction in your favor.

My current bias is for lower prices in the coming days, but until we break above February’s high or Last week’s low with strong volume it’s a little more of a guessing game. If we see the SP500 rise early next week and fill the gap and the market internal indicators show extreme short term overbought conditions, it will make for another great low risk shorting opportunity. Shorting just under a key resistance level means the protective stop is only 1-2% away from our entry point and makes for a solid 1:3 risk/reward ratio. On the flip side, if the market has a strong rally and closes above the key resistance level then the tables will have turned and a new up trend should start.

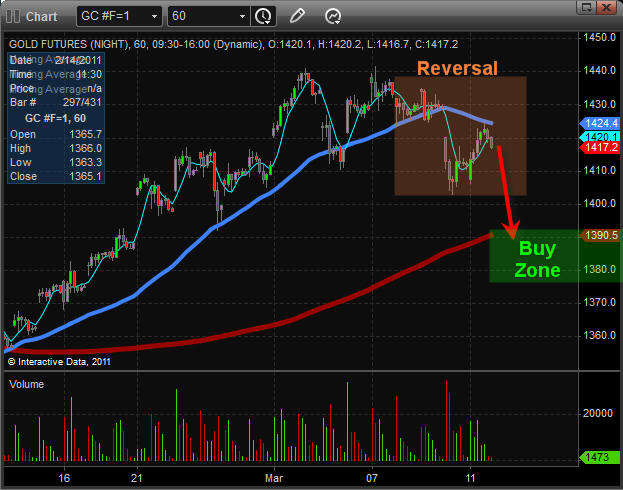
Gold 60 Minute Chart going back 2 months
Gold has had a nice push up in the past few weeks due to the issues in the Middle East. We saw this yellow metal make a new high but has since pulled back down and could have another move lower in the coming week. The $1380-1390 level should act as a strong support zone. The daily and 60 minute chart both show support at that area. Silver is in the same boat. Keep an eye this…

Weekend Trend Analysis:
In short, stocks and commodities are nearing a tipping point and there should be a large move in either direction starting this week if all goes according to plan. The big question is which way are prices going to go? My current bias is for more downside until we see a good washout in the market. It could be 2-8% lower from where the market closed on Friday. After that I think a grind higher into May could easily take place but we will see how the charts unfold going forward.

Each week there seems to be some type of surprise economic, political or natural disaster of some sort making trading not only tougher to trade but riskier because price swings are large. Keep trading to a minimum and small for now.

Get these reports sent to your inbox each Sunday & Wednesday: http://www.thegoldandoilguy.com/trade-money-emotions.php

Chris Vermeulen
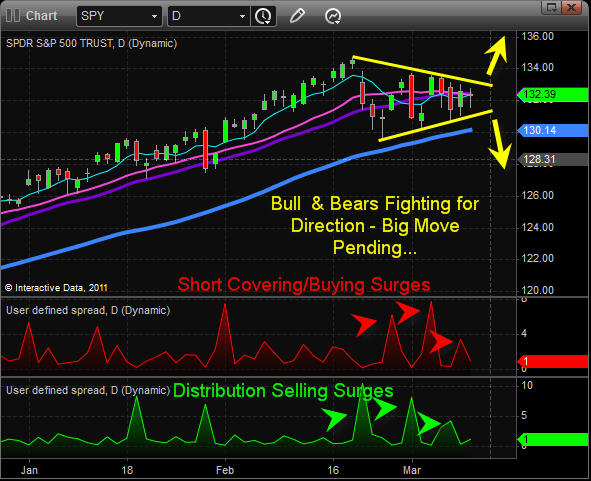
The past couple weeks we have seen strong distribution selling in the equities market followed by equally large days of buying. These buying and selling frenzies have formed a sideways consolidation.

Intraday movements have been sizable and more than enough to shake those trying to pick a direction early out of the market a few times. As fewer traders get involved the price range narrows and becomes compressed. Eventually there will be a breakout in a direction on heavy volume and with any luck it will start a new trend.

As much as I love to trade, I have been sitting on the sidelines for a few weeks giving this market some time to sort it’s self out… As we all know there are times when you get really aggressive and other times when it’s best to stand aside.

It is very important to note that each trader sees the market in a different way and once it is aligned with what you are comfortable with trading, only then should you step in and trade. If not, then it’s best to wait for more favorable price action. It took me years to figure this out but now that I know what I am looking for and on what time frames, trading is less stressful and I know I don’t need to be trading all the time, there is always another opportunity just around the corner…

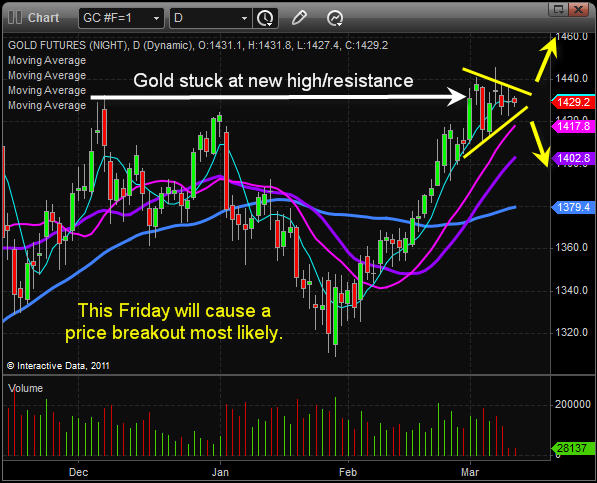
Gold has been trading sideways for almost two weeks now as it tries to break free of the December high. It is much in line with the SP500 chart above. I feel Friday or early next week that the market, dollar, metals and oil make some sizable moves either up or down…

Mid-Week Conclusion:
In short, I don’t think it is wise to jump the gun and take on any large positions until we see what happens on Friday overseas…

If nothing happens which is kind of what I am thinking, we should see the extra fear value come back out of the price of gold, silver and oil (drop in price) and possibly help boost equity prices.

Get these free weekly reports and trade ideas to your inbox: http://www.thegoldandoilguy.com/trade-money-emotions.php

Chris Vermeulen
Trading with multiple time frames – Every now and then it’s always a good idea to look at some different time frames to be sure you have a solid understanding for the longer term trends in play. I will admit that it’s easy to get caught up in trading the shorter time frames like the 1, 10, and 60 minute charts especially when there are large intraday movements. But every night you must reset your thinking by looking at the bigger picture.

Below are weekly and daily charts which I think provide a big picture view of things.

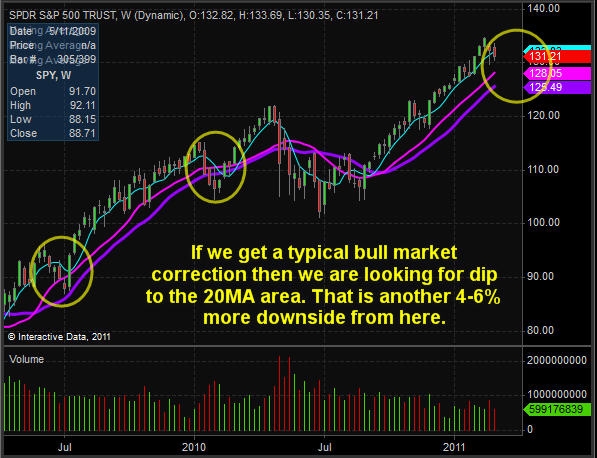
SPY – SP500 Index Fund – Weekly Chart
You will see that in both 2009 and 2010 we saw a 5-8% correction down to the key moving averages. I feel that we are in store for a similar pullback in 2011. After that we will most likely continue higher.

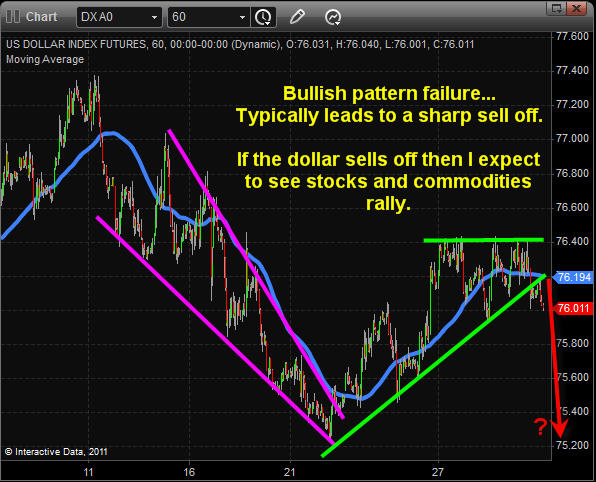
US Dollar Index – Weekly Chart
The dollar is trading down at a key support level which I am keeping a close eye on. If we get a close below this trend line then we should see the dollar sell off sharply which in turn will trigger another leg higher in commodities across the board.

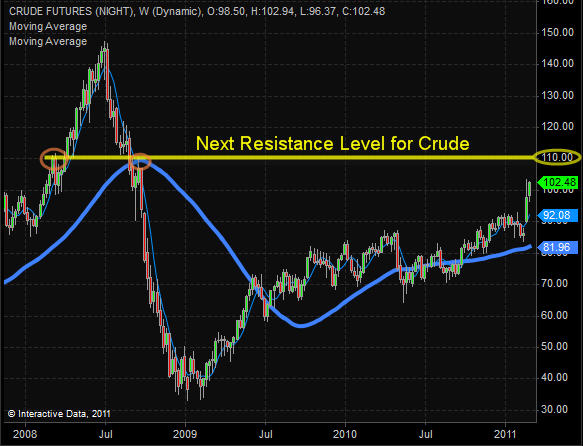
Crude Oil – Weekly Chart
Crude oil has really taken off because of the fears coming out of the Middle East. From the looks of it the next key pivot level is the $110 level.

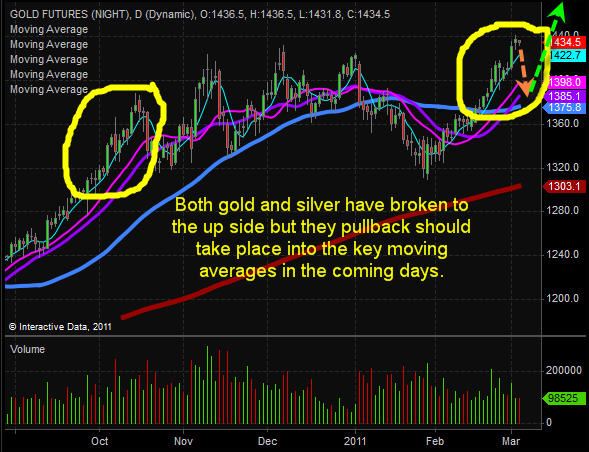
Gold – Daily Chart
Both gold and silver have made new highs but after such a run I expect we see a quick pullback before they go higher. Gold and silver are the two investments I think everyone should hold a core position for the long run no matter what happens to the price. But, if we do get a nice quick pullback into the key moving averages then I think it’s a great spot get involved with more money.

Mid-Week Trend Report:
In short, I am bullish on stocks and commodities and bearish on the dollar and bonds. The one issue I see going forward is that if the dollar breaks down it will most likely help boost oil prices which in turn puts downward pressure on stocks… So depending on how things unfold in the Middle East and a falling dollar, we may not see higher stock prices. Some individuals are forecasting $150-220 per barrel and I know if it gets back up there it will definitely slow the economy and stock prices down…

That’s it for now, but if you would like to these reports sent to your inbox be sure to join my free newsletter: http://www.thegoldandoilguy.com/trade-money-emotions.php

Chris Vermeulen