Today we had a reversal day for the broad market, us dollar, precious metals and oil. The market is over extended. We have seen the market rally 20% since the July low.

Inter-market analysis is important to understand because everything is related in some way. The next month will be very interesting with the US dollar trying to rally, which will put pressure on precious metals, stocks and commodities.

DIA ETF – Dow Industrial Fund
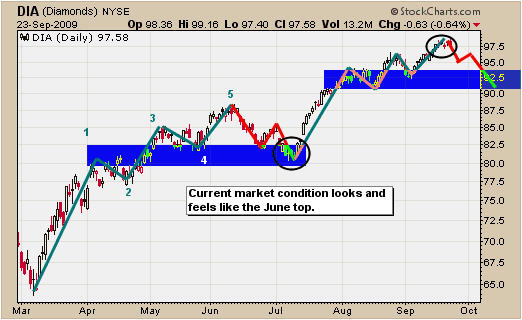
Stocks look to have formed a similar pattern as the March rally this year. The market has the same feel and price action that we saw during the June high, which is telling me we should move stops up to protect profits. Wednesday the market had an intraday reversal and that is a sign of weakness. The past four trading day’s is the same as the July bottom (multiple Doji Candles). Doji candles indicate a possible reversal.
DIA ETF Trading Newsletter

DIA ETF Trading Newsletter

Broad Market Volatility Index
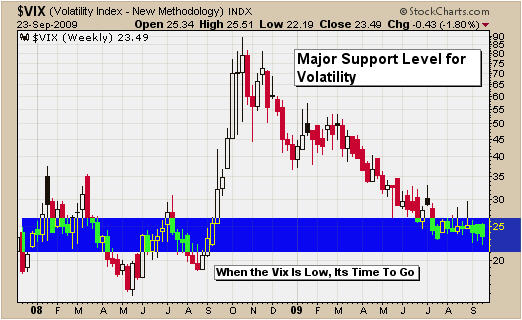
Here is a weekly volatility chart that shows we are at a long term support level. The saying is, buy when the VIX is high, sell when the VIX is low. Just to be clear, I am not saying sell everything. I am just pointing out that the market is ready for a multi week correction. I am tightening my stops and limiting my position size for new log positions.
VIX Volatility Index Trading

VIX Volatility Index Trading

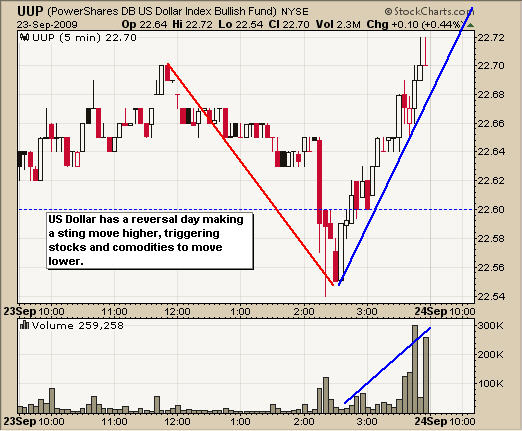
UUP ETF – US Dollar Intraday Price Action
The dollar sold down Wednesday, then rallied very strong into the close, indicating a shift in momentum. The dollar has been trending down for several months and ready for a bounce.
UUP US Dollar Trading Fund

UUP US Dollar Trading Fund


Precious Metals Under Pressure

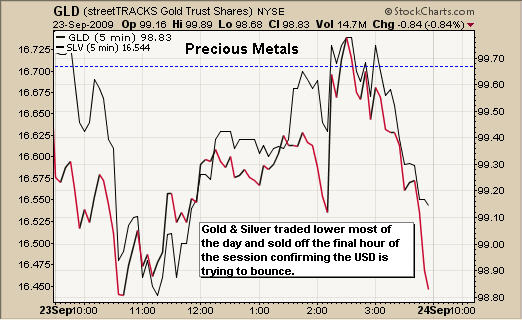
Below is a chart of Gold and Silver showing the weakness on Wednesday and the sharp sell off late in the session, when the US dollar started to rally.
Precious Metals Trading Newsletter

Precious Metals Trading Newsletter

XLE Energy ETF – Intraday Chart
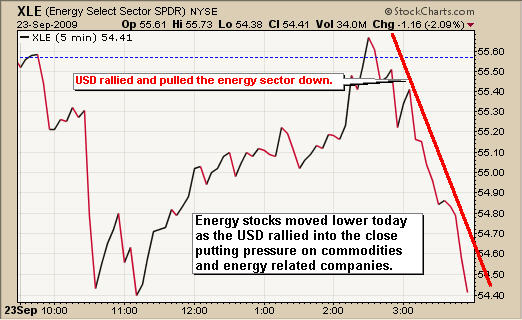
Energy sector moved down in the morning and managed to wiggle its way back to positive territory late in the day, but when the US dollar rallied, crude oil and the energy sector sold off sharply.
XLE Energy Trading Newsletter

XLE Energy Trading Newsletter

Inter-Market Analysis Conclusion:
In my opinion things look to be setup for a multi week shift in momentum. It looks like the US Dollar will bounce putting pressure on precious metals, stocks, and commodities like crude oil.

Stocks look ready to correct and a bounce in the dollar will trigger the correction.

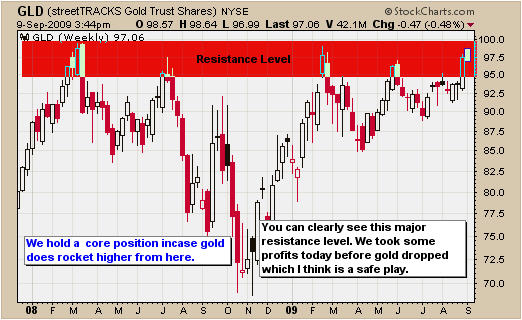
Gold is at a major resistance level, and taking a breather at this level would be normal price action. Gold has also been trading in sync with stocks, so this relationship is most likely still in place. If stocks move down, so will gold.

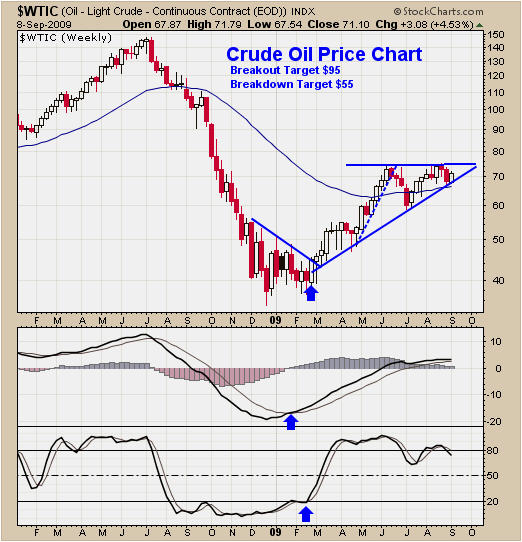
Crude oil is having a tough time moving higher and with Wednesday’s higher than expected oil inventory levels, there will be more down side pressure.

Currently we have several profitable position and we will be tightening our stops and looking for new opportunities in the coming days.

If you would like to receive my Free Weekly Trading Reports for ETF’s or Stock Trading Reports please visit my websites: www.GoldAndOilGuy.com and www.ActiveTradingPartner.com

Chris Vermeulen

Commodity ETF trading charts allow us to track and trade the underlying commodities with ease. I have provided a few daily charts to show were current commodity prices and chart pattern are at.

GLD Gold ETF Trading – Daily Chart
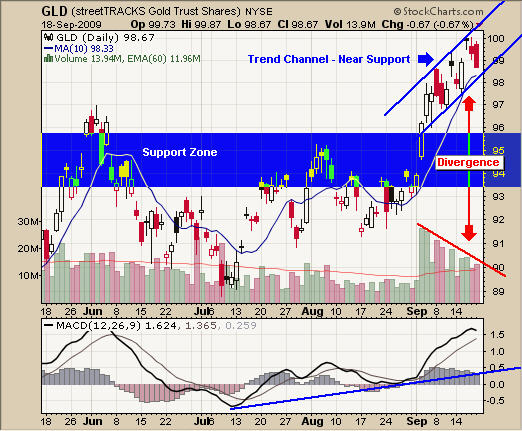
As you can see from the chart below GLD had a nice 4 day rally breaking out of a longer term pattern (weekly chart – pennant pattern). This bullish action triggered several different types of traders/investors to buy into the move including us. After taking some short term profits we continue to hold a core position with a stop in place to lock in more profit if we see the GLD ETF move lower from here.

Interest for GLD is decreasing which you can see from the volume divergence on the chart. This is a bearish sign, but we remain long until the price action tells us to get out and wait for a new short term trade.

GLD ETF Trading Newsletter

GLD ETF Trading Newsletter

SLV Silver ETF Trading – Daily Chart
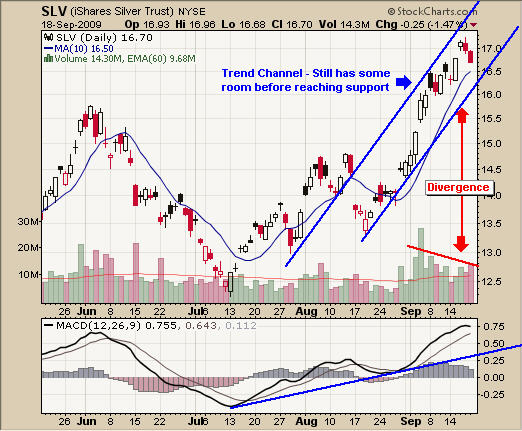
SLV ETF has been trending upwards for about a month and is now trading in the middle of its trend channel. We could see silver trade sideway or down for a couple days as the price consolidates. We continue to hold a core position and wait for a technical breakdown to lock in more profit, or have other possible low risk setups to add more to our position.

SLV ETF Trading Newsletter

SLV ETF Trading Newsletter

UNG ETF Trading – Daily Chart
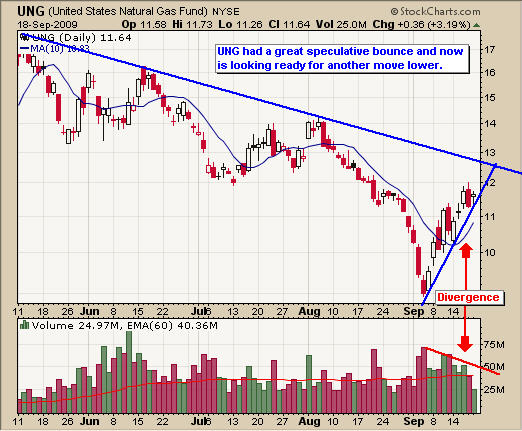
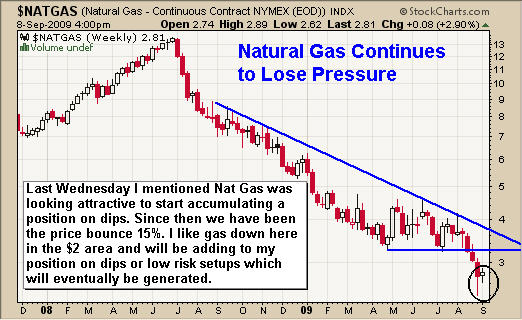
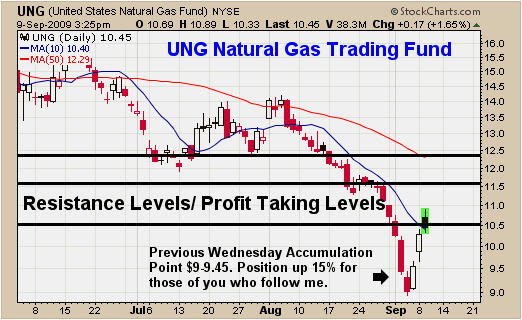
The UNG etf looks like it may be ready for a pullback and shorting this fund or buying a nat gas bear fund could be a good trade in the coming days. Notice the two price moves lower back in May & July. They were both followed by two bounces before making another leg lower. UNG could easily move up to $12.50 level but a technical breakdown will trigger speculative sellers. Shorting a fund like this which has terrible contango can actually help improve your returns. I will post an update for members if we have a short play on it later this week.

UNg ETF Trading Newsletter

UNg ETF Trading Newsletter

USO ETF Trading – Daily Chart
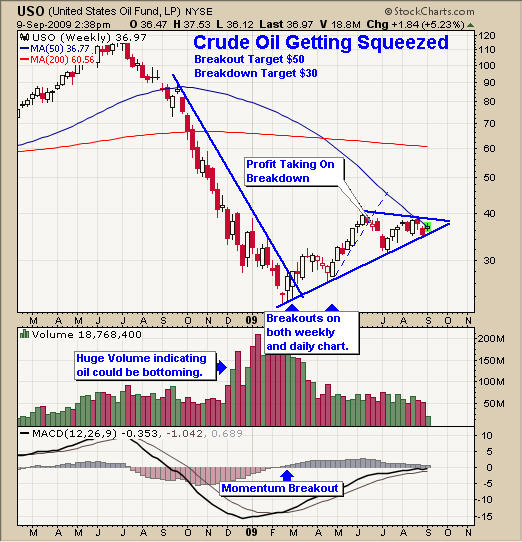
USO etf trading has been slow in the past couple months because of the sideways price action. With any luck we may get a low risk buy signal before the longer term (weekly Chart – Pennant Pattern) breakout, which will trigger speculative traders to buy oil again. I continue to follow this fund for potential buy signals for my clients.

USO ET Trading Newsletter

USO ET Trading Newsletter

USO, UNG, SLV and GLD ETF Trading Conclusion:
GLD traders should be ready to take profits if we see a continued move lower below our blue trend channel. I am always sure I do not take a loss on a trade once it becomes profitable by 2% or more and this is the key to consistent gains.

SLV ETF traders have been rewarded nicely in the past couple weeks. The price of silver has more room to fall before breaking down or bouncing so wait for one or the other before jumping. Following a trading model allows you to make consistent returns and catch large rallies over time for much larger gains. But you must follow the charts with a technical eye and discipline.

UNG traders had a very nice 25% rally from the perfect waterfall sell off a few weeks back. The price is now getting close to a resistance level so tighten your stops to lock in maximum gains before the price rolls over. I may have a short play for this commodity if we get a proper setup.

USO crude oil traders have been twiddling their thumbs as they wait for a breakdown or new rally higher. This chart pattern looks similar to the GLD breakout we had so oil could put in a much larger percent move than GLD with any luck in the coming months.

In short we continue to hold our positions and ride the market with protective stops in place. Lest see what happens this week.

If you would like to receive my Free Weekly Trading Reports via email please enter your email address on my website: www.GoldAndOilGuy.com or Stock Trading Reports at www.ActiveTradingPartner.com

Chris Vermeulen
Gold is back in the spot light as it flirts with the $1000 per ounce level. This closely watched commodity looks as thought it will rocket higher because of the multiple trading time frames indicating breakouts.

I mainly focus is on trading the daily chart but I always refer back to the longer time frames which are the weekly and monthly charts. Knowing the momentum and trend on these long term trading charts allow me to identify the strength of the rallies and sell offs on the daily chart. I use this analysis for determining how large of a position to take, and where to place profit targets and stop loss levels.

Trading gold stocks does provide explosive opportunities when the price of gold moves. The past couple years I have only been focusing on trading gold to the long side because the overall long term trend is up. Trading with the longer term trend always improves the odds of winning the trade. I will short GLD or GDX funds for an intraday trade using my simple Kitco gold overlay Day Trading Strategy. I have posted this strategy a couple of times on the internet, if you want to read more about it.

Below is my analysis explaining the price action of gold stocks on the daily, weekly and monthly charts. I also a listed the US and Canadian funds which I trade.

HUI Gold Stocks Index – Daily Chart – Short Term
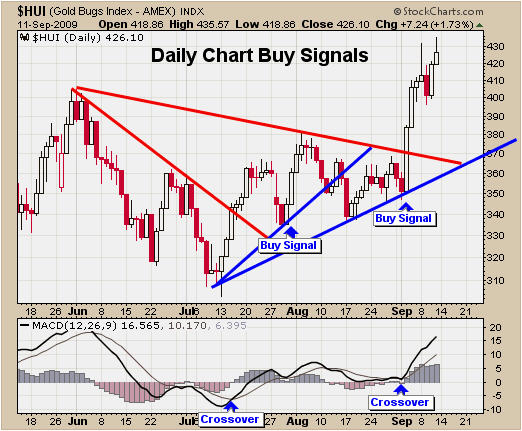
The daily chart of the HUI clearly shows buy and sell signals, which were generated in the past 2 months. Using resistance trend lines for breakout levels is very important. I also use pivot lows to draw and connect my support trend lines, which allow me to calculate down side risk and buy signals. The recent breakout is very strong and that is because the weekly and monthly charts are showing a breakout to the upside triggering longer term traders/investors to buy.

Daily chart buy and sell signals are for short term trades which last between 2-20 trading days. My focus is to lock in 1-5% gains but in a strong trend I can pocket 10-20% return in a short period of time.

Gold Stocks Newsletter

Gold Stocks Newsletter

HUI Gold Stocks Index – Weekly Chart – Intermediate Term
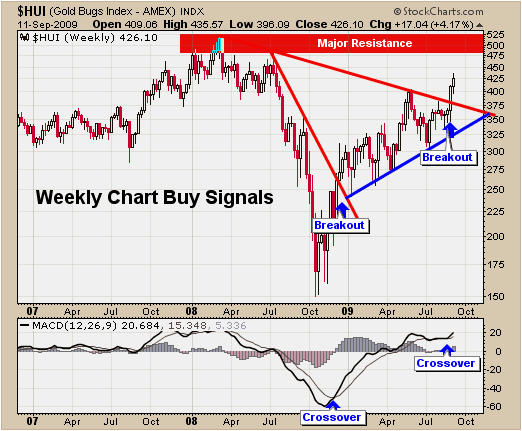
Weekly chart patterns and breakouts provide a much larger move in general so watching this chart is crucial for long term success. Following the weekly chart goes for trading every investment vehicle whether you are trading stocks, futures, FOREX etc…

This chart generated a buy signal in December of 2008, which we took advantage of. And just 2 weeks ago it gave us another buy signal. Again using my simple trading strategy which involves trend lines and the MACD momentum indicator, we are able to establish clear buy and sell signals.

Gold Stocks Trading

Gold Stocks Trading

HUI Gold Stocks Index – Monthly Chart – Long Term
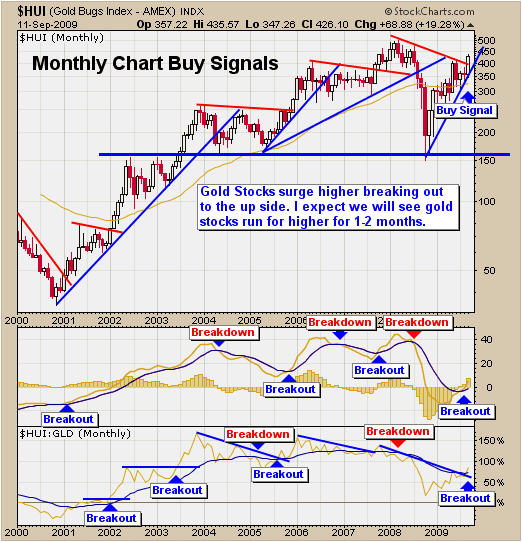
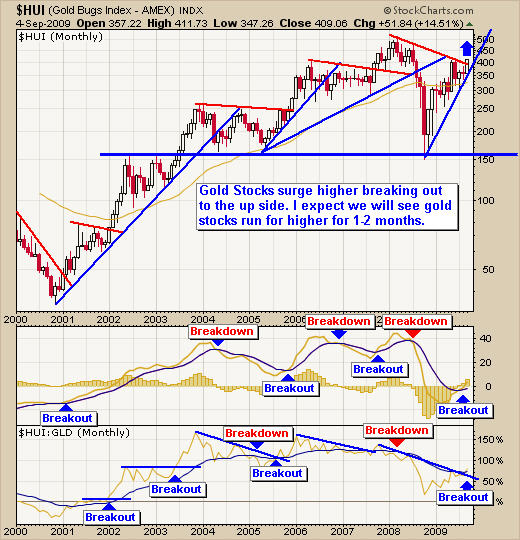
Long term investors will use the monthly chart for timing their buy and sell signals because once the momentum has shifted direction it tends to last for several months if not years. I do not focus on trading these long term signals but I use them to help me know the momentum (power) of the next possible breakout. This also helps me in deciding whether to scale out on rallies with some of my position locking in some profit and buying back on dips, while leaving a core position incase the price continues to rally.

The monthly chart of the HUI shows a breakout this month and if the price can hold until Oct we will have a complete long term buy signal. I use the MACD for momentum and the HUI:GLD ratio to confirm the breakout which puts the odds more in my favor.

Gold Stocks Newsletter

Gold Stocks Newsletter

Precious Metals Funds for Trading Gold and Silver Moves – Daily Chart
Here is a list of the precious metals funds I trade on a regular basis. I trade both US and Canadian funds. Because I am based in Canada I focus on Canadian gold stocks and gold funds when there are intermediate/long term signals which I trade in my retirement account.

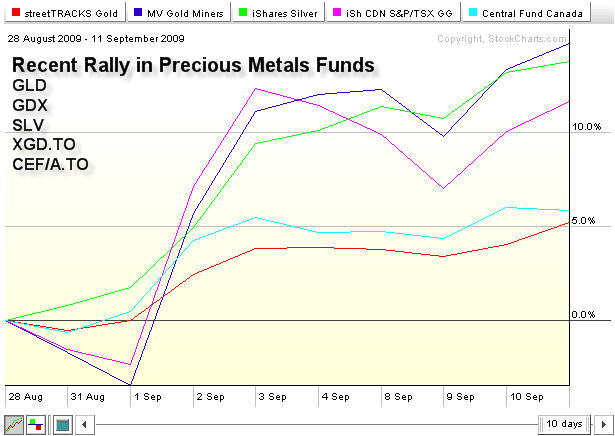
The funds I trade are GLD (gold bullion), GDX (gold miner stocks), SLV (Silver Bullion), XGD.TO (Canadian Gold Stocks), CEF/A.TO (Canadian Gold & Silver Bullion). If you look at a comparison chart you will see some funds provide much larger moves than others. In general I like to own a bullion fund and a precious metal stock fund so that I get the best of both worlds.

Gold Trading Investments GLD, SLV, HUI, GDX

Gold Trading Investments GLD, SLV, HUI, GDX

My Gold Stocks Newsletter Trading Conclusion:
In short, Gold and gold stocks are on fire. The next 13 trading days are very important for gold as it battles to breakout above the $1000 – $1033 level which is the 2008 high. With gold trading at this MAJOR resistance level also known as a “Pivot Point”, the risk level is higher for traders. The odds are pointing to higher prices but we must recognize that price action becomes volatile and fast moving. We could see the price breakout and rally to the $1500 level within months which is what are currently positioned for. But we must realize that gold could create a double top and sell off very quickly which is why we have stops in place to protect us.

So those of you who are long be sure to lock in some profit and be ready for some wild price action in the coming weeks.

If you would like to receive these Free Weekly Reports please Opt-in to my newsletter at: www.GoldAndOilGuy.com

Chris Vermeulen
Active Trading Partners launched its brand new trading and investing commentary service on July 15th, 2009. In the short seven weeks since we launched, ATP has produced numerous stocks that have gained, 30, 40, 50, 60, and even 100%. Below are some excerpts from actual ATP research postings on our new service for Partners/Members. Most recently, we recommended JAZZ last Tuesday, 9/1/09 and it has risen as much as 63% in one week.

Are you getting quality advice, market updates, regular follow ups on your positions, and booking gains on an 80-90% success rate? If not, perhaps you should try a subscription to ActiveTradingPartners.com, where we are unmatched in our returns to partners.

We are limited to 200 subscribers and are nearly filled now, so act now. For $249.00 per month you get 8-10 new positions alerted per month, or about $25.00 per alert. With average historical returns of over 20% per recommendation. $10,000 put into each of our positions since the launch would have returned over 100 fold your $249.00 investment per month.

Samples below:

August 4th, 2009- LRR.TO/LRLMF $1.66
…Linear Gold is a micro cap gold stock, and I usually will hesitate to put these on the ATP service, but this one looks like a great value going forward, and I like the chart set up here as well…Shares outstanding are 34 million. That’s a market cap of 58 million Canadian, or less than 2x future projected net cash flows. They have 24 million in the bank, 0 debt currently, and multiple drill projects. They have leverage later on to future gold price increases, and position to acquire other projects/exploration plays. I’m not seeing a lot of downside here.
Results: Linear Gold ran to $2.28 17 days later for a 37% gain.

August 14th- CRXX- $1.05
… the “Saucer” chart is bullish because of the general sideways movement over a long period of time. This is a transfer of shareholders from old to new, re-setting a large base for the stock. A break over $1.10 could trigger a run back to $1.34 a recent spike high on good news several weeks ago. Also, there is a huge “gap” at $3.00 a share above. This means there is an air pocket where technically there are no sellers until $3.00. The only sellers will be the traders who bought recently, or buy near term. To say that I am excited by the long term prospects of this merger would be an understatement.
Results: CRXX ran to $1.34 within a few days for a 25% gain. It has since risen as high as $1.92 on September 1st, for a 75% gain in 3 weeks for ATP.

August 18th- VICL- $3.35
…with Federated Kauffman paying $3.63 a share just a few weeks ago for 3 million shares, they brought their total to 5.4 million shares. The stock has drifted down and volume has dropped from a 90 day average of over 1 million to just 350,000 or so a day lately. This normally precedes a shift in sentiment and price movement, quite simply the crowd has moved on.
We have an ATP proprietary “Fibonacci Intersection” on Aug 17th, and to ATP it means the stock bottoms around that time and it’s time to start accumulating positions… A break over $3.40 will probably start a new bull trend in the stock.
Results: On September 3rd, 16 days later, VICL hit $5.40 for a 61% gain

August 20th- SPPI- $6.27
SPPI- …When the stock hit 6.05 earlier this week, it was at the bottom of proprietary indicators I have developed as reliable for pivots. I mentioned earlier this week that I had picked some up at 6.12 and 6.15. This afternoon I was an aggressive buyer at a 6.27 average per share and building a position… The chart appears to be very bullish and very oversold at the same time. If I was to hazard a guess, I would see a move up to 6.80-6.90 again, then a pullback, and then a breakout over 7 with a run.
Results: On September 4th, SPPI hit $9.00 a share for a 43% gain in two weeks.

September 1st- JAZZ $7.29
The stock closed 8/31/09 at $7.29 a share and has been in a general trading range for about 5 weeks now. We also have a 5 day reverse head and shoulder pattern, often a leading indicator of a move up. ATP research would not be surprised to see a move towards $10.00 per share over the intermediate time period.
Results: On September 4th, Jazz soared over $10.00 per share for a 40% plus gain in 3 trading days for ATP

September 2nd- RINO $12.60
…accumulating a position in RINO here in the 12.50-12.90 window. The volume has completely dried up on the stock after the recent run from mid 10.70 to 14.88. The pullback is a typical “B Wave” pullback in an “A-B-C’ move to the upside. This actually retraced a perfect Fibonacci 61% retracement of the recent swing move up… The valuation remains very cheap, the company is very under-followed.

Results: Stock closed at $14.27 the next day as Rodman and Renshaw initiated coverage with a $22 target. 13% return in 24 hours.

Please visit our website for more information: www.ActiveTradingPartners.com
Chris Vermeulen
I hope everyone enjoyed the weekend!

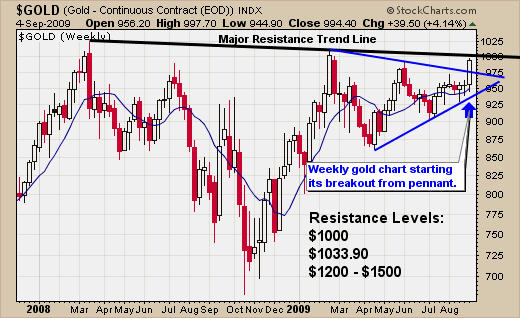
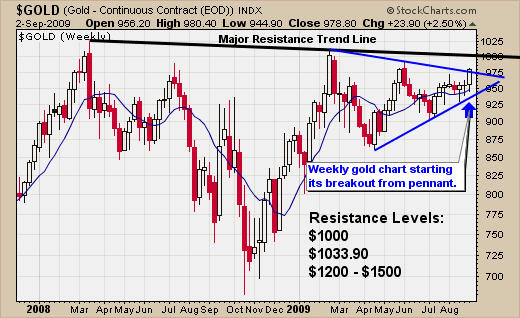
Gold is once again the hot commodity, as the price rises to the $1000 per ounce level. This $1000 – $1033 is a technical pivot point for gold. One of two things is going to take place in the coming weeks.

If the price of gold can move above $1033 then I expect to see a lot of traders and investors buying gold, as they panic into the position because they do not want to miss another gold rally. Also traders who are short gold will be forced to cover their positions and this will send the price of gold rocketing higher towards the $1200- $1500 area.

On the other hand, if gold fails to break higher, we will see a swift sell off, as everyone sells their position.

HUI – Gold Stocks Index – Monthly
I like to use this chart for timing longer-term gold investments. Gold stocks tend to lead the price of gold on a percentage gain/loss basis and so far this month, gold stocks are on fire. This bodes well for gold.

When I see breakouts on this monthly chart, I tend to take larger positions in gold and gold stocks because rallies tend to last 2-6 months. I like to take profits, as the price rises, so that I am locking in gains while still taking part in the continuing move.

The gold stocks (Golden Rockets) we purchased 2 months ago are now up 45% and 100% from our entry point and they still look very strong. Taking some money off the table is a great idea. Gold could go either way fast and it’s better to sell some of the position to lock in profits and let the balance of the trade run. Too many traders swing for a home run and never take profits on winning positions. Winners eventually turn into losers if you hold on to them long enough. Money management is the key to successful trades.

Gold Stocks Newsletter

Gold Stocks Newsletter

Price of Gold – Gold Bullion – Weekly Chart
This chart clearly shows the breakout last week from the pennant pattern. The price of gold is nearing resistance. This week will be exciting as gold tries to breakout.

Gold Bullion Newsletter

Gold Bullion Newsletter

Price of Silver – Silver Bullion – Weekly Chart
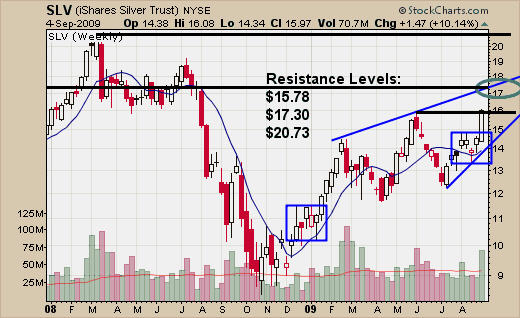
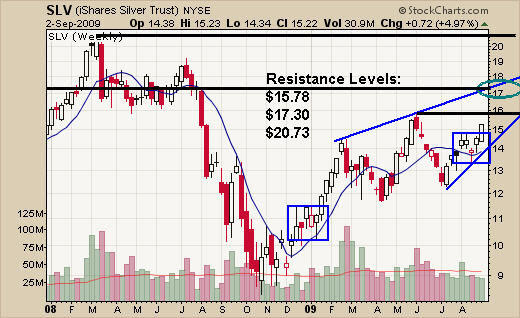
Silver is not as close to the 2008 high like gold is, but is still performing well. Silver is trading at a short-term resistance level and I expect to see higher prices this week.

Silver Bullion Newsletter

Silver Bullion Newsletter

Silver and Gold Newsletter Conclusion:
Gold and silver are starting to run higher and with all the media coverage I expect to see money moving into precious metals for a couple months. This is an exciting time for precious metal investors and a lot of money is going to be changing hands once these metals pick a direction and start moving.

I will be sending out my energy report for oil and natural gas tomorrow. If you would like to receive my trading reports please visit my website at: www.GoldAndOilGuy.com

Chris Vermeulen
Over the past couple of months, gold and silver have been uneventful. In this report I have posted weekly charts to show the larger trend of gold and silver. Also I have provided small charts of the US and Canadian gold stock funds GDX and XGD.

Because this report has weekly charts, which are a slow and dull time frame to follow, I have added another one of my Kitco Spot Gold Overlay trades, which is a short day trade to liven things up.

GLD ETF – Gold Bullion Price Action – Weekly Chart
I spoke with a few members last week, who wanted me to change my analysis for gold, which I agree with. So I would like to address this now to keep everyone on the same path.

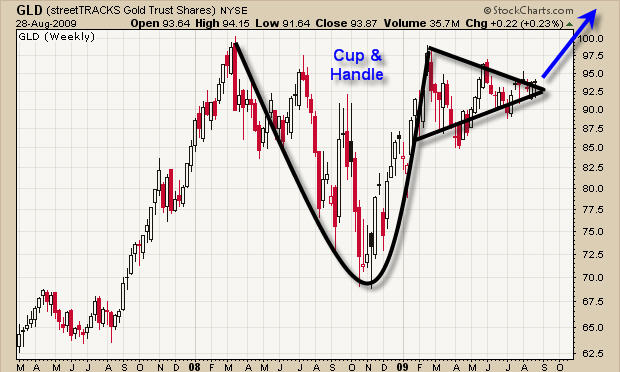
In previous reports I have pointed out the reverse head & shoulders pattern in this weekly chart below. But to be honest, it is not a reverse head & shoulders, which everyone is saying it to be.

Why is gold not in a reverse H & S pattern? Because a reverse H & S pattern is just that, it means the price will reverse from the previous trend. A reverse H & S happens after a downtrend, which forms a bottom and the trend is not moving higher.

Gold has been moving higher, which you can see in 2007 and this large pattern is more like a Cup & Handle pattern – extremely bullish.

Trading Spot Gold Chart - Weekly

Trading Spot Gold Chart - Weekly

SLV ETF – Silver Bullion Price Action – Weekly Chart
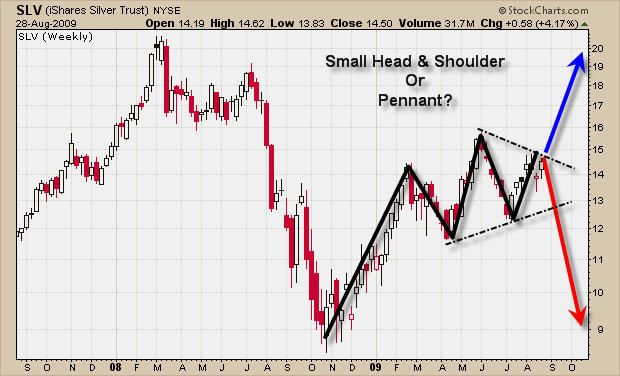
Silver is trading a little different than gold. As you can see the price is trading much lower than the 2008 high. There are also two small patterns forming, which are a small head and shoulders top or a bullish pennant.

Last Friday we saw gold and silver prices jump, but until we get a low risk entry point, I continue to watch these commodities move inside their large weekly price patterns.

Spot Silver Chart - Weekly

Spot Silver Chart - Weekly

US & Canadian Gold Stock Funds
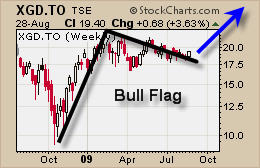
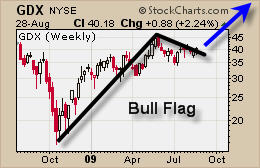
These small charts show how bullish the price action is this year for gold stocks. But the exciting part, which is tough to see here, is that the Canadian fund is starting to show bullish price action. When both the US and Canadian gold funds are moving together, it means there will most likely be some tradable moves in the near future. Let’s keep focused and ready to take action in the coming weeks, as these bull flags near the end of their cycle.

US Trading Gold Stocks

US Trading Gold Stocks


Canadian Trading Gold Stocks

Canadian Trading Gold Stocks

Day Trading Spot Gold – Day Trading GLD ETF
I will keep this short because I have written about this once before and below is the link to read my gold trading strategy in detail.

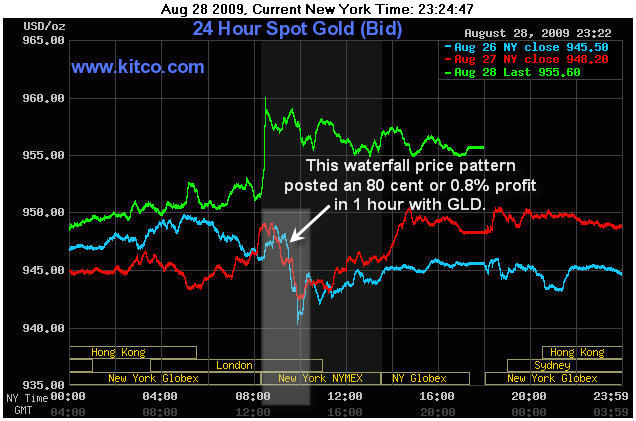
Day trading spot gold using the real-time kitco overlay chart is what I use to identify a possible day trade. The shaded box below shows a simple waterfall sell off and when I see that price action, I will generally take a position the next day around that time for a short trade in GLD.

I did not think to save this kitco chart until the following day so the waterfall price action was miniaturized because of Fridays rally. Also I would like to note this waterfall pattern happened 3 times in a row last week and I took advantage of them.

My Basic Strategy
Gold tends to move similar to what it did the previous day and traders know this, which is why the patterns starts 5-30 minutes earlier the following day, as we anticipate the move. Moves tend to repeat for up to 3 days. So you identify a sizable move and take action on it the following two days, as long as the rest of the day trades similar to the previous days. I like to scale into positions and once I see it going my way I add one final position to increase my exposure.

I am sure some of you are wondering how I traded GLD at 8am ET?
I trade with an online broker that allows me to trade pre-market and post market hours. Not very often these setups happen before 9:30am ET but last week it did.

Important note:
Once you see the price of gold making opposite moves of the previous day, minimize your position or don’t take the trade. As you can see in this chart below, the red line is starting to move the opposite way of the previous day (baby blue line) and later in the afternoon it was completely the opposite. This is a warning that there is a shift in the buyers/sellers and you can see the next day prices spiked higher in the opposite direction.

Day Trading Spot Gold - Day Trading GLD ETF

Day Trading Spot Gold - Day Trading GLD ETF

Read my previous Gold Day Trading Guide:
http://www.thegoldandoilguy.com/spot-gold-price-charts/

Technical Gold Trading Conclusion:
Overall precious metals are trending sideways in their bullish patterns and we are waiting for some low risk entry points.

During slow trading times, which we are currently in, I like to look for other profitable positions to satisfy my need to trade. As a full time trader, it is important to have a few styles of trading, which allow you to profit in any market condition. My main focus is on the commodity ETF’s, with low risk setups, but I also day trade GLD when opportunities arise and I also trade extremely over bought/oversold index plays using the leveraged ETF’s and focusing on my Active Trading Partners stocks trades, which provides profitable trades week after week. Combining these trading styles allow me to pull money from the market week after week without forcing any positions. I just let perfect setups unfold and I take advantage of them.

Soon I will be providing these gold day trades and index trades for members, which I think is very exciting. If you would like to receive my free weekly trading reports please visit my website at: www.GoldAndOilGuy.com

Chris Vermeulen
Everyone is talking about gold shooting to the moon because of the massive reverse head & shoulders pattern forming, not to mention the economy isn’t as good as some of us would like it to be?. I put together this quick report to show the bearish side of things for once.

Bearish Points for Gold & Silver:
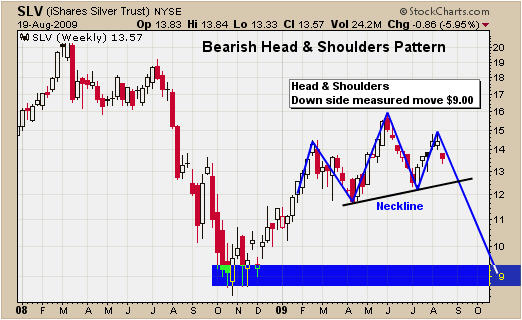
• Silver looks to be forming a H&S pattern
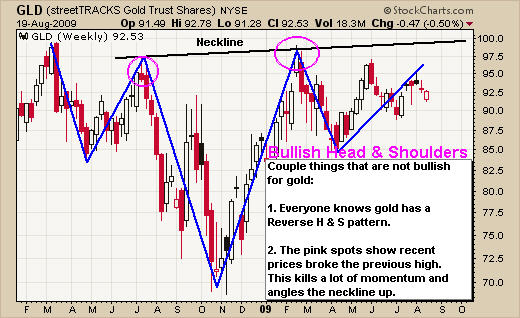
• Gold made a new high in March and quickly sold off
• Gold’s neckline is angled up which makes for a weaker breakout if it occurs
• The US Dollar looks ready for big rally.

SLV ETF – Weekly Chart
Silver is a great performer but we may have to start looking at shorting precious metals in the coming months if prices start breaking down.
1SilverHeadAndShoulders


GLD ETF – Weekly Chart

I like to be bullish on precious metals but these charts don’t provide much comfort. I will admit there are bunch of different ways to draw this gold chart which can make it look very bullish. But we cannot forget that the market will hurt the most individuals possible and we must be ready for these moves when they happen. Most traders think gold is going to breakout to the up side because of the economy and the famous Gold Reverse H&S pattern. But if everyone thinks this already wouldn’t everyone already be in gold? Who is going to buy gold to take it to the next level??

Also I want to point out that this reverse H&S has a neckline angled up which in my opinion is not a good sign. It shows the price was allowed to move above the previous pink high to suck in traders/investors as they panic to buy the breakout. Soon after buying gold they get taken to the cleaners as price plummeted. I just know from day trading that this type of head & shoulders pattern is not as accurate to trade and I avoid them (price patterns perform the same in all time frames).
2GoldHeadAndShoulders

US Dollar – Weekly Chart
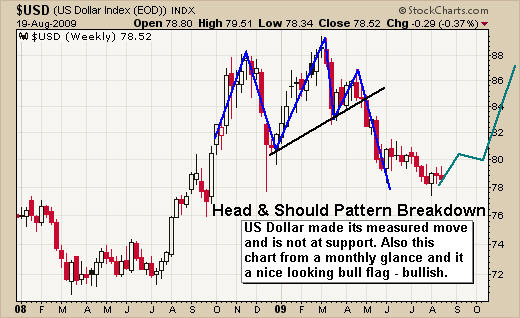
Take a quick look at the US dollar. It formed a very nice H&S pattern and broke down to the measured move area quickly. Also this chart looks like a large bull flag and could start to move higher from this support level in the coming months. If this happens we will see precious metal prices drop.
3USDHeadAndShoulders

Technical Trader Conclusion:
The precious metals market is under pressure from the US dollar and some major resistance levels. Overall silver is underperforming gold and I look at silver as leading indicator. We are currently in cash waiting for a low risk setup for gold, silver, oil and natural gas.

If you would like to receive my free weekly trading newsletter please visit my site: www.GoldAndOilGuy.com

Chris Vermeulen
I hope everyone had a great weekend and is now ready for another week of trading. I have put together a few simple charts to show you what we could see with prices in the near term. While I do not predict future price movements (because it is impossible to always be correct), I do like to know what could happen and be ready to take action when something significant occurs.

The five charts below quickly summarize what I am seeing in the market currently.

Gold Stocks – HUI Monthly Chart

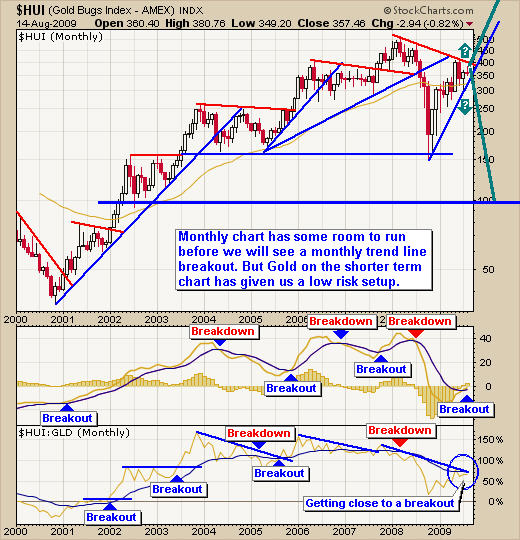
Gold stocks have been performing very well this year. As you can see from the chart stocks are getting squeezed into the apex, which generally creates explosive moves. We could be months away according to this chart so don’t get trigger happy just yet.

A breakout to the upside will most likely trigger a very large rally. But if prices break down then I expect to see gold stocks pull back to new yearly low.

Gold Bullion Market

Gold Bullion Market

GLD Gold ETF – Gold Bullion Prices – Daily Chart

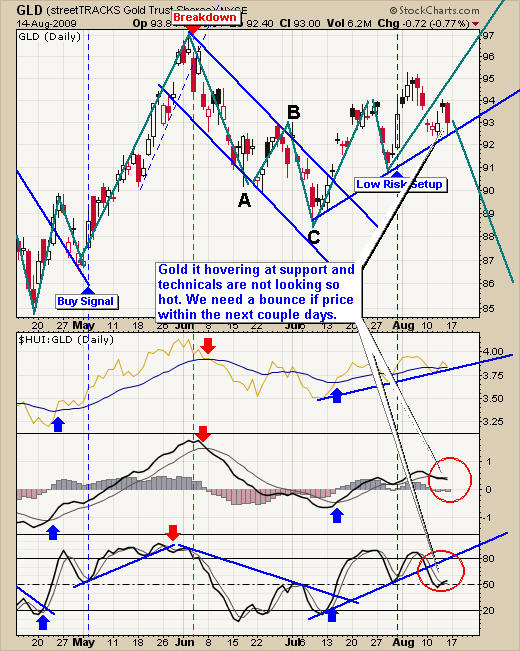
Gold has been trying to move higher the past 4 weeks and is having a tough time. With any luck gold will bounce higher Tuesday or Wednesday starting a new rally higher. If prices do not hold, up I figure we will see a sharp price drop which could go all the way back down to the $800 level within a couple months. I am currently long gold and will continue to hold it until I see a technical breakdown on the chart.

GLD ETF Trading Signals

GLD ETF Trading Signals

SLV Silver ETF – Silver Bullion Prices – Daily Chart

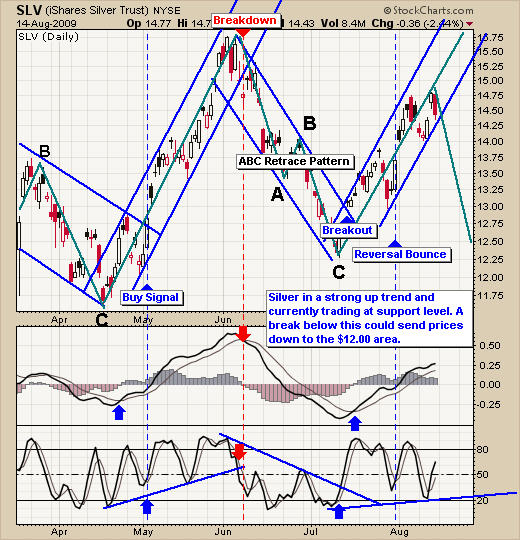
Silver is in the same situation as gol. It’s pointing to higher prices but a breakdown will most likely trigger a sharp sell off. I currently own silver and will be looking to exit below the $14.00 level.

SLV Silver ETF Trading Signal Newsletter

SLV Silver ETF Trading Signal Newsletter

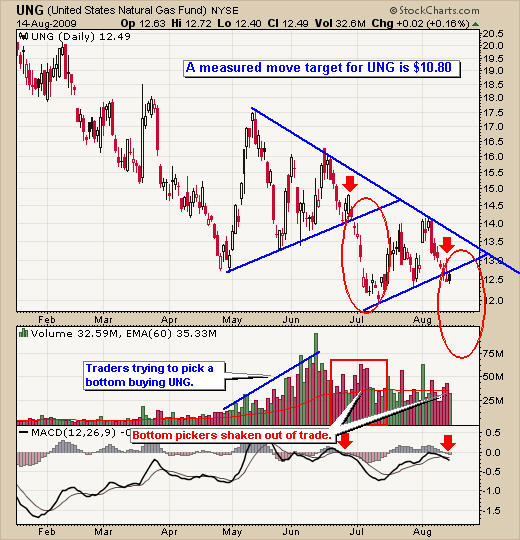
UNG Natural Gas fund – Natural Gas Prices – Daily Chart

Nat Gas looks to be breaking down once again on rising volume. We could see another waterfall type drop this week.

UNG Fund Trading Signals

UNG Fund Trading Signals

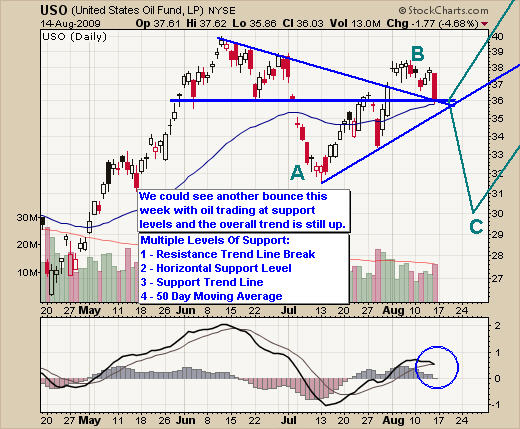
USO Crude Oil Fund – Crude Oil Prices – Daily Chart

Crude oil had a big pullback Friday which could make for a great short term intraday play on Monday. Sharp price drops like this will generally have bargain hunters (buyers) step in the following day to push the price higher. Also I pointed out that oil is trading at 4 different support levels. This could give prices an intraday pop or possibly start a new leg higher in the coming days.

I continue to wait for a low risk setup in oil, which is possible that we get a setup this week. Only time will tell but I will keep you posted.

USO Crude Oil Fund Trading Signals

USO Crude Oil Fund Trading Signals

Technical Traders Conclusion:

Gold stocks, gold bullion and silver are trading at support levels. The overall trend is up so there is more of a chance that we will see a bounce from here. But the market always throws in a curve ball so be prepared for locking in gains or cutting losses quickly if we see prices slide lower.

Natural Gas continues to have selling pressure and looks to be having a technical breakdown as of last Friday. This could be a nice play for those aggressive traders who want to take advantage of a 1-3 day breakdown in price.

Light Crude Oil is in a similar situation as gold and silver. Currently trading at support and could go either way, but the odds are in favor for a bounce.

I will update again on Wednesday night, if you would like to receive these quick technical trading reports to your inbox Free please visit my website: www.GoldAndOilGuy.com .

Chris Vermeulen