Dec 2nd, 2009
The market has had a fantastic week so far for stocks and precious metals. The financial and energy sector are underperforming which is a concern, but we continue to hold our positions and will wait until a reversal to lock in our gains.

Things seem to be lining up for stocks and precious metals to take a breather, which is in line with the Dow Jones Seasonal chart below.

Let’s take a look…

Dow Jones ETF
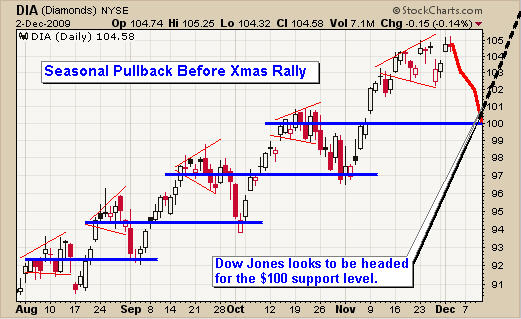
You can see from looking at the chart the repeated pattern of price rallies, leading to exhaustion and a test of support, followed by another repeat of the pattern. It looks as if the broad market is setup for a test of support which could happen within 2-4 days. Then as we near the holiday prices will start to drift higher. This pattern occurs more often than not as seen on the Dow Jones Seasonal chart below.
Broad Market Holiday Rally

Broad Market Holiday Rally

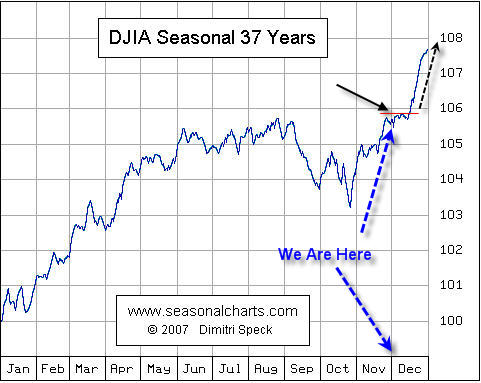
Dow Jones Seasonal Trends
This chart clearly shows weakness in the first half of December and continued strength moving forward. This has not really happened in the past two years which means we are overdue for continued strength. ?

That being said, the previous two years were bear markets and we are now in a bull market. So the tendency is for buying to continue into year end.
Dow Jones Seasonal Trends

Dow Jones Seasonal Trends

GLD ETF Fund
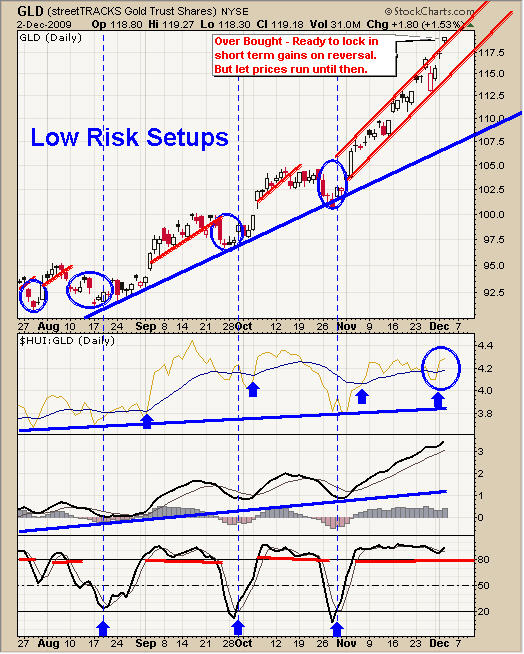
Gold continues to push higher surprising many of us. It seems as though money is rushing into metals and buyers are not particularly concern about price. While this is great for short term traders and those of us in the trade, we must remember that the faster things go up, the quicker they correct.

Don’t get me wrong, I don’t think gold is going to crash, I just think we could get a 10% correction before moving much higher. Gold is also trading near the upper end of the trend channel and could have a 2-4 day consolidation with the broad market before pushing much higher.
GLD ETF Trading

GLD ETF Trading

SLV Exchange Traded Fund
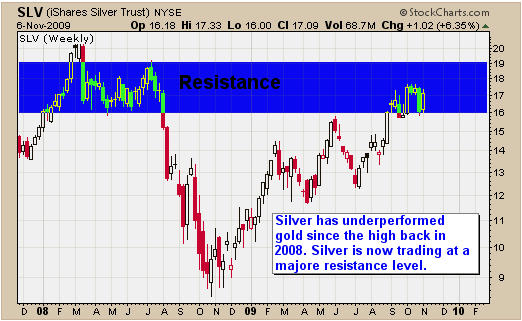
Silver has been underperforming yellow gold but is still a solid investment. It is also trading near the upper end of the trend channel and could have a 2-4 day consolidation with the broad market.
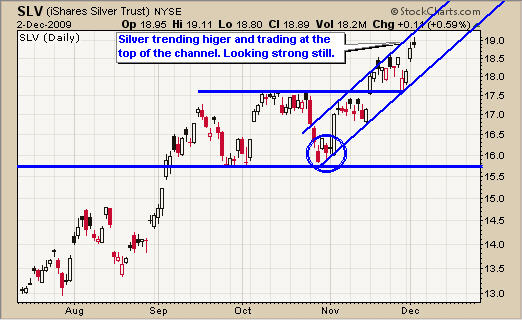
Silver ETF Trade

Silver ETF Trade

USO & UNG Funds
Oil continues to flag from its breakout back in October. This is a bullish pattern. Last Friday we saw oil open much lower then rally back into the trend channel. This is called an outside day and many times this happens to stocks and commodities as it shakes out the weak traders before starting another rally higher. We will keep a close eye for any low risk entry point.

Natural Gas had a nice rally last week which I mentioned looks a lot like a short covering rally. The price action this week suggests it was and has now made a new low. Today on CNBC it was reported that a new source of natural gas has been discovered. This resource is 20 times larger than the biggest source in the US. Enough gas to last the US over 100 years. This added to the selling on both natural gas and oil today.

Energy ETF Newsletter

Energy ETF Newsletter

Trading Conclusion:
Precious metals continue to perform well and it’s important to note that PM stocks are now moving higher with gold. They have been lagging for some time but are on fire again. Great to see!

The Dow Jones index and several others look ready for a breather. The timing of these overbought charts bodes well for the seasonal December pause before the holiday rally. Time will tell.

Energy and financials are both underperforming the market and without their participation we will not see the indexes move much higher.

Continue to hold precious metals positions but be ready to lock in profits if we see the market reverse sharply. I am watching energy for a play but no setups at this time.

Check out my Free ETF Trading Newsletter:

Chris Vermeulen
www.TheGoldAndOilGuy.com

This year has been a very exiting time for traders and investors. We have seen a steady climb in prices with controlled pullbacks in the broad market and gold.

Using technical analysis we are able to quickly and accurately make informed decisions just from looking at the charts. In the charts below you will see how simple chart patterns along with support & resistance levels can provide excellent low risk entry points. Also you will see how candle stick charts can be an early indicator for prices to reverse direction.

DIA ETF – Daily
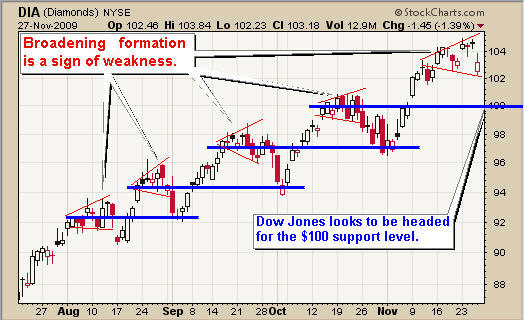
The DIA (Dow Jones Index Fund) is trending higher. By applying some basic technical analysis you are able to time your entry points having the odds in your favor.

In this chart I use two simple forms of analysis. The broadening formation (red trend lines), and horizontal support zones shown in blue.

Broadening Formations: This is when the price becomes more volatile making higher highs and lower lows. I think of it as one of those Megaphones for talking to large groups of people. So when a chart has this pattern it’s virtually yelling at me and I start taking profits or tightening my stops.

Horizontal Support Zones:
I like to focus on support or resistance zones which are a little different than most traders. I do not use the top and bottoms of previous waves for these levels. Instead I take the average price then expect the support level to be penetrated somewhat as the level is tested. This is how the market keeps you out of the good trades. I cover this in great detail in my Stock Market Trading Education Course available in January.

Analysis:
The DIA ETF looks ready for a pullback to the $99- 100 level.

DIA ETF

DIA ETF

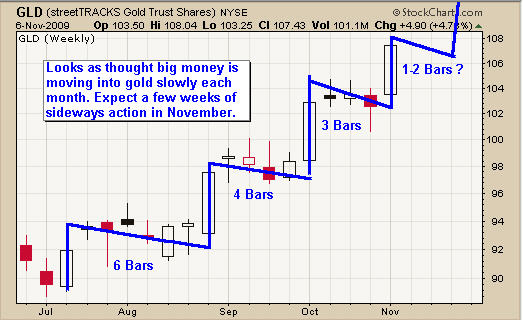
GLD Exchange Traded Fund – Weekly
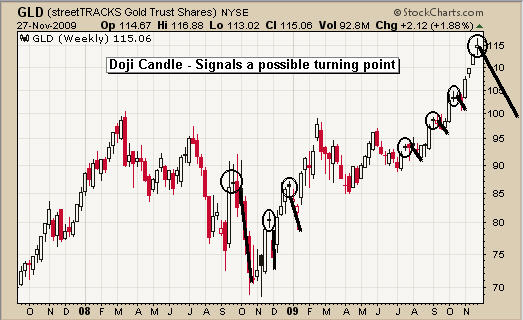
Gold has been on fire and riding this wave up has been very profitable thus far. Last week a doji candle was formed on the chart and this can signal a change in short term price action.

This chart shows some of the past doji candles and what happened to the price of gold soon after. What this candle is telling us is that the buying and selling pressure is equal. So we know momentum is slowing and we should expect a consolidation or correction.

Because gold has rocketed higher, indeed going almost straight up in the recent weeks, I expect a pullback to be very quick. A drop to the $110 or even the $100 level in the coming weeks is not out of the question, but we all know commodities can go parabolic for several months (straight up). This is why we continue to tighten our stops and keep holding out long positions.

Gold Exchange Traded Fund

Gold Exchange Traded Fund

US Dollar – Weekly
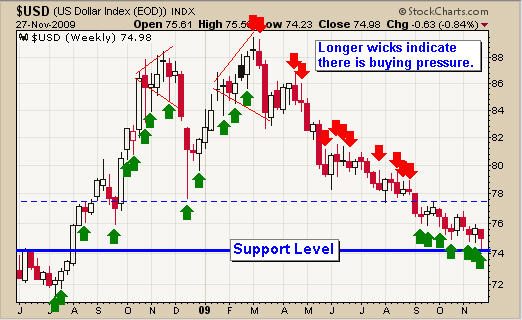
The US dollar has been up and down like a yo-yo in the past 15 months. The chart below clearly shows what has been happening with this currency and what I think we could see very soon.

The blue support zone (73-74) is a key pivot point for the dollar. That being said lets take a look at the chart.

During the time when the price is trending higher July 2008 – Feb 2009 we see lower wicks appear more often. This tells me that sellers pushed the price down early in the week but were then overcome by buyers nearer the end of the week. This is bullish price action. Also the broadening patterns during this timeframe’s tops indicate increased volatility and we know that is a sign of weakness.

From March 2009 – Sept 2009 the trend was down and there are longer upper wicks telling us buyers became over powered by sellers each time the price rallied.

In the recent 3 months we observe lower wicks meaning buyers are moving into the US dollar again. Knowing that there is major support below the current price I have to think the dollar could start to bottom around this level.

US Dollar Trading

US Dollar Trading

Trading Conclusion:
The broad market is becoming unstable and looks like it could have more of a pullback this week. I would not be adding to any long positions until we see the market trading near support. Three out of four stocks move with the market so it is crucial to understand the overall market direction when buying and selling stocks and commodities.

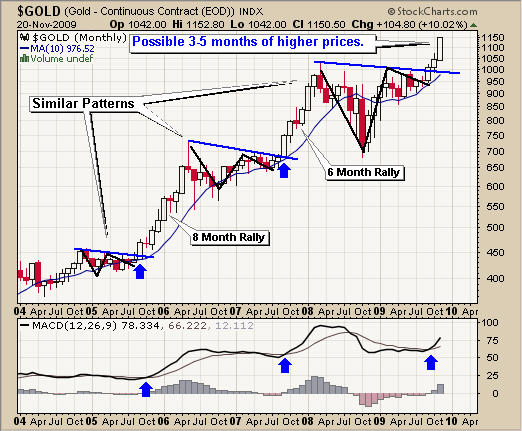
Gold is trading at a level which is fuzzy. The weekly chart is neutral and the daily chart is still on fire as it moves up. All we can do is ride our positions and keep raising our stop prices.

The US dollar could start to bottom over the next few weeks. Depending what happens with Dubai this week we could be in for a big bounce in the dollar as investors flock to safety as the US dollar is still the currency of choice if/when other countries start to have a financial melt down again.

If you would like to receive my free weekly trading reports join my newsletter:

Chris Vermeulen
www.TheGoldAndOilGuy.com
Another fantastic week for precious metals as the US dollar continues its slide lower. Energy commodities like oil and natural gas are having some difficulty finding buyers.

When commodities start to trend they become very profitable for those riding them up or down. But when a short term trend starts to virtually go straight up (parabolic) then we must be prepared for a sharp pullback. Once the price starts to slide I figure a lot of short term traders will begin locking in profits, sending gold down.

I’ve recently discovered the Money Flows table from The Wall Street Journal and I gotta say it’s awesome. My thanks to a trading buddy for bringing this resource as well as hidden gem play – DFSH – to my attention.

The Money Flow table calculates whether money is moving in or out of a stock or ETF on a given day, and whether it is selling on strength or buying on weakness. It also tells you if there are more up or down ticks. Really powerful stuff in my opinion.

For example, the GLD gold fund continued its move higher today as it must follow the underlying commodity. And though the fund traded higher institutions were selling their positions in masse. For every 9 block trades bought there were 100 block trades on the sell side. This is strong evidence that institutions/large traders are moving out of GLD. Indeed, over $161 million dollars moved out of GLD today alone and a total of $251 million dollars in the two days preceding today.

The SPY fund was 12 buy orders for every 100 sell orders. Today alone over $675 million was flowing out of SPY which his CRAZY huge.
.
Check out the table: http://online.wsj.com/mdc/public/page/2_3022-mflppg-moneyflow-20091125.html?mod=mdc_pastcalendar

GLD ETF Trading – Weekly & Daily Trading Charts
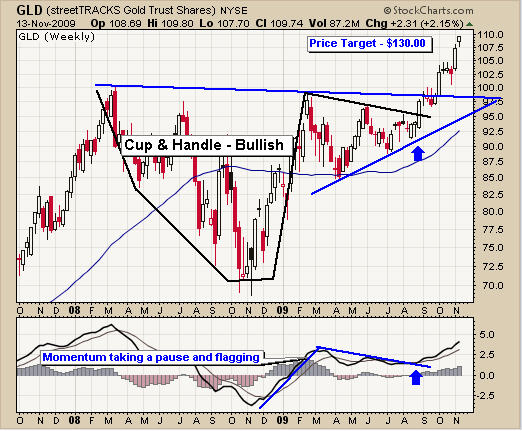
Gold continues to claw its way higher as trader’s trip over each other trying to buy this shiny investment. The weekly chart clearly shows a parabolic spike. Vertical spikes like this do not last for long, but the largest percentage of the move will be made riding this trend up with a tight stop.

Gold Trader

Gold Trader

SLV ETF Trading – Weekly & Daily Trading Charts
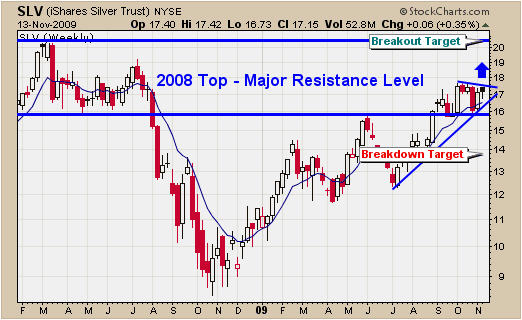
Silver is still trending up but lagging its big sister (yellow gold). The daily chart shows a nice mini bull flag and we could get an upside pop soon.

ETF Trading

ETF Trading

USO Fund Trading – Weekly & Daily Charts to Trade
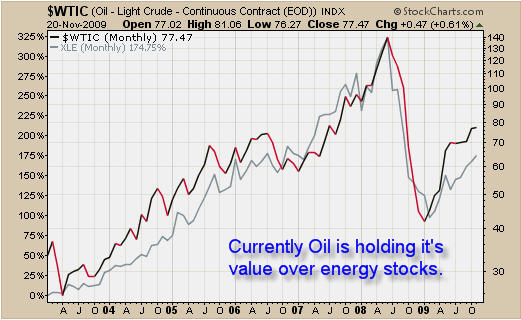
Crude oil just does not have people participating. The dollar is dropping yet oil continues to be dormant. It has provided several intraday plays as it trades the top and bottom of the trend channel.

Oil Trader

Oil Trader

UNG Fund Trading – Trade the Weekly & Daily Charts
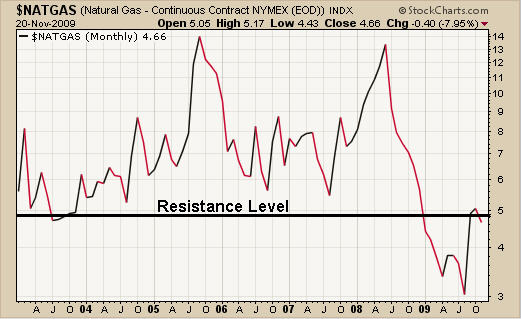
Natural gas really came to life today. It looks like people started to cover their shorts and it just kept running up for the entire session. I mentioned in a previous report that the $9 level could be a bottom and today’s reversal sure makes it look good to the eye. But if this is a short coving rally, prices are still headed lower yet.

Gas Trading

Gas Trading


ETF Trader Conclusion:

Gold continues its incredible rally and we love every minute of it. I keep moving our stops to lock in maximum gains while providing enough wiggle room for more growth.

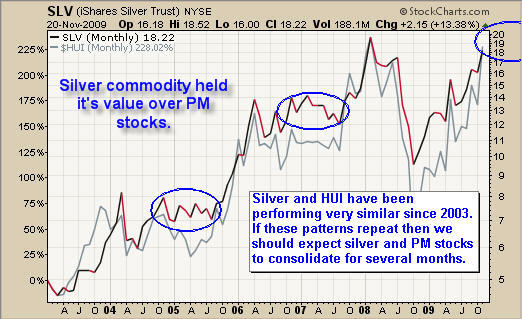
Silver and precious metals stocks are lagging and that is a concern. The charts look solid but I think investors are not currently willing to pay higher prices for riskier plays which include silver and precious metal stocks.

Crude oil is just drifting lower in a controlled manner. The chart looks bullish but buyers just are not in a panic to buy it right now.

Natural Gas has put in a nice bounce this week. I expect a lot of this is short covering and it could rally to the $10.50 – $11.00 area if all goes well.

The broad market is starting to look and feel over bought. We could see the market continue higher Friday because of the holiday light trading volume which virtually always moves the markets, or whatever investment is HOT, higher. This is because the large traders take time off so there are not a lot of large sellers in the market. But be ready for next week because these nice lofty prices could start tumbling down.

I just want to wish everyone a great holiday!

Get my Economic Trading Indicator Tool and my Free Weekly Trading Reports:

Chris Vermeulen
www.GoldAndOilGuy.com
So far this week has been slow in regards to commodity etf funds. Gold continues to shine while silver refuses to make a move higher. Crude oil has a nice bull flag and we are waiting for a breakout and setup while natural gas continues to see selling pressure.

ETF Trading Tip: Waiting for these exchange traded funds to generate low risk setups and watching our current positions mature is the boring part of trading. It’s these slow times when traders get bored and start taking more risk by entering positions that do not have clear entry and exit points. Not having clear entry and exit points will lead to traders holding on to losing trades and not taking profits on winning trades. Be sure you enter positions which you know where you should get out if the trade goes against you and where to take some money off the table if it rallies higher.

GLD ETF Trading – Daily ETF Chart
The gold etf fund looks to be in rally mode which means when traders start to take profits we should see a sharp reversal down.

ETF Trading

ETF Trading

SLV ETF Trading – Daily ETF Chart
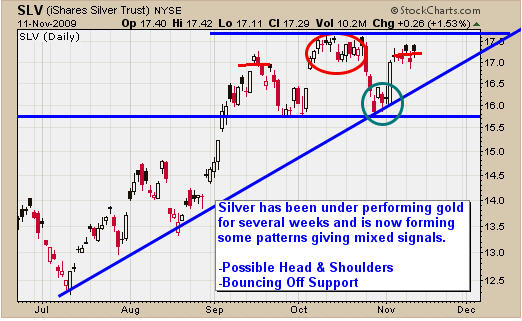
Silver has been under performing gold for several weeks now. I think this is because gold is the safe haven of choice be traders and investors. That being said silver generally leads gold so this is giving me a red flag. A larger correction in precious metal ETF prices could be just around the corner. But until we see a technical breakdown on the charts we are staying long.

Trading ETF Funds

Trading ETF Funds

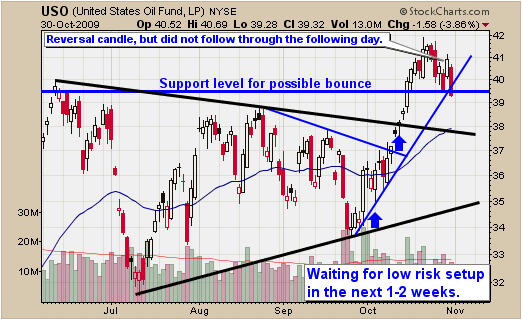
USO Fund Trading – Daily Fund Chart
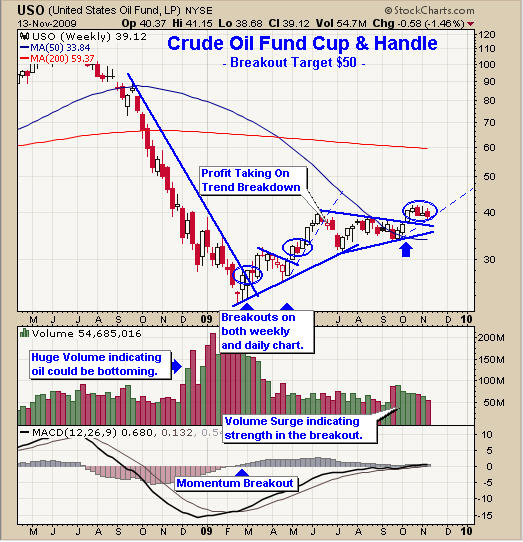
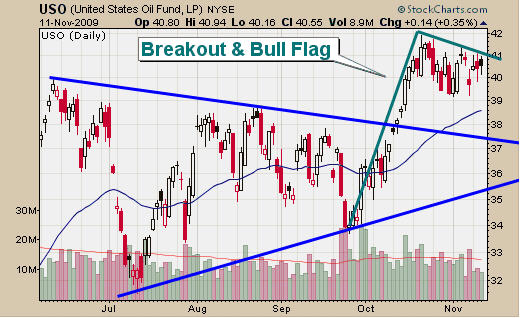
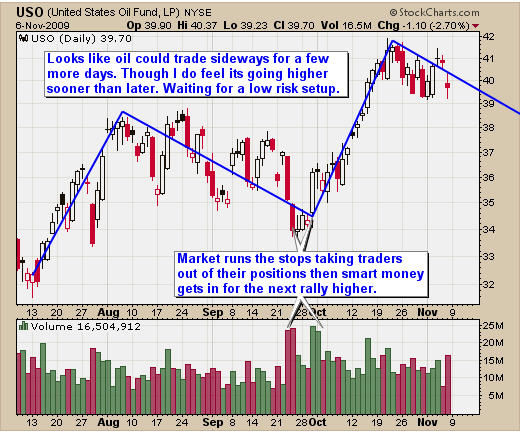
The USO oil fund broke out a few weeks ago from the large pennant pattern. The price has been flagging for about 3 weeks now. It looks like we are getting close to a low risk setup so I am keeping a close eye on this fund.
ETF Trader

ETF Trader

UNF Fund Trading – Daily Fund Chart
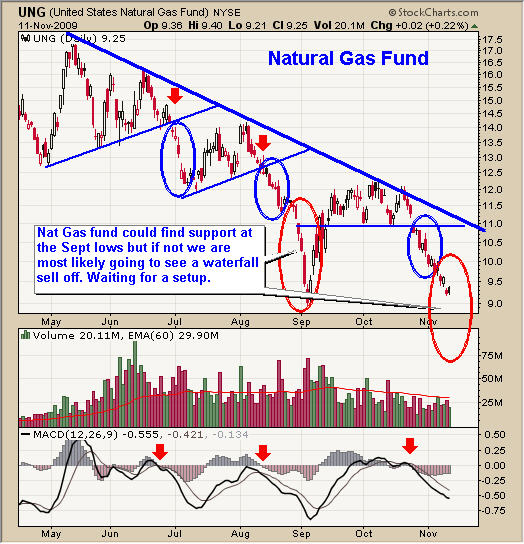
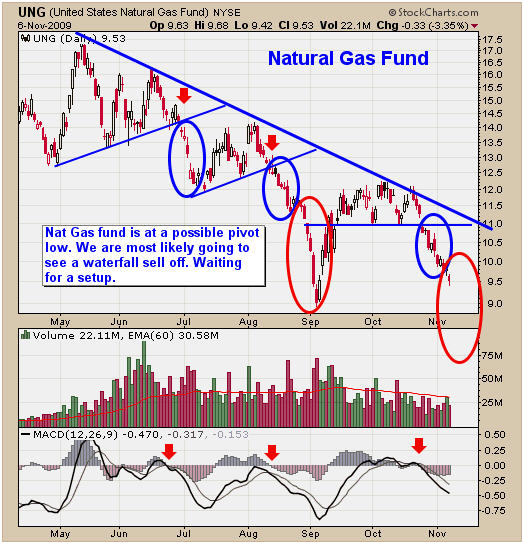
Natural gas continues to under perform the rest of our commodities. This fund is starting to look like another good by point but we need a few things to fall into place before that happens. Let’s not jump the gun because this fund is still in a bear market. Waiting for a setup.

How To Trade ETF Funds

How To Trade ETF Funds

ETF Trading Conclusion:
We continue to wait for trading opportunities to unfold. We focus on taking advantage of low risk setups and avoiding times the market when things are choppy and unclear.

Get these trading report sent directly to your inbox join my free newsletter:

Chris Vermeulen

Nov 4th, 2009
Precious Metals ETF have gone wild the past 2 weeks. Last week we saw gold and silver prices drop sharply as it shook out short term trader’s stop orders before breaking out and moving higher. Also there is a disconnect between the gold and the dollar.

Energy commodities like natural gas and crude oil are moving in opposite directions and look to be picking up speed. Natural gas is losing pressure and oil is on fire.

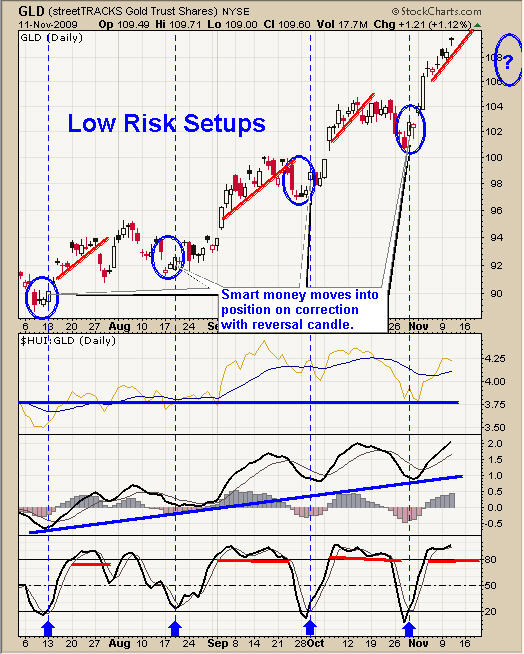
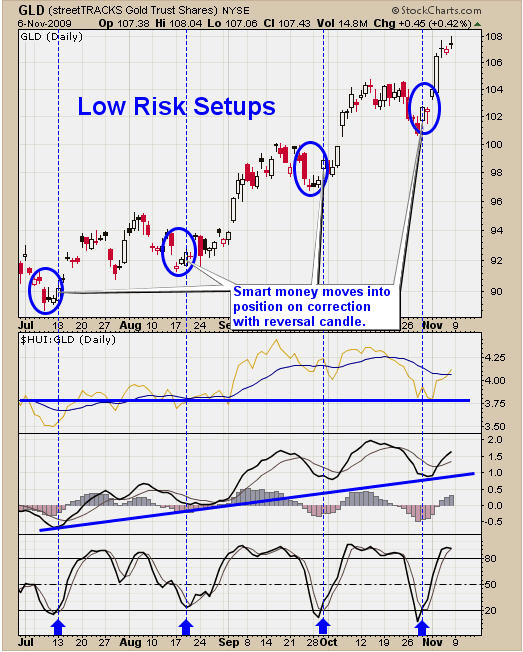
GLD ETF Trading – Pivot Trading Low
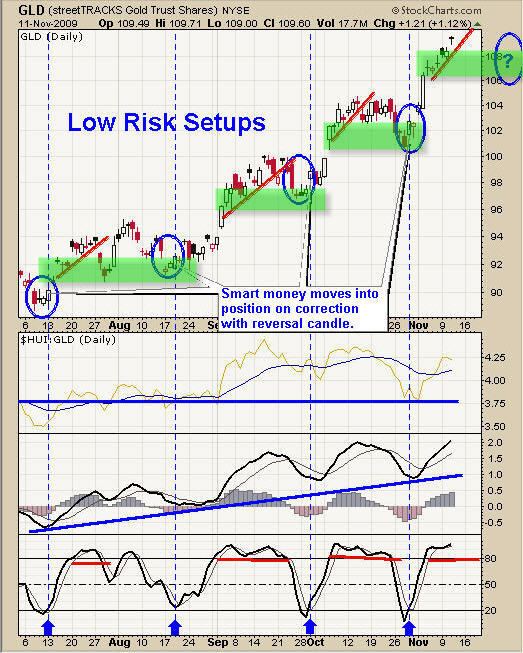
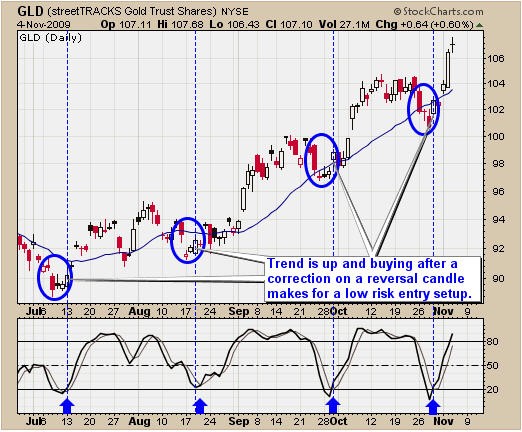
Last week we had our pivot trading low generate another buy signal for gold. Trading pivot lows is a simple trading strategy. I call them low risk setups and take advantage of buying a stock, commodity or currency after a pullback to support and when a reversal candle is formed. This chart clearly shows when you are trading with the trend buying on the dips is generally a low risk play with great up side potential.

Gold Bull Market Pivot Trading Low

Gold Bull Market Pivot Trading Low

Precious Metals ETF Trading – Gold Bullion Takes Control
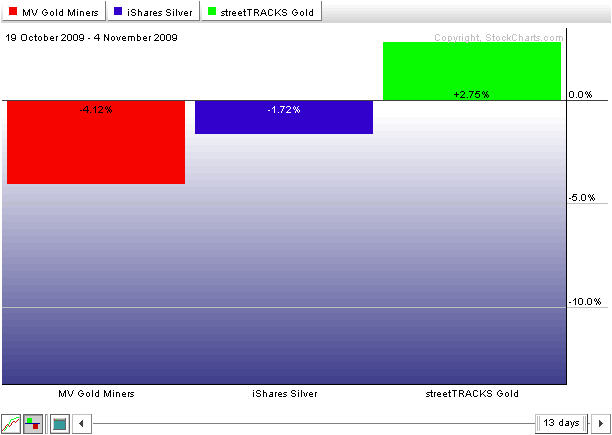
This is a chart which shows the performance of gold stocks (red), silver bullion (blue) and gold bullion (green). As you can see the past 2 weeks while the market has been selling down precious metals stocks have been hit harder than silver and gold.

Because of the heavy selling in stocks recently the smart money had been going into commodities especially gold bullion. Gold stocks are a great play but this is telling us investors feel safer in physical bullion than stocks.

Gold is the most known precious metal and safe haven which is why it’s holding value better than silver and stocks. This week we are seeing gold become more valuable in several major currencies which means gold is actually making a real move higher.

Gold Bullion, Silver Bullion, Precious Metal Stocks

Gold Bullion, Silver Bullion, Precious Metal Stocks

USO ETF Trading – Breakout & Bull Flag
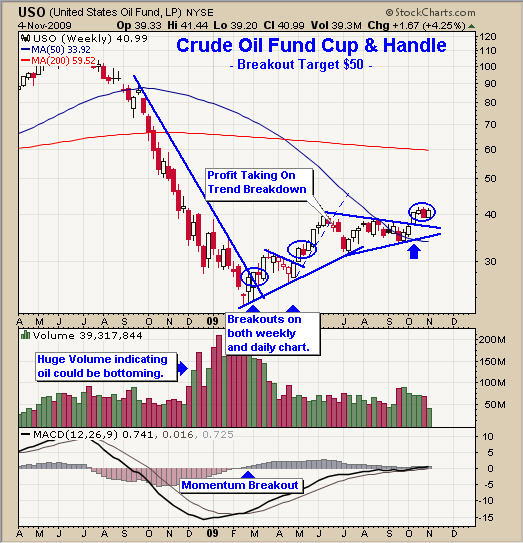
Crude oil has had some great breakouts this year and it looks like we are about to get another buy signal shortly. We had a breakout in Oct from the large pennant and are now flagging which is very bullish. We could see USO reach $50 in the next month or two.

Crude Oil Bull Market Breakout

Crude Oil Bull Market Breakout

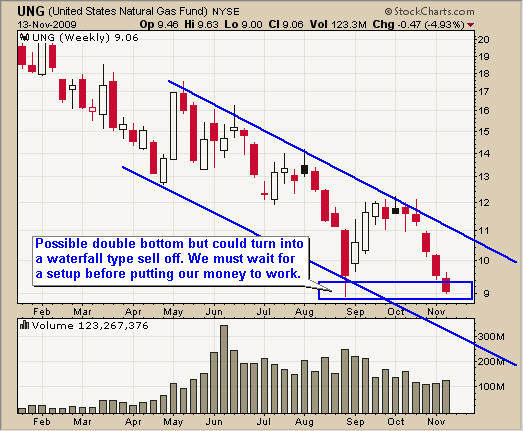
UNG ETF Trading – Pivot Low or Waterfall Sell Off?
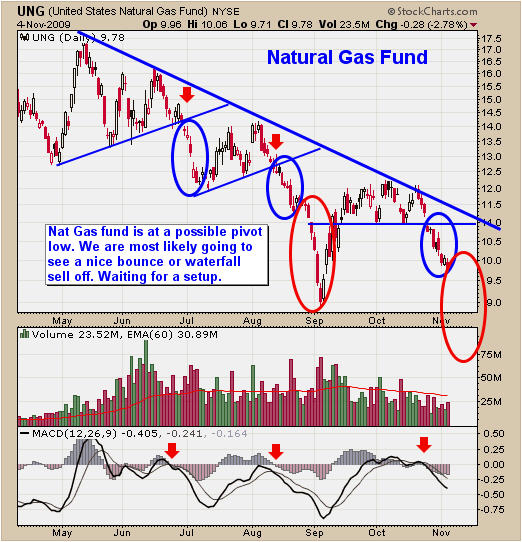
Natural gas is at a crucial level for a higher low bounce or another massive panic sell off. Trading right now with UNG is a 50/50 shot so we will just have to wait and let things unfold more before taking any action.

Natural Gas Pivot Low Bear Market

Natural Gas Pivot Low Bear Market


The Stock Markets, Precious Metals & Energy Trading Conclusion:

The market is starting to feel a little squirmy as it tries to find support. Small cap stocks continue to get crushed while blue chip (large cap) stocks are holding more of their value. Gold has broken higher this week while silver and precious metal stocks under perform their big sister Yellow Gold.

Crude oil is holding up nicely forming a 3 week bull flag and showing signs of life while natural gas continues to get hammered.

The market has been jumpy the past 2 weeks because market participants are very uneasy about the future direction of the US dollar.

If you would like to receive these free trading reports join my free list:

Chris Vermeulen

Nov 1, 2009
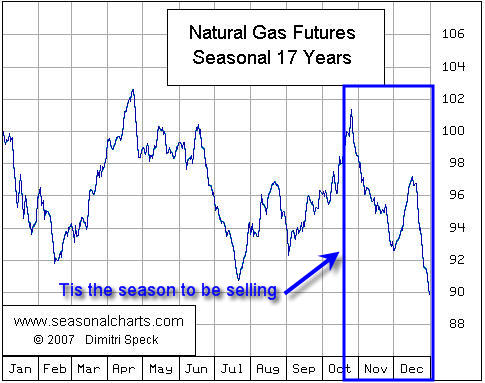
The last week of October was something else. Heavy fiscal year end selling for mutual funds seemed to put a damper on good news and push stocks and commodities lower. October is historically a tough month on the US market with mutual funds locking in profits on their books.

Below are some charts showing my analysis on gold, silver, oil, natural gas and the S&P 500 index along with a seasonality chart proving that October has more selling pressure than other months.

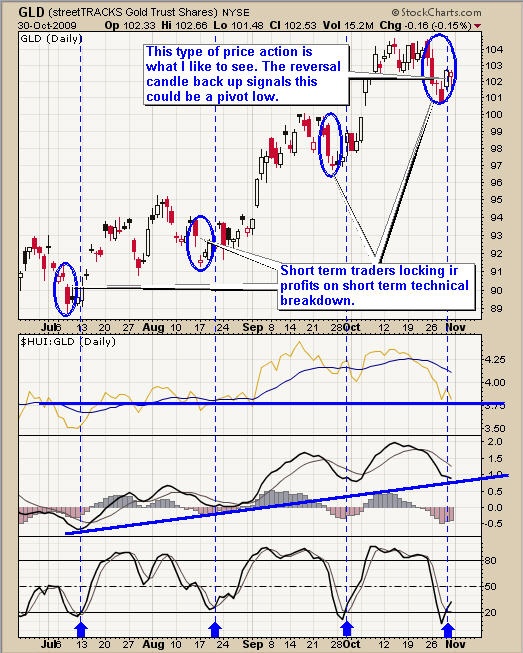
Gold GLD ETF – Gold Pivot Trading Low – Daily Chart
As you can see from the chart below we appear to be in the middle of a pivot low correction which can make for some great entry points. The trend is up, gold is oversold and it looks like we had a reversal low last week.

Gold Pivot Trading Low

Gold Pivot Trading Low

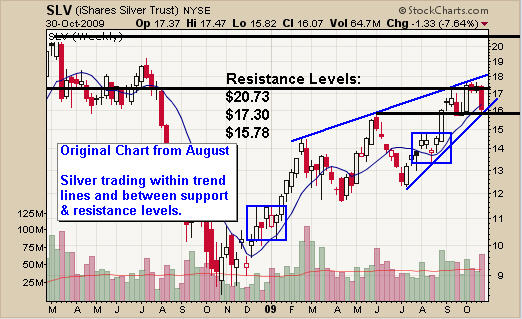
Silver SLV ETF – Silver Pivot Trading Low – Weekly Chart
This is a chart I posted a couple months ago and so far silver has traded within the trend lines and support & resistance levels I pointed out in early August. Silver still looks bullish as it is trading at a pivot low.

Pivot Trading Low for Silver

Pivot Trading Low for Silver

Gold Miners GDX ETF – Gold Miners Pivot Trading Low – Weekly Chart
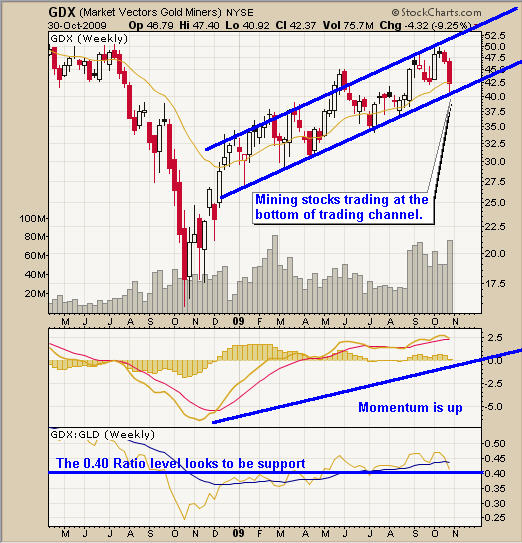
Gold mining stocks appear to be trading near the bottom of the trend channel. The odds are still pointing to higher prices.

Gold Miners Trading Pivot Low

Gold Miners Trading Pivot Low

Crude Oil USO Fund – Oil Pivot Trading Low – Daily Chart
This chart of USO is also from a recent post in early October. USO broke out and is now trading at our support trend lines. There was a nice reversal candle last week but the heavy selling across the entire market pulled oil back down.

Crude Oil Pivot Low

Crude Oil Pivot Low

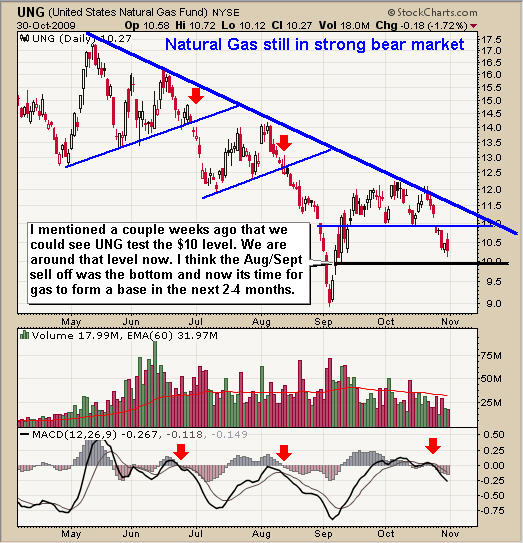
Natural Gas UNG Fund – Natural Gas Pivot Trading Low – Daily Chart
Pivot trading low could be close for UNG. The daily chart is telling me we saw the bottom in natural gas back in September as prices collapsed washing out most long (bullish) traders. I figure we will see prices trade between $9-12 for several months as the commodity forms a base.

Natural Gas Pivot Trading Low

Natural Gas Pivot Trading Low

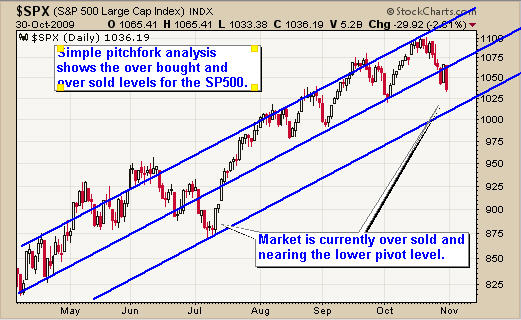
S&P 500 Index – S&P 500 Pivot Trading Low – Daily Chart
The broad market looks and feels oversold. This chart uses Andrews Pitchfork analysis to show where short term pullbacks to the middle trend line (middle of trading range) have been a buying opportunity. Deeper corrections drop to the bottom support trend channel. These corrections sometimes form a lower low and lower high that scares traders and inestors out of the market before heading higher.

SPX Pivot Low

SPX Pivot Low

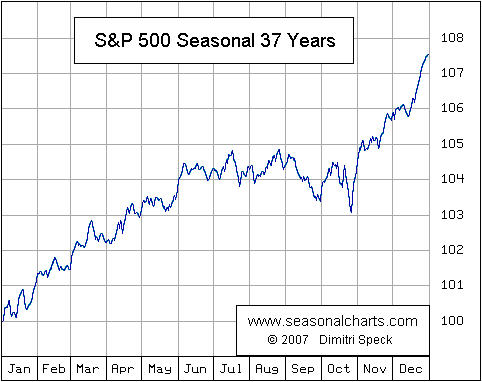
S&P 500 Seasonality Chart – S&P 500 Pivot Trading Low
This chart shows the performance for each month over the past 37 years. Simple analysis shows selling pressure in Sept and Oct as mutual funds sell positions to lock in gains for their books each year. This move is generally compounded because seasoned traders know about this seasonal movement and also sell positions and even short the market to take advantage of this at times.

I think we are inline for a perfect storm going into year end. The market is trading at a pivot low from many different analysis theories. This forms a high probability trading opportunity in the next 2 months if we see prices reverse and start heading higher this month.

SPX Seasonal Trend Pivot Points

SPX Seasonal Trend Pivot Points

Pivot Trading Low Conclusion:
A lot of stocks have taken a real beating this past month as sell orders flooded the trading desks last week. Technology, financials and small cap stocks took is the worst. The sharp drop is not really what we wanted to see but it makes good sense. With those groups posting the largest gains since March it is only normal that money will be coming out of those stocks to lock in gains.

Many traders are starting to panic about another possible market melt down. This negative sentiment is a bullish indicator for higher prices. If everyone is scared and exiting their positions then we must be close to trading a pivot low.

I am still bullish on the market and will be looking for new opportunities if we see prices start to head higher this month.

To receive my Free Trading Reports via email fill out the form:

Chris Vermeulen