Is The Technology Sector Setting Up For A Crash? Part III
FANG stocks seem uniquely positioned for some extreme rotation over the next 6+ months. The continued capital shift that has taken place over the past 5+ years has driven investment and capital into the Technology sector – much like the DOT COM rally. The euphoric rally in the late 1990s seems quite similar to today.
The biggest difference this time is that global central banks have pushed an easy-money monetary policy since just after 2000. The policies and rallies that took place after 9/11 were a result of policies put in place by George W. Bush and Alan Greenspan. Our research team believes these policies set up a process where foreign markets gorged on cheap US Dollars to expand industry and manufacturing throughout the late 1990s and most of the early 2000s. This process sets up a scenario where the US pumped US Dollars into the global markets after the 9/11 terrorist attacks and foreign markets gobbled this capital up knowing they could expand infrastructure, industry, and manufacturing, then sell these products back to the US and other markets for profits. Multiple QE attempts by the US Fed continued to fuel this capital shift.
It wasn’t until after 2008-09 when the US Fed entered a period of extreme easy money policy. This easy money policy populated an extensive borrow-spend process throughout most of the foreign world. Remember, as much as the US was attempting to support the US markets, the foreign markets were actively gorging even more on this easy money from the US and didn’t believe anything would change in the near future. China/Asia and most of the rest of the world continued to suck up US Dollars while pouring more and more capital into industry, manufacturing and finance/banking.
This process of borrowing from the US while tapping into the expanding US markets created a wealth creation process throughout much of Asia/China that, in turn, poured newly created wealth back into the US stock and real estate markets over the past 7+ years. It is easy to understand how the trillions pushed into the markets by the US Fed created opportunity and wealth throughout the globe, then turned into investments into US assets and the US stock market. Foreign investors wanted a piece of the biggest and most diverse economy on the planet.
This foreign investment propelled a new rally in the Technology sector, which aligned with a massive build-out of technology throughout the world and within China. Remember, in the late 1990s, China was just starting to develop large manufacturing and industry. By the mid-2000s, China had already started building huge city-wide industry and manufacturing. But in the late-2000s, China went all-in on the industry and manufacturing build-out. This created a massive “beast” in China that depends on this industry to support finance and capital markets. This lead to the recent rise in the global and US markets as all of this capital rushed around the globe looking for the best returns and safest locations for investment.
FANG stocks have taken center stage and the recent rally reminds of us the DOT COM rally from the 1990s. Could the Coronavirus break this trend and collapse future expectations within the global markets? Is it possible that we are setting up another DOT COM-like bubble that is about to break?
THE WEEKLY CHART OF APPLE (AAPL)
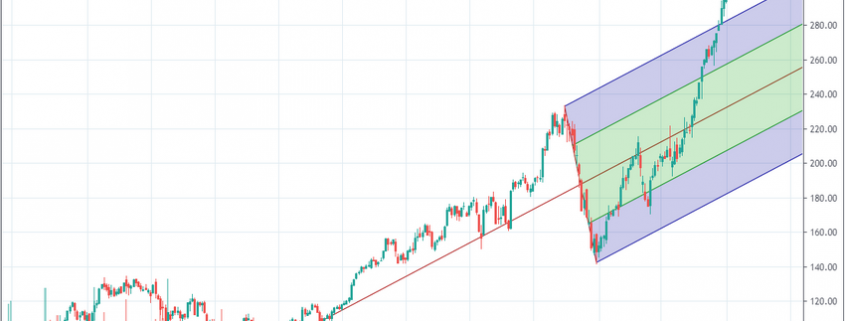
This first Weekly chart of Apple (AAPL) shows just how inflated price has rallied since August 2019. The share price of AAPL has risen from $220 to almost $320 in the last 6 months – an incredible +49%. We attribute almost all of this incredible rise to the Capital Shift that took place in the midst of the US/China trade war. Foreign capital needed to find a place to protect itself from currency devaluation and to generate ROI. What better place than the US Technology Sector.

THE WEEKLY CHART OF FACEBOOK (FB)
Facebook has also seen a nice appreciation in value from the lows in late 2018. From the August 2019 date, though, Facebook has seen share prices rise about +25% – from the $180 level to the $225 level. Although many traders may not recognize the Double Top pattern set up near the $220 level, we believe this setup may be an early warning that Technology may be starting to “rollover” as capital may begin searching for a safer environment and begin exiting the Technology sector.

THE WEEKLY CHART OF GOOGLE (GOOG)
Google (Alphabet), GOOG, is another high-flier with share prices rising from $1200 to $1500 from August 2019 till now – a +28% price increase. We can clearly see that GOOG is well above the historic price channel set up by the rotation in late 2018. We believe resistance near $1525 will act as a price boundary and may prompt a downside price rotation associated with the rotation away from risk within the Technology sector. Any downside move, if it happens, could prompt a price decline targeting $1350 or lower.

CONCLUDING THOUGHTS:
Remember, we are warning of a change in how capital operates within the markets. The Capital Shift that has continued to drive advancing share prices in Technology may be nearing an end. It does not mean the capital shift will end, it just means this capital may rotate into other sectors in an attempt to avoid risks and seek out returns. We believe this is a real possibility because we believe the Coronavirus in China is disrupting the markets (supply/manufacturing and consumer spending) by such a large factor that we believe capital will be forced to identify new targets for returns. In other words, we believe the Technology Sector may be at very high risk for a price reversion event if this “black swan” event continues to disrupt the global markets.
Let’s face it, a very large portion of our technology originates and is manufactured in China. In fact, a very large portion of almost everything we consume is manufactured in China. Heck, the cat food I buy every week is made in China. If this Coronavirus continues to force China to shut down large sections of their nation and manufacturing while it continues to spread, then the only real outcome for the rest of the world is that “China manufacturing capabilities will be only 10~20% of previous levels” (if that).
Once supply runs out for most items originating from China, then we are going to have to deal with a new reality of “what are the real future expectations going to really look like” and that is why we are preparing our followers and friends the Technology sector may be one of the biggest rotating sectors in the near future.
Join my Swing Trading ETF Wealth Building Newsletter if you like what you read here and ride my coattails as I navigate these financial markets and build wealth while others lose nearly everything they own.
Chris Vermeulen
www.TheTechnicalTraders.com

NOTICE: Our free research does not constitute a trade recommendation or solicitation for our readers to take any action regarding this research. It is provided for educational purposes only. Our research team produces these research articles to share information with our followers/readers in an effort to try to keep you well informed. Visit our web site (www.thetechnicaltraders.com) to learn how to take advantage of our members-only research and trading signals.

