President Donald J. Trump was elected the 45th President of the United States to preside over the largest debt collapse ever in U.S. history. During this four-year term, he and his administration will be most feared and hated president there ever was. The odds are stacked high against his ideology of “Making America Great Again” during his term in office.
Debt deflation is a concept that was first introduced in 1933 by the economist Irving Fisher. Debt deflation is a concept whereby the combination of high levels of debt and falling prices cause a downward spiral in the economy. When there is deflation in an economy, those who are in debt become significantly worse off financially. Deflation causes prices and wages to fall and the value of money to rise which increases the real value of debts thereby causing it to become more difficult for people to pay off their debts, i.e.: people holding mortgages would be forced into selling their homes. However, the selling of assets only served to worsen the situation by causing prices to fall even further – creating more deflation. This affects all those people who are in debt and the cycle repeats itself exponentially. Hence, the beginning of the “Next Great Reset of 2017-2020” which should start June/July of this year.
As many Americans enter retirement, they are realizing one unfortunate fact. The fact is that the new retirement plan means no retirement, at all, and is called the Retirement Myth.
One of the promises of the American Dream was the idea of a comfortable retirement, however, this will NOT materialize due to financial swindling and a real estate bubble. Most Americans have incurred massive debt and have consumed their future nest egg by making purchases beyond their budgets and are living beyond their means. We are now left with over 75,000,000 ‘baby boomers’ which a large portion of them are entering retirement with very little and/or no savings. DEBT has enslaved them!
The stock market collapse of 2008 resulted from a class of “subprime mortgage bonds” going into default. Today, the triggers for our financial crisis in the U.S. are still there to cause a hiccup in a Treasury bond auction, trouble in the settlements of derivatives contracts held by major banks or default on leveraged finance loans or high-yield junk bonds. Apparently, we cannot live without debt as it has become the American Way! Your next pension check or social security check could soon be cut back or eliminated altogether, regardless of legal government guarantees. A loss such as this could be both debilitating and devastating for retirees. Global Central Banks have destroyed the financial markets.
Timing Is Everything!
The next BIG TRADE is here. You should take advantage of my hard work and expertise to help make you wealthy. Protect your financial future by tuning in every morning for my current video update on all asset classes and new trade set ups. Your future should involve a proven strategy. We have just entered a new TGAOG commodity trade which looks to be nearing its’ multi-year lows and is forming a bottoming pattern. You want to be in the next trade of the Next Hot Sector setup!
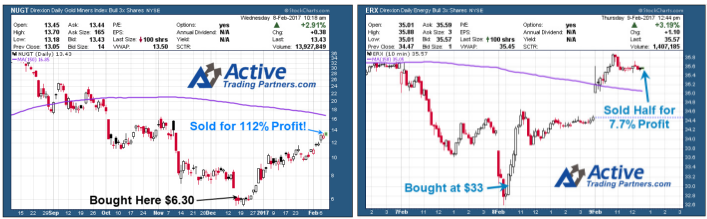
Followers of my work locked in 112% profit this week in a swing trade with NUGT, and another 7.7% in 24 hours with ERX, which we are still long a portion and expecting further gains. All the trades are based on my Momentum Reversal Method (MRM) trading system. There are two key components of this trading strategy.
You will receive NEW explosive trade setups Every Week!
https://thegoldandoilguy.com/wp-content/uploads/2016/04/recovery-is-possible.jpg12951910adminhttp://www.thegoldandoilguy.com/wp-content/uploads/2014/11/tgaoglogo.pngadmin2017-02-11 06:29:532017-02-10 11:18:13The New Retirement – Big Pill To Swallow!
Where is this economic boom that Former President Obama and his administration had taken so much credit for?
The Obama Administration, with the assistance of the Federal Reserve and Company, deliberately kept the U.S. economy from creating any growth at all. The money that flowed from the Federal Reserve, over the last 8 years, had a direct pipeline that flowed only into Wall Street Investment Banks. The American people were sold this false bill of sale that “Quantitative Easing” was going to make lending money to “Main Street America” easier to access. They promised that there would be a boost in hiring which would, in turn, increase aggregate demand and thereby reflect a newly stimulated economic growth!
This QE effectively down-sized the middle class into minority status. The largest growth has occurred within the low-income category. Despite the stock market reaching near all-time highs and real estate bubbling over once again, there are now 45 million Americans on food stamps. This number is at an all-time high. People are feeling poorer today than ever, and with sky rocketing real-estate prices those who do not own a home cannot afford to buy anymore!
This massive disconnect is expanding exponentially. The velocity of money is the number of times that currency is turned over to purchase domestically- produced goods and services. One can see, as in the chart below, that the velocity of money has been steadily decreasing. There are less transactions occurring by individuals in our economy. One can see that the money never reached “Main Street America” which is why there has not been any demand for goods and services.
The average American is now barley scraping by and many do a lot of their shopping at dollar stores. Most the growth in the job market is in low wage jobs which have zero benefits! The clear majority of Americans have bought into the propaganda promoted by the controlled media outlets.
The masses bought into this propaganda as Wall Streets’ big banks kept artificially inflating the equity markets with free and cheap money, which was at the expense of U.S. taxpayers.
The Obama Machinery put on a stellar performance for the American people, however, this was a fictitious story. In fact, the real number, as of January 2017, of unemployed Americans currently stands at 22.9%: (http://www.shadowstats.com/alternate_data/unemployment-charts). The big gains have been largely allocated to the well-connected financial sector.
Corporations took advantage of low interest rates to buy back stock in their own companies. Since 2008, corporate stock buybacks have surpassed $2.2 trillion. These buy backs have only increased the price of corporate stocks and made their companies appear more valuable than they are. This means that stock prices are far above what they would be if it were not for extremely low interest rates. The politicians believed that it was more important to create a false front and to continue the illusion so that they would remain in power.
The Tax Foundation reports that 60% of the population now receives more in government benefits than what they pay in taxes. What does this say about a society in which more than half of the population are living at the expense of the other half? Currently, what is even worse is that the dependent class is steadily growing. The 60% will soon become 70%.
Mr. Hayek stated that “Capitalism is the only system of economics compatible with human dignity, prosperity, and liberty. To the extent, we move away from that system, we empower the worst people in society to manage what they do not understand”.
On March 23rd, 2009, the then Treasury Secretary, Tim Geithner sent the stock markets soaring. He announced a plan to help banks unload illiquid securities of uncertain worth from its’ balance sheets. The Wall Street headlines read “Toxic-Asset Plan Sends Stocks Soaring”. Federal Reserve Chairman Ben Bernanke implemented “financial engineering” (https://en.wikipedia.org/wiki/Financial_engineering) as the sole solution to all our financial problems.
He was publicly opposed to the nationalization (https://en.wikipedia.org/wiki/Nationalization) of banks and said “the bookkeeping problems of many banks are largely an artifact of foolish federal regulations. Capital standards, accounting rules and other regulations have made the financial sector excessively procyclical.” As we are presently realizing, government control over the financial markets and the economy have failed us. What we needed was the Federal Government to focus on job creation and to restructure our economy for new and future growth.
They were laser focused on merely bailing out Wall Streets’ big banks. In my view, the Federal Government should only be focused on its’ constitutional responsibilities. Keeping the free markets out of their control and protection and serving the American people should be their primary goal.
They needed to allow deflation to play out its’ cyclical role. However, it turned out worse as they attempted to control it. Federal Government bailouts resulted in financial enslavement. There was further unequal distribution of wealth in our society. Today, in 2017, I clearly see the implosion of America, as we once lived and knew it to be.
The economy was being run on non-to low growth policies intentionally. President Obama deliberately took the path of doing absolutely nothing. He did not want to be accountable for any economic growth most likely because a stock market crash would ensue. That would have placed pressure on wages that would cause inflation at which time the Federal Reserve would be forced to raise interest rates. If this had occurred, all the free money which Wall Street investment banks received would not have been invested in the equity markets.
The GDP Annual Growth Rate in the United States merely expanded by 1.90% in the fourth quarter of 2016, over the same quarter of the previous year. A record low of -4.10% was reported in the second quarter of 2009.
They purchased their own shares back which sent stocks higher into unchartered territory. The way that they played the game was to keep inflation at bay and allow us to wallow in a deflationary contracting economy. As stock prices rallied upwards, the corporate executives continued to receive heavy compensation on cheap cash being provided to them. In the term that Chairwoman Yellen resides over, she has only increased interest rates twice by a mere marginal 25 basis points. This was an immaterial rate hike so as the Federal Reserve could maintain their credibility. Increasing interest rates would have killed this game of “cheap money” which kept the wealth flowing into the top 1 percent. The Federal Reserves’ decision to not raise interest rates during their last meeting (http://money.cnn.com/2017/02/01/news/economy/federal-reserve-january-meeting/index.html) sends a clear and powerful message that they do not want to go down the path of normalization (http://www.discovery.org/a/23721) . They want to continue to artificially suppress interest rates. If they had attempted to “normalize”, it would create massive assets and derivative bubbles bursting domestically and globally. Either the bubble will burst or we will return to inflation.
President Trump wants to create the growth which former President Obama never accomplished. He is proposing tax cuts, introducing fiscal stimulus and removing all the red tape that has been so costly for small businesses to implement. He has also promised to lift GDP to 4% by spending $1 trillion to rebuild America’s infrastructure. This will overheat the economy! Trying to implement his plans will call for deep cutbacks in Medicare and Social Security. It will take years to forge ahead with legislative approval.
Conclusion:
Where is this economic recovery that supposedly happened? It exists in the stock market at present as the masses are enduring a poorer quality of life!
Our subscribers are currently in a swing trade with NUGT (http://www.etf.com/NUGT) which is up 95.8% currently and we are expecting further gains going into this week. All the trades are based on our Momentum Reversal Method (MRM) trading system. The strength of the precious metals will continue to drive gains for our NUGT position. Expect some very interesting and exciting new trades this week. We are getting ready for some very explosive moves.
https://thegoldandoilguy.com/wp-content/uploads/2015/10/fed.png202315adminhttp://www.thegoldandoilguy.com/wp-content/uploads/2014/11/tgaoglogo.pngadmin2017-02-06 10:05:092017-02-06 10:05:09Can New President Make Things Better for the People?
Our recent analysis bases on a previous report of the potential for a further run in the US markets based on a number of technical and fundamental factors leads to the question of “what could happen with Gold and Silver”. A broad US market rally may put some pressure on the metals markets initially, but, in our opinion, the increase in volatility and uncertainty will likely prompt more potential for upward price action in precious metals.
As with most things in the midst of uncertainty and transition, the US Presidential election has caused many traders to rethink positions and potential. As foreign elections continue to play out, wild currency moves are starting to become more of a standard for volatility. Combine this with a new US President and a repositioning of US global and local objectives and we believe we are setting up for one of the most expansive moves in recent years for the US general markets and the metals markets. This week, alone, we have seen a flurry of action in DC and the US markets broke upward on news of the Dakota Pipeline and other Executive actions.
As we wrote week or so ago, we believe the US markets will push higher in 2017 a business investment, US strategy and foreign capital runs back into the US equity market chasing opportunity and gains. Additionally, we believe the strength of the US market, paired with continued strength of the US Dollar, will drive a further increase in global volatility and wild swings in foreign markets. This volatility, uncertainty and equity repositioning will likely drive Gold and Silver to continued highs throughout 2017 – possibly much longer if the new trend generates renewed follow-through.
Our belief that the US markets will continue to melt-up while certain foreign markets deteriorate relates to our belief that currency variances will become more volatile and excessive over the next few months. This, in combination with a renewed interest in developing US economic solutions, will likely drive the US markets higher while the metals markets will continue to become a safe-haven for US and foreign investors to protect against deflation and foreign market corrections.
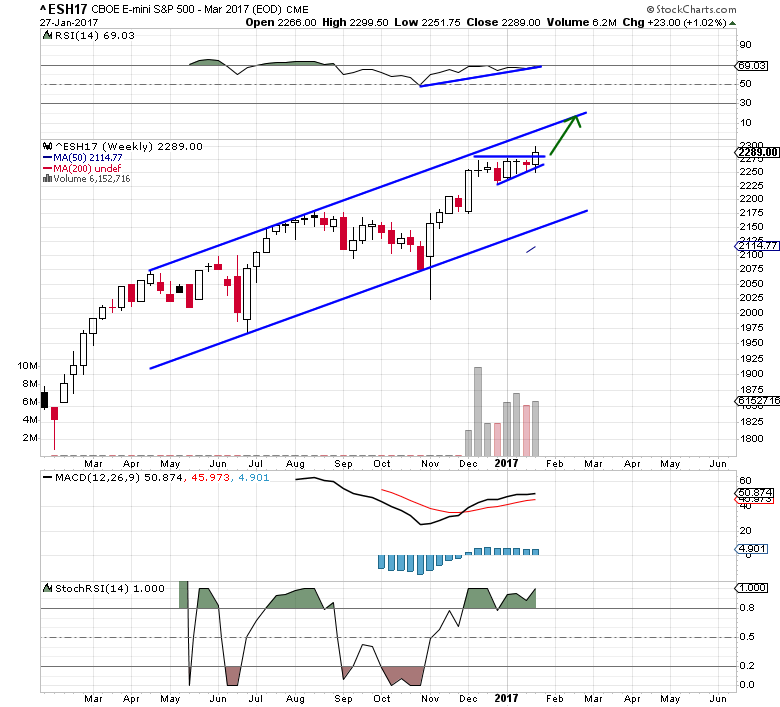
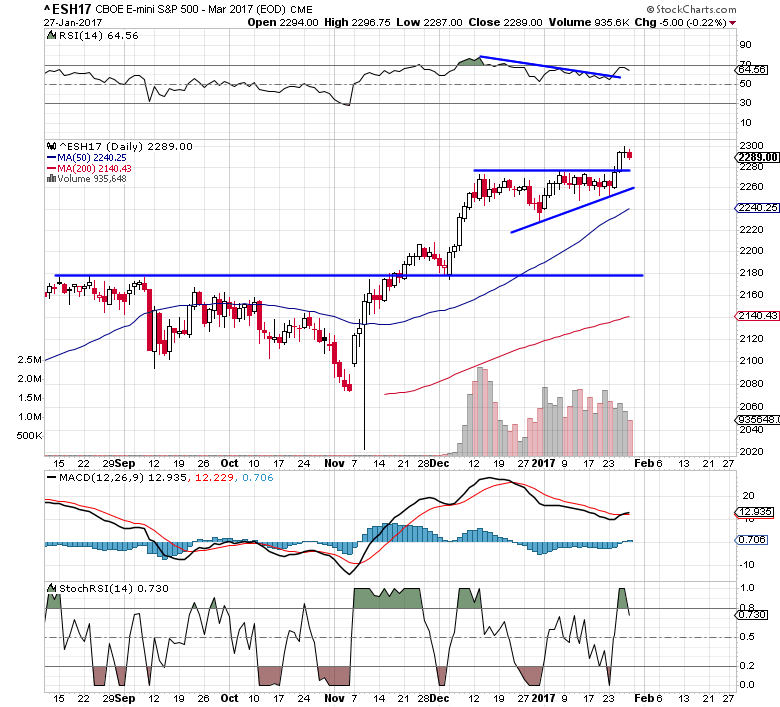
S&P Futures are setting up a clear bullish pennant/flag formation that will likely prompt an explosive price move within 2~3 weeks. This bullish flag formation is likely to drive the ES price higher by roughly 100+ pts. Currently, strong resistance is just above 2275, so we’ll have to wait for this level to be breached before we see any potential for a bigger price move.
SP500 Weekly Chart
SP500 Daily Chart
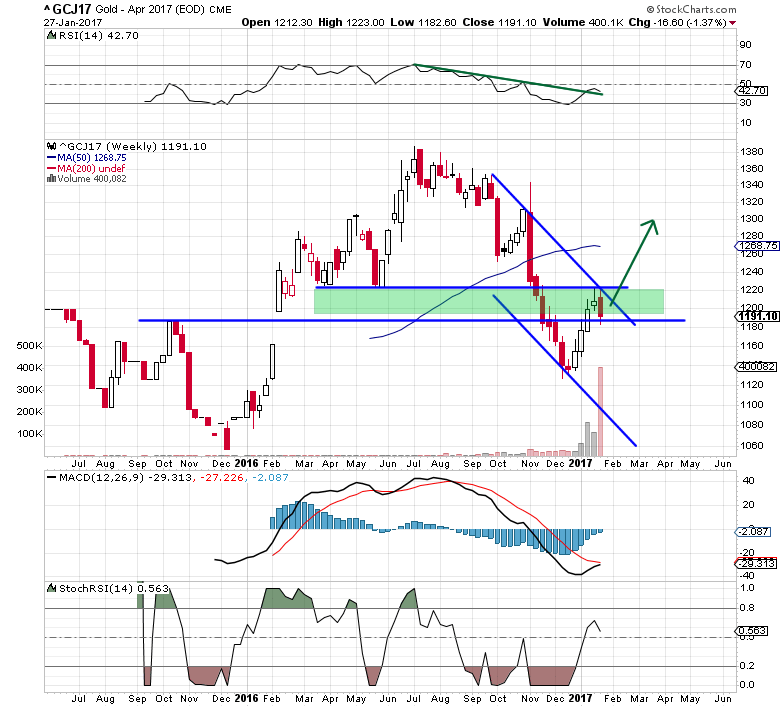
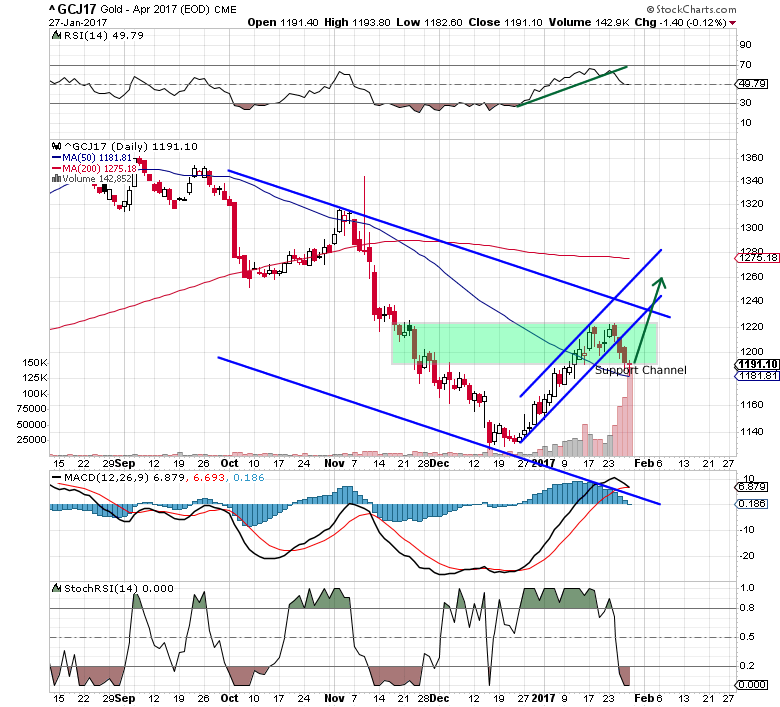
GOLD is channeling in a very clear and narrow upward price channel and trading in the middle of a support zone. The recent reversal, near the end of 2016, was interesting because GOLD trailed lower after the US election, but then reversed course just before the new year. The interesting fact about this move is that this new upward swing in GOLD correlates with the beginning of the Bullish Flag in the S&P Futures as well as a decrease in volatility. We believe as this Bullish Flag will prompt a jump in volatility and price action that will result in is a strong push higher in GOLD.
GOLD Weekly Chart
Gold Daily Chart
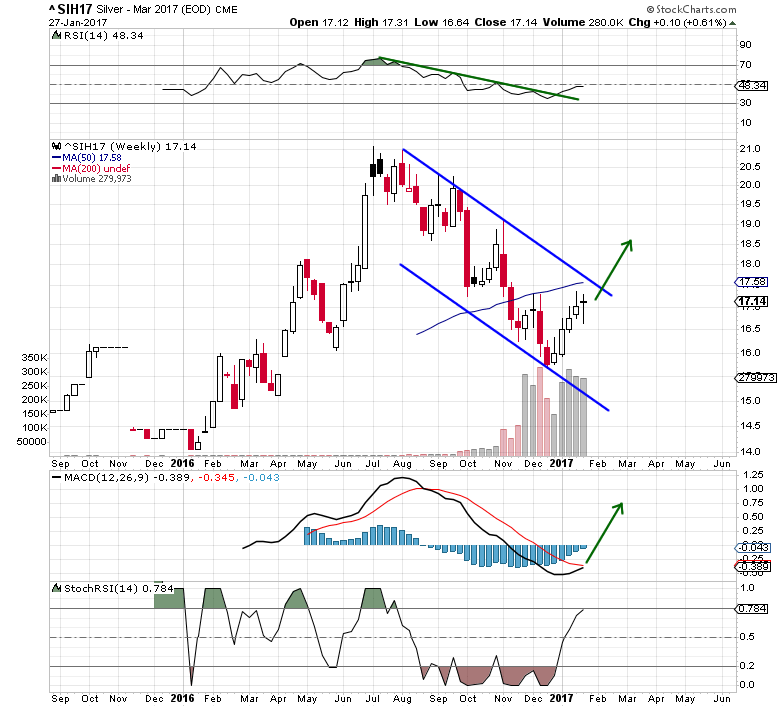
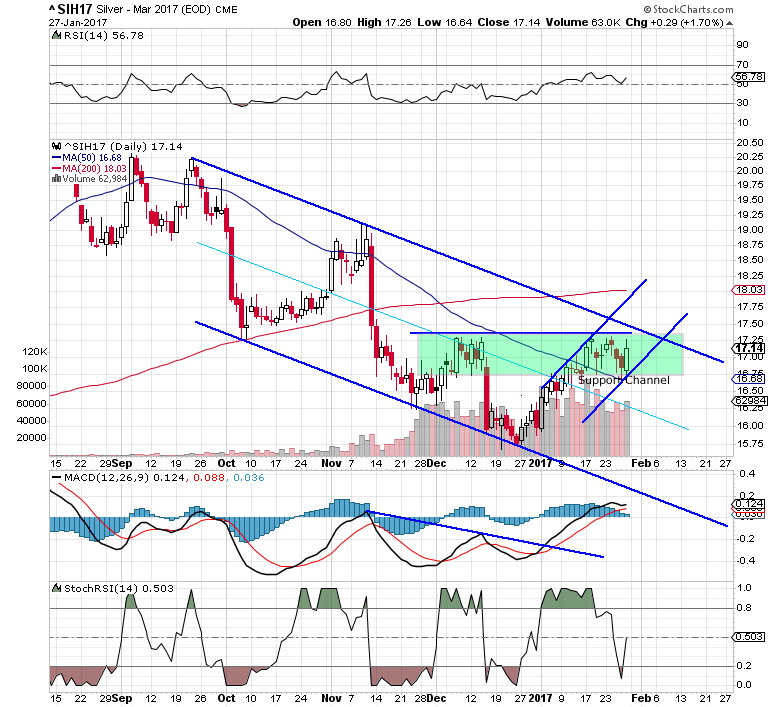
SILVER is setting up in a similar manner as GOLD. Although the SILVER chart provides a clearer picture of the downward price channel that is about to be breached – and likely drive both SILVER and GOLD into a new bullish rally. The support Zone in SILVER, between $16.60 ~ $17.40 is still very much in play. SILVER will likely stay within this zone while the Bullish Flag plays out. Yet, when the breakout begins, a move above $18.00 will be very quick and upside targets are $18.50~18.75 and $19.50~$20.00 (possibly much higher in the long run).
SILVER Weekly Chart
Silver Daily Chart
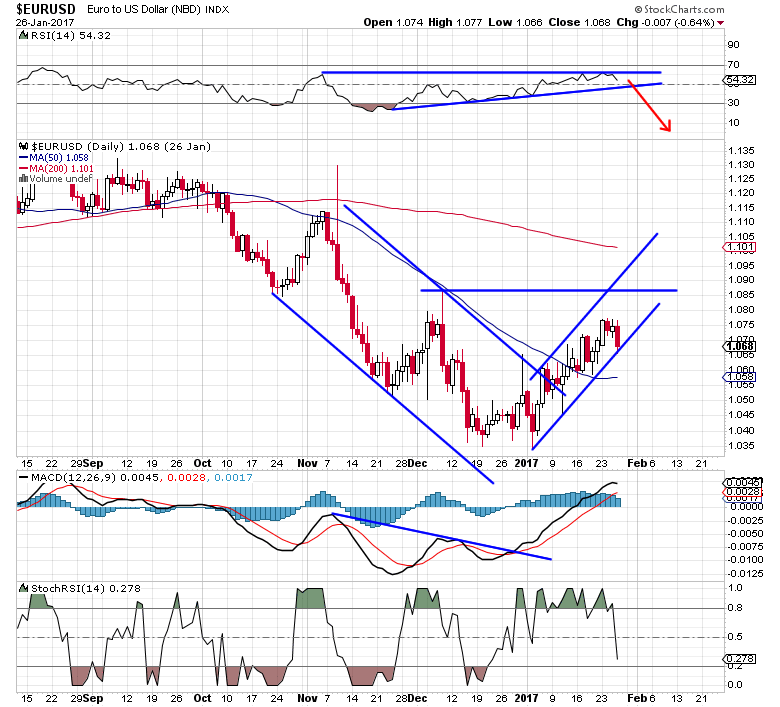
EUR/USD correlation to the US moves should be viewed as measure of strengthening US economy/USD as related to foreign market volatility and potential. As the USD strengthens, this puts pressure on foreign governments and global transactions based in USD. This also puts pressure on the METALS markets because billions of people around the globe consume precious metals as a “safe-haven” related to currency volatility. We expect the EUR/USD levels to fall near “parity” (1.00) again and possibly dip below parity based on future foreign election results. This volatility and uncertainty will translate to increased opportunity for GOLD and SILVER to run much higher over the next few months.
EURUSD Daily Chart
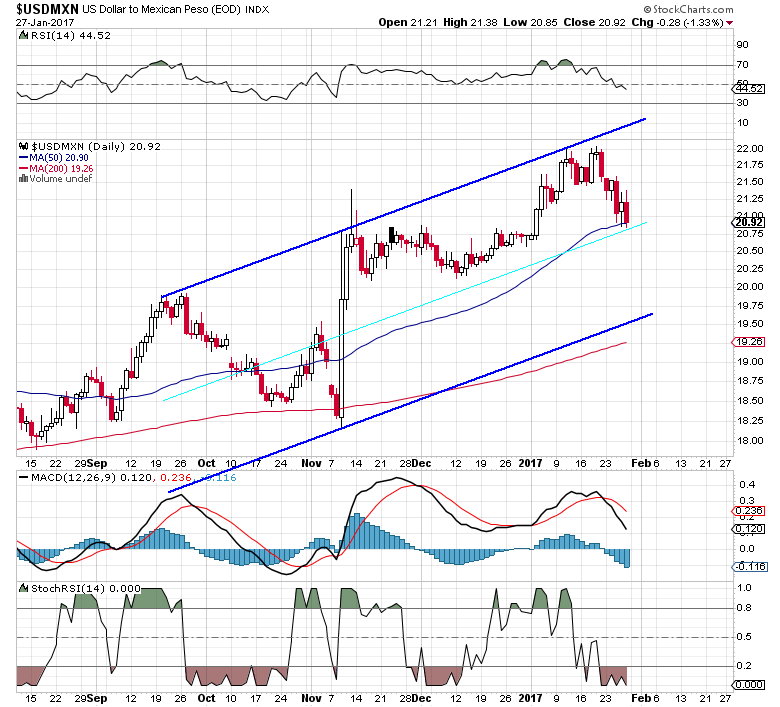
USDMXN Daily Chart
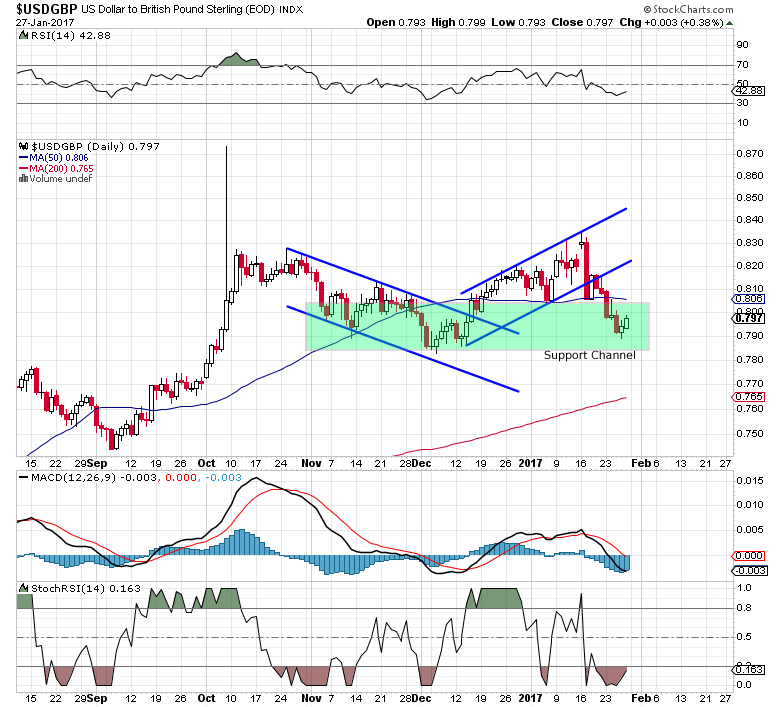
USDGBP Daily Chart
Right now is a fantastic opportunity to take advantage of these lower prices. We may see rotation near to the lower support zone levels as price rotates over the next few weeks. The key to any trade in the metals market is to understand the potential moves and watch for confluence and volatility in other markets. We believe the next few weeks/months will be very telling. If we are correct, we’ll see new highs in the US markets fairly quickly and we’ll see a new potential bullish breakout in GOLD and SILVER.
US Equities opened higher this morning and are setting up for a sharp pullback based on technical analysis using trends, cycles, momentum, volume, market breadth and key resistance zones.
Take a look at the charts below for a quick flash of what I think.
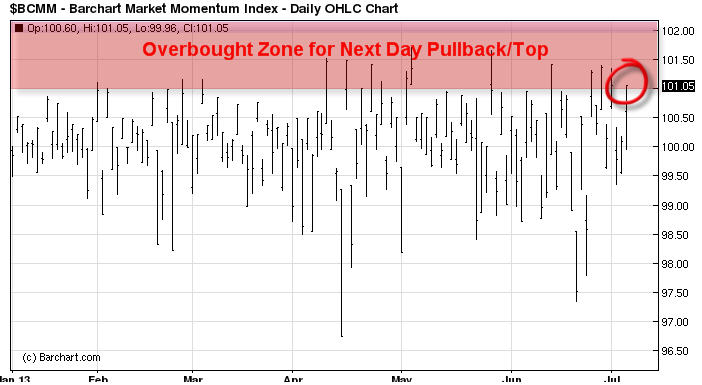
Barchart Market Momentum Index
This chart I look at daily. In short if its price is at 101 or higher I expect the broad market to pause or pullback within the next day. It tells me if stocks have moved to far in one direction on a daily basis and if so sellers (big money players) are likely to re-align stocks by taking profits or shorting during these times.
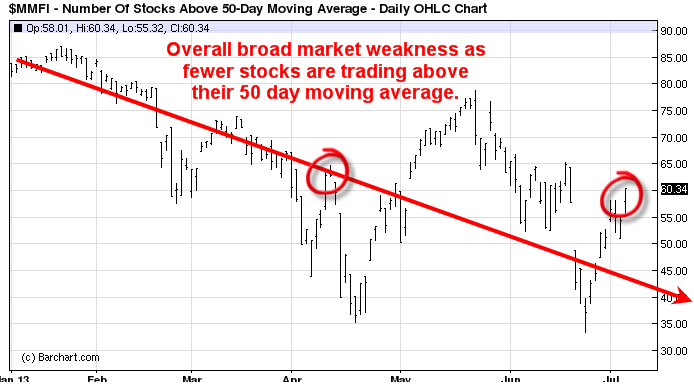
Stock Trading Above the 50 Day Moving Average
Here we can see that while the SP500 has been rising over the past 6 months less stocks are trading above their 50 day moving average. This means a smaller group of stocks is holding the market up and it’s just a matter of time before those stocks burn out and roll over also.
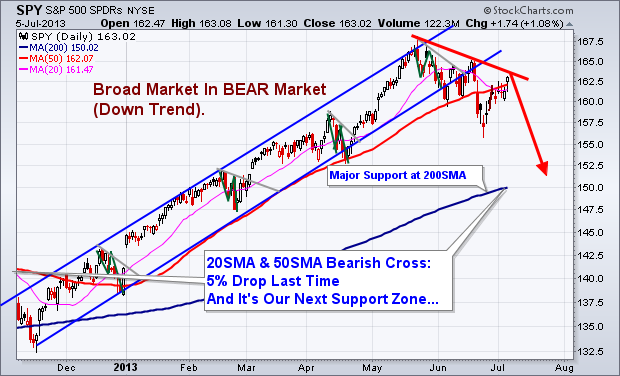
SPY Swing Trading Analysis – Daily Chart
With the SP500 breaking down from its trend channel and testing a short term resistance trend line. Odds favor sellers should become more active and pull the market down as they unload any remaining long positions and possibly get short the market. Both of these actions will put pressure on US Stocks.
Big Picture Outlook – Don’t Get Me Wrong!
This chart is just to show you what is possible. I am not a perma-bear nor do I want another bear market like this to happen. But knowing what is possible still has to be known. Major market tops are a lengthy process and tends to take several months. If this is the case then it could be a wild and choppy market for the rest of 2013 and a great way to play this is through writing options. Do not expect price to just collapse and free fall for 18 months… Dreams like that do not happen. Bear markets must be actively traded as they carry a lot of risk.
Flash Chart Analysis Conclusion:
This week is do or die for US stocks. We need sellers to step in here and pull stocks down. With the SP500 trading at resistance, stocks being overbought on a short term basis and the holiday week behind us which typically favors higher prices it is now time for sellers to become active once again.
http://www.thegoldandoilguy.com/wp-content/uploads/2014/11/tgaoglogo.png00adminhttp://www.thegoldandoilguy.com/wp-content/uploads/2014/11/tgaoglogo.pngadmin2013-07-08 10:47:442014-03-05 13:05:22The 30 Second Technical Flash Chart Report on US Equities