Have We Seen The Peak In The VIX?
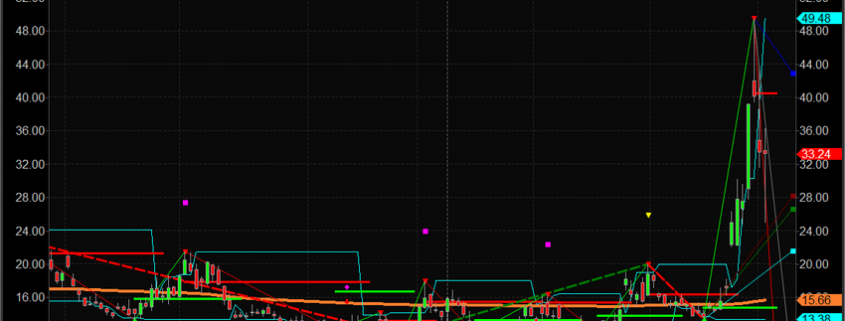
The recent price breakdown in the US stock market (near the end of February 2020) prompted a very big spike in the VIX – could we see another HUGE spike with a deeper price selloff in the near future?
Our researchers believe this first downside price rotation in the US stock market may be just the first downside move in what may become a “waterfall” price event where price declines in a series of downside price waves reaching an ultimate support level. The way the VIX works is to attempt to normalize implied volatility based on available options call and put data over a 30-day span. The process of normalizing this data attempt to eradicate outlier data from the equation. Thus, a VIX level of 40 has likely resulted in completed data that attempts to eliminate outlier data points that may have resulted in a much higher VIX value.
After this recent rally in the VIX level, the current normalization process will likely take the current range of the VIX (options data) into consideration for future VIX levels. Thus, in order for the VIX to reach levels above 40 again, a much bigger downside price move would have to take place – possibly pushing the SPY to levels near $260 or lower. A move like this would have to happen in an aggressive type of price decline in order for the VIX to rally back above 40. Is this something we should expect in the near future?
Options Traders Be Aware: In our next post, we will touch one why trading options in this type of market condition is a major NO-NO.
Be sure to opt-in to our free market trend signals newsletter before closing this page so you don’t miss our next special report!
Our researchers believe the likelihood of a price decline like this is greater than 60% at this time. We believe a Waterfall type of price event is unfolding where the price will attempt to source out true support levels as global central banks position ahead of any economic fallout for Q1 and Q2 of 2020. It is because of these expectations that we believe global traders and investors will suddenly pull capital away from risk, into CASH and safe-havens while the unknowns of the global economic situation play out. This dramatic shift from just 30 days ago may push the VIX to levels above 50 or 60 if we experience another aggressive selloff.
Liquidity becomes a major problem as Algos begin to pull capital out of the markets – like the FLASH CRASH of years ago. This type of activity is already happening as many of our Algos and those of some of our friends have already started identifying severe risk factors in the markets as ATR and VIX have skyrocketed. This lack of liquidity in the global markets could prompt an extended FLASH CRASH type of price event over the next 30 to 60+ days – possibly multiple FLASH events.
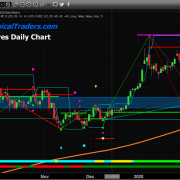
DAILY VIX CHART
This Daily VIX chart highlights the scale of the second Waterfall price event that recently took place. The first Waterfall price move took place in early February and was very minor – yet our researchers caught it.

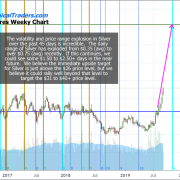
WEEKLY VIX CHART
This Weekly VIX chart highlights what we believe to be a likely scenario where VIX normalizes to levels below 25 over the next 2~3 weeks before another downside Waterfall event takes place as Q1 earnings data is about to hit the markets (near the end of March or early April). It makes perfect sense to us that revisions and announcements will begin to hit the news wires relating to missed earnings and profit expectations near the end of March 2020. If the Coronavirus is still working its way through Europe, the Middle East, and North America, we could be set up for a shocking April 2020 as Q1 earnings are announced. This is what we believe will send the VIX skyrocketing to levels above 45~50 potentially.
A 25 to 35 day period of relative calm (2~3+ weeks) before earnings data starts to funnel into the news cycle. Come early April, if companies have not yet already adjusted guidance, we could be in for a series of surprises that shock the US stock market and send the VIX skyrocketing.

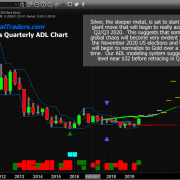
SMART CASH INDEX SHOW GLOBAL EQUITY TREND
Our Smart Cash Index has recently broken below historical support channels and may begin to move into a new downward price channel soon. This would be the first time in over 8+ years that this lower price channel has been seriously threatened in this manner. A new downward price channel setup could indicate some extended downside price moves are in our future. These types of downside price moves could indicate a broader global move away from risk as trader attempt to move capital into the safety of CASH and other investments.

CONCLUDING THOUGHTS:
As we’ve been warning for many months, 2020 is sure to be a very exciting year for skilled traders. Don’t miss any of these incredible opportunities for broad sector swings and bigger moves in the US and Global stock markets. These are the types of price swings that can make fortunes for skilled traders who are ahead of the bigger moves.
In fact, on Friday while traders and investors were down 15% with equities subscribers and I locked in 20.07% profit on our TLT trade and we avoided the equities collapse all together using my proven technical analysis strategies.
As a technical analysis and trader since 1997, I have been through a few bull/bear market cycles. I believe I have a good pulse on the market and timing key turning points for both short-term swing trading and long-term investment capital. The opportunities are massive/life-changing if handled properly.
I urge you visit my ETF Wealth Building Newsletter and if you like what I offer, join me with the 1-year subscription to lock in the lowest rate possible and ride my coattails as I navigate these financial market and build wealth while others lose nearly everything they own during the next financial crisis. Join Now and Get a Free 1oz Silver Bar!
Chris Vermeulen
www.TheTechnicalTraders.com

