Precious Metals and Crude Oil Shows Signs of Strength
The past couple months (May and June) have been tough on precious metals and crude oil. But recent price action shows that buyers are stepping back into the market buying up these commodities once again.
Let’s take a quick look at the charts…
Gold Futures Daily Chart:
As you can see from the chart below, gold is making a new high. The big question is if it will do what it has done many times in the past, which is make a new higher for only a few days to get the general public (herd) long, only to then get sold into and come back down? The next few sessions will give us a better feel for this breakout/rally.
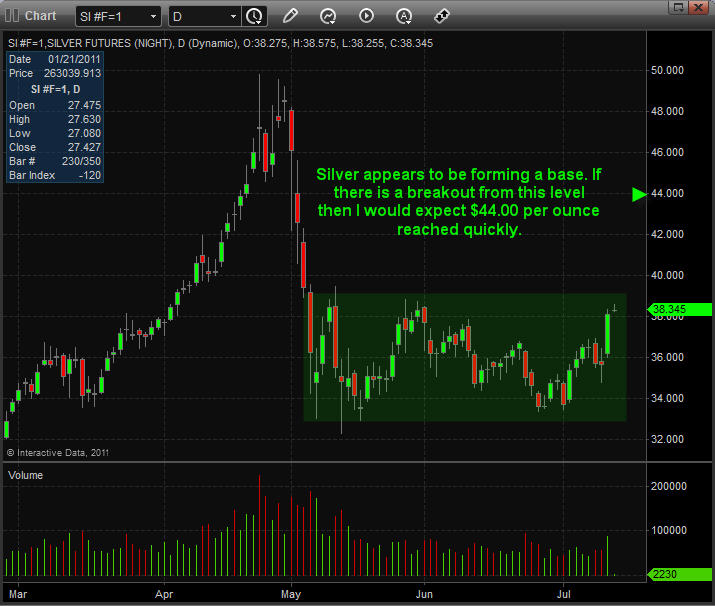
Silver futures Daily Chart:
Silver on the other hand has not performed as well as its yellow sister. Rather we are seeing a base being formed. The exciting thing about base patterns is that the larger and longer the base takes to form, the larger the potential move once a breakout occurs.
Crude Oil Hourly Chart:
Crude oil looks to be forming a base and or inverse head & shoulders pattern. Both these patterns point to higher prices with a price target around the $110-112 area.
Mid-Week Trend Report:
In short, I feel commodities are now in the spot light and where investors will be looking to put their money to work over the next couple weeks as the falling dollar directly helps boost their prices.
The equities market continues to be volatile with large waves of buying and selling almost hitting the them every trading session. During key pivot points in the market we know pricing for investments get a little crazy at times and we manage positions accordingly and anticipate some moves.
That’s all for now, but if you would like to get my pre-market video analysis each morning and intraday updates along with trade alerts be sure to join my premium service here: http://www.thegoldandoilguy.com/free-preview.php
Chris Vermeulen


