Crude Oil Collapsed Below $100PPB – Has The US FED Broken Inflation?
On Tuesday, July 5th, Crude Oil collapsed very sharply, down over 10% near the lows, in an aggressive breakdown of the price. The $97.43 lows reached that day were more than -14% from recent highs (set on June 29, 2022) and more than -21% from highs set on June 14, 2022.
Consumer Discretionary Spending Likely To Fall Further
In a recent research article (published June 9, 2022: CRUDE OIL PRICE AND CONSUMER SPENDING – HOW THEY ARE RELATED), we shared a similar breakdown that took place in Crude Oil in 2009 and how tightening consumer spending often correlates with peaks in Crude Oil when crisis events happen.
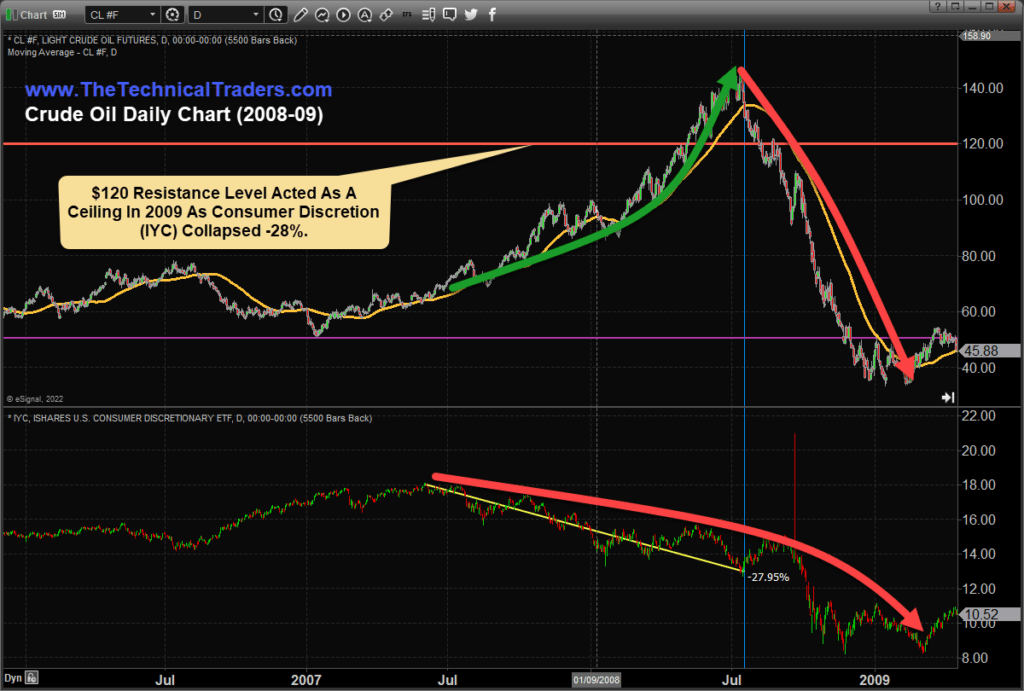
Within that research article, I shared this chart highlighting the collapse in the Consumer Discretionary sector that preceded the downward collapse in Crude Oil. The interesting facet of this chart is we can see the inflationary price pressure in Crude Oil (and the general economy) countered by pressures put on consumers in the lower IYC price chart.
Consumers Lead The Global Economy – Watch IYC Closely
As prices rise, consumers are put under extreme pressure to keep their normal standard of living. As inflationary pressures continue, consumers make necessary sacrifices to manage their budgets – often going into debt in the process.
Eventually, this cycle breaks, and inflationary trends end. This is clearly evident on the chart below in July 2008 – as IYC, the Consumer Discretionary sector, collapsed by more than 27% before Crude Oil finally peaked and broke downward.

Since November 2021, IYC Has Fallen More Than -37%
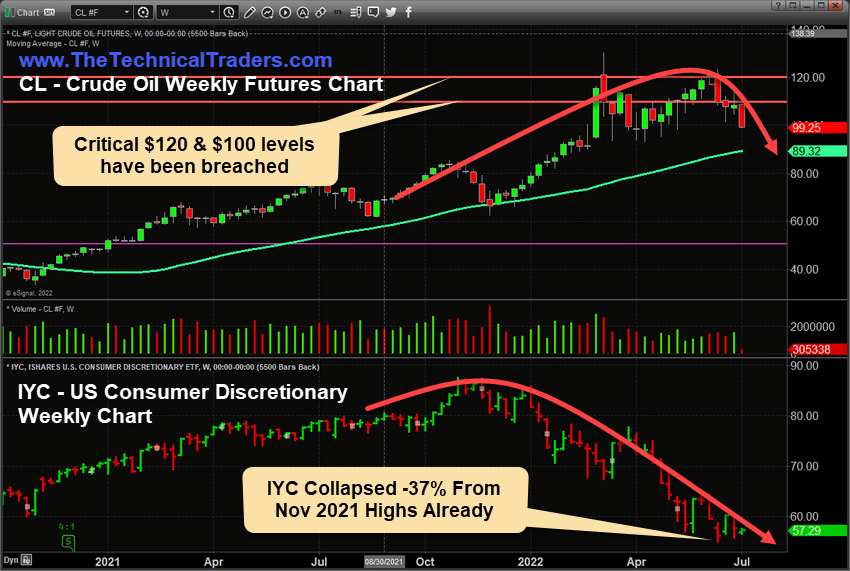
This current Weekly Crude Oil & IYC Chart shows IYC has collapsed by more than -37% from the November 2021 highs – well beyond the -27% collapse in 2008 that preceded the 2008-09 Global Financial Crisis event. Is the current collapse in IYC a sign that a broad global crisis event has already begun to unfold beneath all the news and hype? Will Crude Oil collapse below $75ppb as the global economy shifts away from inflationary price trends and bubbles burst?

The Deflationary Price Cycle Is Not Over Yet
If IYC falls below $55 in an aggressive downward price move, I would state the risks of a global deflationary price cycle (or extended recession) are still quite elevated. Currently, the $55 price level in IYC aligns with early 2019 price highs and reflects an extended price advance from the $12~$15 IYC price levels in 2008-09.
If the $55 IYC price level is breached to the downside, I expect the $37.50~$40.00 price level to become future support – as that price level reflects the COVID-19 event lows.
Still, these lower price targets represent an additional -32% decline in IYC and reflect a total of a -57% collapse in the Consumer Discretionary sector from the November 2021 peak levels. The potential target range of $37.50~$40.00 correlates with the 2008-09 GFC collapse range when IYC fell from $18 to lows near $8 (nearly -57%).
We are still very early in the shifting deflationary cycle phase after the US Fed started raising interest rates. Learn to protect and profit from this global event with my specialized investment solutions. Visit, www.thetechnicaltraders.com to learn more.
LEARN FROM OUR TEAM OF SEASONED TRADERS
In today’s market environment, it’s imperative to assess our trading plans, portfolio holdings, and cash reserves. As professional technical traders, we always follow the price. At first glance, this seems very straightforward and simple. But emotions can interfere with a trader’s success when they buck the trend (price). Remember, our ego aside protecting our hard-earned capital is essential to our survival and success.
Successfully managing our drawdowns ensures our trading success. The larger the loss, the more difficult it will be to make up. Consider the following:
- A loss of 10% requires an 11% gain to recover.
- A 50% loss requires a 100% gain to recover.
- A 60% loss requires an even more daunting 150% gain to simply break even.
Recovery time also varies significantly depending upon the magnitude of the drawdown:
- A 10% drawdown can typically be recovered in weeks to a few months.
- A 50% drawdown may take many years to recover.
Depending on a trader’s age, they may not have the time to wait nor the patience for a market recovery. Successful traders know it’s critical to keep drawdowns with reason, as most have learned this principle the hard way.
Sign up for my free trading newsletter so you don’t miss the next opportunity!
We invite you to join our group of active traders who invest conservatively together. They learn and profit from our three ETF Technical Trading Strategies. We can help you protect and grow your wealth in any type of market condition. Click on the following link: www.TheTechnicalTraders.com to learn how.
Chris Vermeulen
