Most traders just don’t have the time to track the market on an intraday basis. Crazy thing is I found a way that takes advantage of the intraday price action ever needing to look at a single intraday chart. Now we can swing trade using the daily charts but get the added performance of watching the intraday chart price action. What also makes this strategy exciting is that it works with virtually any time frame, thought each time frame and investment vehicle will require its own custom settings in order to track properly.

I call this strategy a Momentum Trend Crossover. It’s based on 2 moving averages that use intraday day, or intra-bar price action to calculate its value. And a Donchian channel to track recent highs/lows for protective stop placement.

Below are three charts showing how it looks and works.

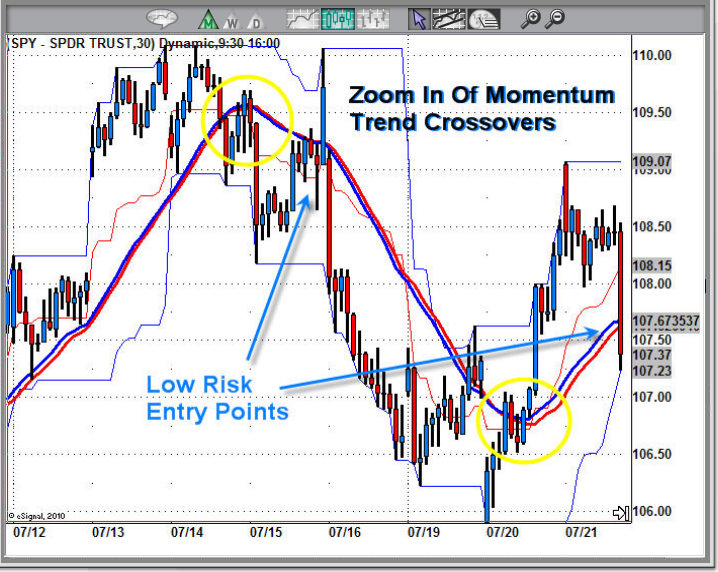
Close Up Of Momentum Crossovers – 30 Minute Chart

The chart below clearly shows how the two average track very closely to another. They both have slight variations in how they calculate their value. In short, when the blue moving average crosses below the red the market is in distribution mode (down trend/sell bounces). And it’s the opposite for when the blue trend line crosses above the red which is accumulation mode (up trend/buy dips).

The Donchian channel is used for entry and protective stops. This indicator has three parts, the upper, middle and lower bands. It tracks the most recent highs and lows providing clear protective stop levels for each trend.

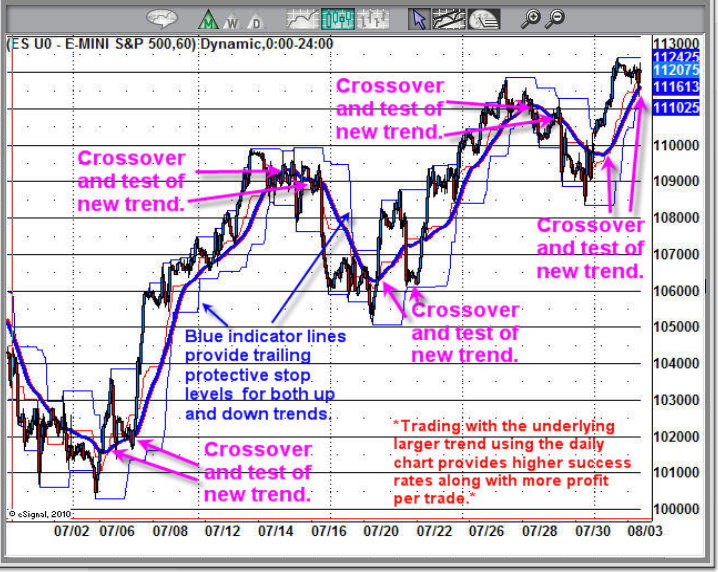
60 Minute Chart – Moving Average Trend Trading Chart

This is an example of a 60 minute chart which I find very helpful in catching decent size trades. As you can see when the moving averages crossover the market reverses direction. The really cool thing about this is that there is almost zero lag in this indicator. Many times the cross over happens before the price starts to drop.

For best results I always make sure the next larger time frame is in favor of the trade I am looking to take. Doing this increased the probability that more trades will become profitable.

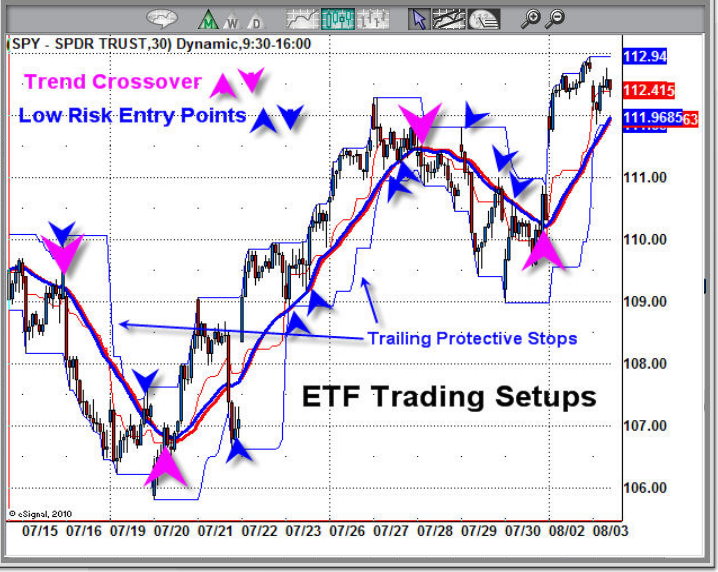
30 Minute Chart – Short Term Trend Trading

This chart shows key reversals and low risk entry points using the Donchian channel and moving average price levels. I know these are intraday charts I am showing you but it can be used with daily weekly and monthly charts also. The intraday charts really show it in action and how choppy market conditions can be filtered to be smooth.

Momentum Trend Crossover Benefits:
• Can be applied to any investment vehicle – Stocks, ETFs, Futures, Currencies
• Customizable to work with any time frame
• The trend is your friend and this always keeps you inline with the trend.
• Eliminates the noise in the market during choppy conditions
• Reduces emotions because you instantly can see when to enter and exit positions

My Thoughts On This Trading Model

I have never been a fan of Moving averages because they lag the market so much. Over the years watching intraday price action in conjunction with the daily chart I found a way to make the moving averages carry over the intraday strength/weakness which in turn gives us an almost real-time, if not early signal about a trend change.

This is one of the strategies I use within my trading newsletters to help generate low risk trading signals. Takes some of the guess work out of trading, that’s for sure!

If you would like to get my trading alerts and learn more about this, please go to www.TheGoldAndOilGuy.com to see what I have to offer.

Chris Vermeulen

GET MY FREE WEEKLY TRADING REPORTS DIRECTLY IN YOUR INBOX

As we all know there is an unlimited amount of ways to trade the financial markets. Each person sees the market in a different way, has different skill sets, trading experience and risk tolerance levels. While some individuals create and use complete systems to make money there are some very basic trading strategies which still work well and require nothing more than basic charting, patients and a little money management.

Let me explain:

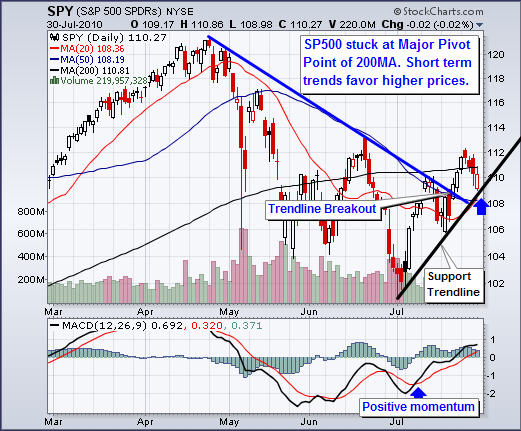
SPY – SP500 Index Trading Fund

You can clearly see the longer term trend which is down (blue trendine). But from simply drawing a couple trendlines and looking at the MACD (momentum) indicator you can see there is a possible trend reversal taking place. So far the SPY has broken out of its down trendline with a 4 day pop, and it’s now pulled back down to test support. A close below the trend line or the 50MA would be the exit points if the market did start to go south.

The SP500 is still stuck under major resistance, its 200 day moving average. But is trading above key support levels (20MA, 50MA and Trendline). I can feel the tension in the market between traders and we are about to see a big move once a breakout to the upside or down side is established. At this time its best to be in cash or have a small position with a protective stop in place. Once a trend starts there should be some low risk entry points along the way. If we see a strong reversal to the upside On Monday or Tuesday I would expect big buyers would step in to catch this new trend up.

GLD – Gold ETF Trading Fund

Looking at the price of gold we can see the trend is still down along with the momentum. A breakout would be the first step towards a possible entry point but I prefer to wait for a pullback after the breakout has taken place. Once we get a test of support I look to enter a position once there is a strong reversal candle to the upside. From there I draw a new support trend line from the previous low and connect it to the new pivot low (bottom of reversal candle). That becomes my new protective stop.

Gold still has some work to do before I would even be interested in taking a long position for a swing trade. But on a short term time frame (intraday charts) gold looks to be forming a low risk setup which I hope unfolds for my subscribers this week.

USO – Crude Oil Trading Fund

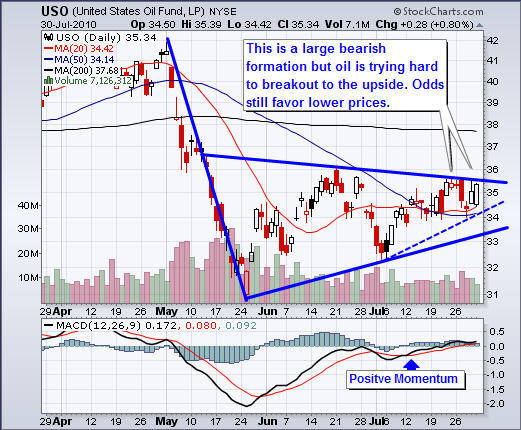
Oil has been trading in a large bearish pennant for the past 2 months and it is nearing the apex of this pattern. The longer term picture of oil is bearish but the most recent dotted trend line and the 20/50MA crossover is signaling some strength. Also the momentum for oil is positive and that helps support the price also. Again if this was to breakout to the upside I would wait for a low volume pullback to test the breakout level, then enter on a reversal back up.

Oil is one of the more challenging commodities to trade because it is affected by the US Dollar, Political Events, and Weather. In short, even if you had the analysis and timing correct there are other factors which move the price of oil on a regular basis that could quickly turn the trade against you. That being said, keep trades small when trading oil.

How to Trade Trend Line Breakouts Low Risk Trading Setups:
In short, trading can be complex, simple or somewhere in between. You can spend 14 hours or 20 minutes a day analyzing it depending on what investments you trade, whether you’re trading full time or just checking up on longer term investments.

This analysis and basic strategy shown above can be profitable if followed correctly and works for stocks, commodities and indexes. It’s just to show how simple one can swing trade the market using very basic analysis. Personally I use a much more complex strategy incorporating 15+ other data points which allows for precise entry and exit points.

If you would like to get my Low Risk Trading Newsletter visit my services at:
www.TheGoldAndOilGuy.com – ETF Trading – Index, Sectors & Commodities
www.FuturesTradingSignals.com – Futures & ETF Trading – Index & Commodities

Chris Vermeulen

.

GET MY FREE WEEKLY TRADING REPORTS DELIVERED IN YOUR INBOX

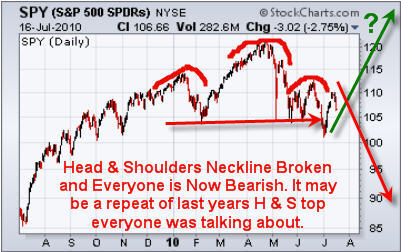
Most traders I have been talking with are feeling the same thing. Something big is brewing for the equities market but most do not want to get heavily involved until there is a clear direction. The broad market has been consolidating for almost 3 months and it’s important to remember that the larger the consolidation the bigger the move.

Also the biggest and best moves come from failed patterns. So is the big head & shoulders pattern on the SP500 which everyone is yelling about (the sky is falling) really going to happen or is this the BIG fake out? Only time will tell, either way no matter which way it goes I will be sure to catch some of it.

Below area few charts pointing out patterns and trends which could provide some opportunity in the coming days or weeks.

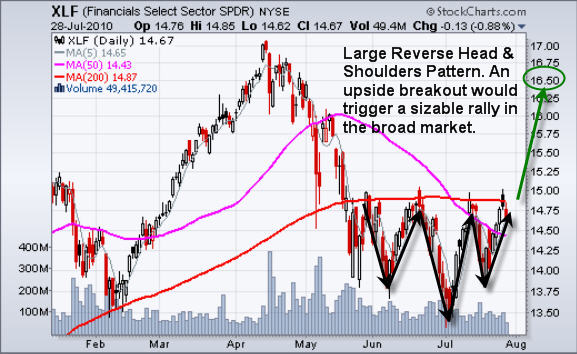
XLF – Financial Sector ETF
Financials play a large roll in moving the major indexes so if this reverse head and shoulders patter breaks out to the upside then the indexes should rally and XLF etf could reach its measured move of $16.50.

USO – Crude Oil Fund
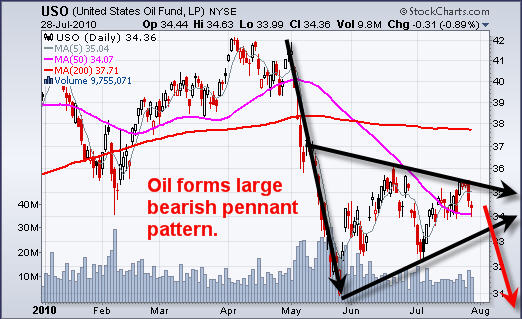
Crude oil almost looked like it was going to breakout and mover higher this week but sellers jumped in sending it lower once again. The daily chart shows a large bearish pennant which is known as a continuation pattern. So it looks as though we should see lower prices for oil.

GLD – Gold Bullion ETF
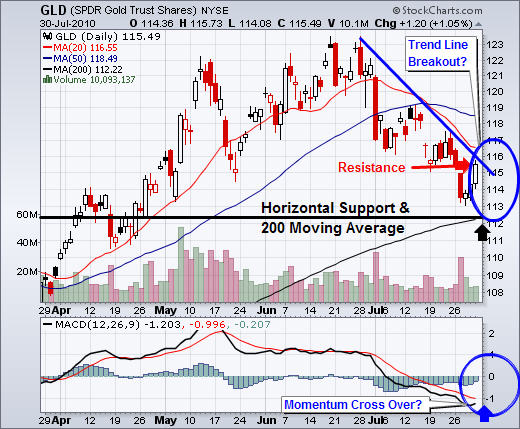
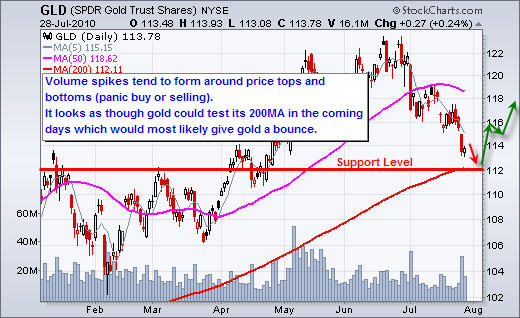
Gold has been sliding lower for several weeks now and it looks to be showing selling exhaustion. The 5th wave down with the volume spike indicates panic selling as investors cannot hold onto those positions any longer and exit. This is a bullish sign for gold. Also we are seeing gold fall deep into a support level along with the 200 day moving average.

Mid-Week Financial, Oil and Gold Trading Conclusion:
In short, the equities market is in limbo until a clear trend is established. If the financial sector breaks out to the upside then we should see a sizable rally. As for oil it looks to be trading in near the middle of its range but is still in a down trend overall. Gold is almost looking ready for a bounce but I am waiting for more confirmation before jumping on the wagon.

Receive my Trading Analysis and ETF Alerts try my subscription service which has a 30 day money back guarantee: http://www.thegoldandoilguy.com/specialoffer/signup.html

Chris Vermeulen

Get My Free Trading Charts Newsletter

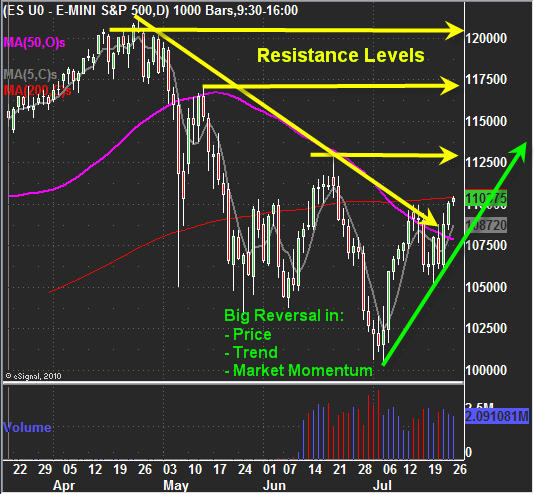
The second half of last week we saw some strong price action in the equities market. The SP500 broke through the 5 and 50 day moving averages closing the week just under key resistance levels. The SP500 futures will find resistance at the June high $1099.25, $1100 which is whole number then at $1103 which is the 200 day moving average. Each of these are clumped together making it really just one solid area which sellers will be waiting to short the market.

The market momentum and internals are looking strong for the equities market overall. With last weeks strong close we have seeing the percentage of stocks closing above their 50 and 200 day moving averages surge from 40% to 68% from the previous week. Stocks closing above their 20 day moving average jumped from 40% to 82% from the previous week. Seeing this type of shift in the market Momentum is generally a bullish indicator.

From a quick glance at the internals it looks as though Monday will trade flat/negative for the session. Reason being is that the NYSE Advance/Decline line is telling us the market is overbought when looking at a short term time frame. I would expect some selling Monday or possibly we get a gap up, then a sell off early in the session while the market digests last weeks strong closing.

Gold

Bullion has been giving mixed signals for while now. It looks like there has been a possible ABC retace, but on the other hand it looks to be forming a stair step pattern lower (series of bear flags). Until we get something more concrete from the charts lets just keep our eye on it for now.

Crude Oil

The past month we have seen oil form a bear flag which generally leads to lower prices. That said oil continues to grind its way higher closing at a key resistance level. This could be a possible double top before heading lower or we could get a breakout and rally this week. I know that does not sound helpful but remember oil is very sensitive to weather (hurricanes), US Dollar and geopolitical events making it much more unpredictable than one may think. That said I am not trading it right now.

Pre-Week Trading Warm Up:

I feel the equities market has some strength behind it. But we must see the SP500 futures contract close strongly above the $1103 area. With the market overbought and trading at resistance I am favoring some early weakness Monday

As for the gold and oil, I am just going to keep an eye on them. I’m just not feeling/seeing the patterns which I find tradable at the moment for a low risk setup.

Quick Trading Tip: I try to always analyze and trade the market the way which has always worked for me. Keeping my emotions in control and filtering out as much news, events and opinions as possible so I can think clearly while I focus on my low risk setups. The past couple months have had big news and events unfolding making it harder for traders to stay focused. It is crucial for traders to step back and clear their heads from all the news, hype and opinions shared across all the mediums and just look at a simple chart analyzing the price, volume and trend.

If you would like to receive my Free Weekly Trading Reports or my ETF Trade Alerts be sure to visit my website at: www.GoldAndOilGuy.com

Chris Vermeulen

Be Sure To Join My FREE Weekly Trading Reports:

The market continues to become quicker and fiercer as it move up and down 2+% on a regular basis This week we have seen some wild price swings due to earnings, events and the Fed’s which just makes trading that much more intense.

I have pointed out yesterday that this market only gives you a brief moment to take profits before it starts going wild shaking traders out of positions. This increased volatility is caused from a couple of things:

1. Traders/Investors know the financial system is still riddled with unethical practices/manipulation. This causes everyone to be extra jumpy/emotional and causes volume surges in the market as the herd starts to get greedy or fearful.
2. Volume overall on the buying side of things just isn’t there… I see some nice waves of buying but it doesn’t move the market up much… then it only takes a small wave of sellers for the market to drop… Investors are just scared to buy stocks and that is not a good thing…

I keep a close eye on the buying and selling volume for the NYSE as it tends to help pin tops and bottom within a 2-3 day period. In short when we get panic buying meaning 75%+ of volume is from buyers then I know the general public is jumping into the market buying everything up and that’s when the smart money starts to scale out of their position selling to these retail investors. These retail investors are buying on news and excitement much like what we are seeing now with earnings season. Stocks have run up for 5-10 days, as the smart money buys in on anticipation of good news, then the earnings are released which are better than expected and the stocks pop and drop. Well the pop higher on BIG volume are all the retail investors buying and are generally the last ones in. The smart money is quickly selling into this buying surge so they end up getting out at high prices.

My point here is that in general I see 4-6 of these panic buying or selling days a year which I find are tradable. The crazy part is that we have seen 11 of these panic days (both buying and selling) in just 8 weeks… We are seeing more selling than we did at the bottom in 2009! Something big is about to happen and I want to make sure we get a price of it once the moves starts.

Anyways, below is a chart of the SP500 showing how its trading under some key resistance levels. Today the market gapped up testing the 50 day moving average and above the 5 day moving average then sold down very strongly during Ben Bernanke’s speech. This is not a good sign for the overall health of the market.

On the commodities side of things we are not seeing much happening with gold or oil at the moment. Gold is still in a short term down. And gold took an $8 drop today when Ben Bernanke said inflation would remain low for an extended period of time.

As for crude oil, yesterday afternoon I pointed out to members that oil had a big run up on virtually no volume Tuesday and it would most likely give back those gains today. We saw this today with oil dropping from $78 down to 76.50 per barrel. Overall Oil looks like it wants to go higher but has some work to do before that can happen.

Mid-Week Trading Conclusion:
In short, the market remains choppy and we are getting more than normal news/events which are moving the market and this is causing extra noise and volatility for traders. Cash is king during volatile times and if you are doing some trades be sure to keep the positions small for another month or so.

If you would like to receive my detailed trading analysis and alerts be sure to checkout my websites at www.TheGoldAndOilGuy.com or www.FuturesTradingSignals.com

Chris Vermeulen

Get My Free Weekly Trading Reports!

It was an interesting options expiration week for equities that’s for sure. We saw some very choppy price action with large waves of buying and selling as the bulls and bears fought for control.

Both Gold and Oil closed lower for the week which is not a good sign considering the US Dollar dropped like a rock along with them.

Below are a few of my charts

GLD – Gold ETF Price Action

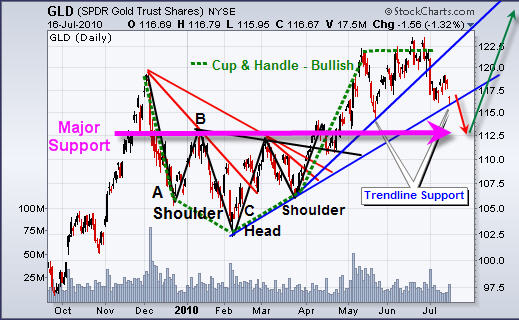
Gold continues to pull back from the June highs. It looks as though it could form an ABC retrace pattern if the July 7th low is broken. If $1085 is broken we should see gold drop to $1165-75 level. On the GLD etf that would be around the $112.50 – $113.50 level. That should shake out the majority of weak positions and start to rally towards the $1250/60 level.

Crude Oil – USO Oil Fund

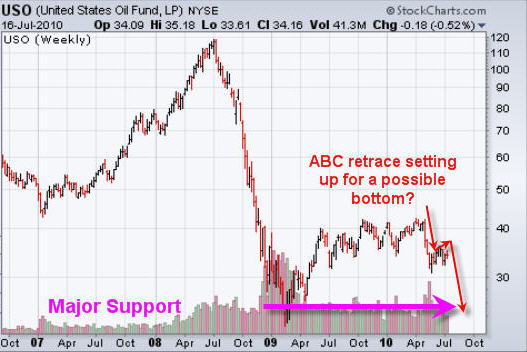
This is a weekly chart of oil which clearly shows how selling volume has risen and the trend since 2009 has gone up, sideways and is now heading back down. The bear flag forming on this weekly chart looks about ready for another leg down. Once that occurs we could see a test of the 2009 lows.

Using some inter-market analysis crude oil tends to move in the opposite direction of the US Dollar. From a quick glance at the dollar chart is looks about ready to bounce which will send oil sharply lower. It will be interesting to see how this unfolds over the next 2-3 weeks.

SP500 – SPY Index Fund

Friday we saw some the SP500 sell off on heavy volume after testing its 50 and 200 day moving averages which are key levels for trading and investors to take profits or add to their short positions in hope for another multi day sell off.

That being said, there is still a good change of higher prices and for all we know this could be the start of another multi month rally. While I am more inclined for us to play the down side this week I will not have a problem taking a long position if we start to see the market internals and breadth improve alone with bullish price action. I monitor the 60, 30 and 10 minute charts which allow me to get a feel for the overall short term trend and strength.

Weekend Trading Conclusion:

Overall it looks like we could have a couple more days of weakness for stocks and commodities. The US Dollar is very much oversold and as of this writing it looks like its starting a small bounce. A rising dollar tends to put downward pressure on gold and oil along with the large multi national companies.

Equities sold off Friday with a slow grind down from 9:30 -4pm never putting in any type of bounce when looking at the 60 minute chart. The SP500 and other indexes are way over sold after Friday and I am expecting some follow through Monday as investors review the charts over the weekend and see what happened on Friday. That should cause another wave of selling in the morning as traders panic out of positions.

It’s going to be an exciting week for sure!

If you would like to receive my trading analysis and trade alerts be sure to checkout my services at: www.TheGoldAndOilGuy.com & www.FuturesTradingSignals.com

Chris Vermeulen

It’s been another strong week for equities but are stocks and commodities about to get hit with some selling pressure?

I have put together a short video coving all of these investments but here is my Coles Note Version:

US Dollar:
The Dollar is way oversold and looking ready for a multi day bounce. This will put pressure stocks and commodities.

Crude Oil:
Oil is trading at resistance and with the Fed minutes reported today saying they are some what concerned about the economy still this pulled oil down late in the day. Also if the US Dollar bounces it will add downward pressure to oil.

Gold:
It’s a tough call on gold because it could go either way here… It could be seen as a safe haven in stocks fall in the coming days, or if the US Dollar moves up then it will put more downward pressure to gold. I feel money can be made a breakout to the up side or the down side. Explained in the video.

SP500:
Stocks are overbought across the board making things look toppy. We are seeing good earnings from Alcoa, CSX and Intel but the stocks are selling off on the good news which is a bearish sign for the equities market overall. The SP500 gapped up on Tuesday and has been trading sideways in a tight sideways channel building power for the next breakout. Tension is building and we should see a breakout from this channel tomorrow (Thursday). The Odds are pointing to lower prices but only time will tell.

TECHNICAL MARKET VIDEO:

Cant See the Video? Click Here: http://www.thegoldandoilguy.com/july-14th-technical-market-analysis/

Get my Trading Analysis and Alerts:
www.TheGoldAndOilGuy.com
www.FuturesTradingSignals.com

Chris Vermeulen

Last week we saw stocks move sharply higher as traders started to cover their short position which added fuel to an already oversold market ready to bounce. Overall volume was not that strong on the move up which is a bearish sign. On Friday afternoon we saw the SP500 continue to move into the $1075 resistance level on very light volume. This indicates to me that buyers are not willing to pay these higher prices because the market has moved up so quickly and the fact that it’s trading at a resistance level.

I feel the market will gap higher on Monday just like we say on June 20/21 deep into a resistance level and the big money will short the pop sending it sharply lower.

Gold looks to be shifting its momentum from a down trend to an uptrend. It’s forming a reverse head & shoulders pattern which is shown in the video posted below.

Here is My Technical Trading Report Video Covering:

– Gold
– US Dollar
– SP500
– Market Internals
– On Balance Volume

iPhone/iPad Video Format: Click Here

Weekend Conclusion:

In short is looks as thought the market is at a critical pivot point. We could see prices stall out here and continue the down trend or see strong buying step in sending prices higher in the equities market. We need to wait and see what type of price action unfolds in the coming days.

If you would like to receive my trading alerts and education checkout my service at www.FuturesTradingSignals.com or my swing trading service at www.TheGoldAndOilGuy.com

Chris Vermeulen

Get My Free Weekly Update Delivered to Your Inbox!

July 7th, 2010
It’s been a short but exciting week so far. Investors and traders are have been scratching their heads the past few days as stocks continued to bounce around giving mixed signals. But today was a clear day of short covering from this much oversold market condition.

Below are a few charts showing what I’m currently thinking will unfold in the near future.

Gold Futures Trading – 2 Hour Chart

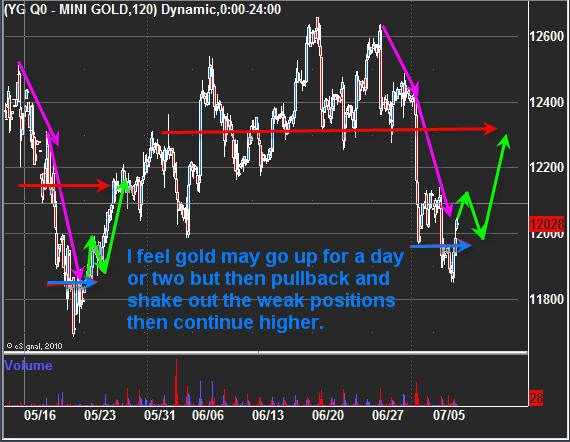
In the past couple weeks we sold our position in gold at $1255-60 area in anticipation for this sharp drop. The market was kind enough to show us though its price and volume action that a nasty drop was just around the corner. Currently we are in cash waiting for the down trend momentum to stall and reverse before taking another long position in gold. I feel it could still drop one more time, but the chart is giving mixed signals when reviewing the short term charts.

Crude Oil Futures – Daily Trading Chart

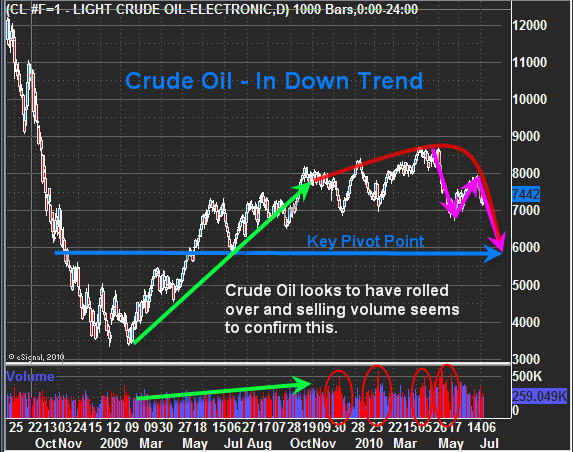
Crude has seen a shift in the trend over the past 2-3 months. Selling volume over took the buyers and are now pulling prices down into bear flag pattern which means lower prices still.

SP500 Futures – 60 Minute Trading Chart

SP500 and other major indexes have been selling down the past couple weeks. Tuesday we saw the market gap up very big then sell off. But that surge higher was an early warning sign that the selling momentum was slowing for the time being.

1075 on the SP500 is a key resistance level and a point which many traders will be taking profits and trying to short the market. That will create a lot of selling pressure at that level and only time will tell if we can clear it.

Mid-Week Commodity and Index Trading Conclusion:

It looks as though we are getting the over due bounce in the stock market everyone has been anticipating. The large rally today (Wednesday) has covered most of the ground as it has moved up over 3% today. Overhead resistance looks to be only 2% away before sellers step back in and try to pull the market back down.

If the market goes up for another couple days then gold should have a small pullback to test support. When the equities market starts to drop again money should flow back into gold and send it higher as the safe haven of choice.

Crude oil broke down late last week and this week it bounced back up to retest the breakdown level. This is common and once complete oil should continue to drop.

The market is still in a strong down trend on an intermediate basis so be sure to lock in profits once your investments reach key resistance levels. If you don’t the market has a way of taking back those gains very quickly in the current market condition.

To get my detailed trading signals signup to my trading services:
ETF & Futures Swing Tradingwww.TheGoldAndOilGuy.com
ETF & Futures Active Trading & Educationwww.FuturesTradingSignals.com

Chris Vermeulen

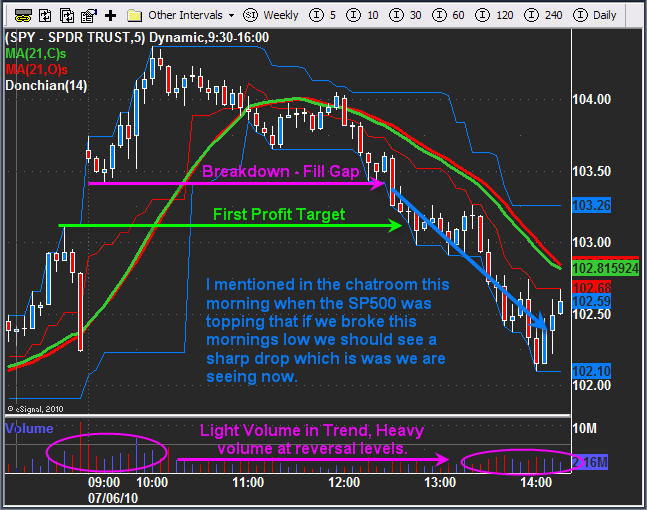
Its been an exciting day with the SP500 breaking below this mornings low using the regular trading hours 9:30-4 for this analysis. As i mentioned before I don’t trade during the afternoon. Most large moves tend to happen between 9:35am – 11:30am, and 3:30-4pm. I did mention at 11:28am this morning in the chatroom that if we saw this mornings low broken then we should see a short drop. Below is a chart of how it has unfolded so far today.

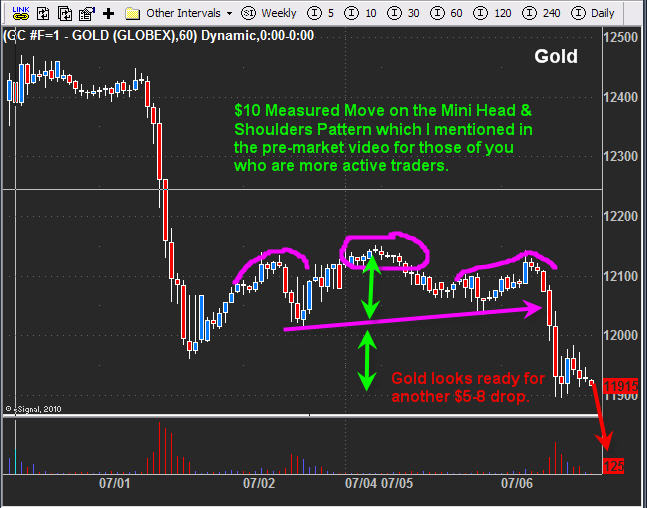
Also in this mornings pre-market video I pointed out how gold looked ready to drop again with the mini head & shoulders patterns and bearish volume levels. We saw a nice drop this morning which is posted in this chart below.

Overall we are waiting for a larger setup using the 60 minute chart and daily charts for some sizable setups. As most of you know I do point out trading opportunities in the chatroomn for those of you who are more active with some experience under your belt. But to be honest these quick intraday moves are just to fast for me to type up an alert, send it out, then have everyone read it and take action if the setup occurs. Those of you who do not feel experienced enough for these quick day trades can just stick with my momentum trades which are based on the 60 minute chart and the swing trades as they come available.

That being said I am looking into some live webinar services so you can view my screen and hear me talk during the morning or afternoon hours depending on the market conditions. I’m not saying this is going to be the way of things going forward but I want to test it out because I do think it will be much better than just a chatroom and we can do more trades over the long run as well.

Chris Vermeulen
www.FuturesTradingSignals.com