If you held LinkedIn, in your portfolio, you have lost more than 43% of your investment within a single day, and it is most likely to decline even further. In the current situation of flux, it is difficult to find an asset class where you can safely deposit your money. The stock market is dropping and has entered a bear market, the crude oil market continues to hit new yearly lows while, base metals have no buyers, making it difficult to find an asset class where one can invest. But in the sea of red, the oasis will be Gold.


However, most of the experts in the media, as well as financial advisors, have advised you against buying the yellow metal. They claim it does not pay you a dividend yield, and that is just an asset whose value is determined by the market place. This may be true, but there are times when you want to safeguard your capital.


History of Gold:

Though Gold coins have been used since the 8th century, in China, accounts of their usage can be found throughout India’s history, which is many centuries older. Gold has been in existence for millenniums; it is not new. It is believed that 90%-95% of all the Gold that was ever mined, still exists in one form or another. Despite increased mining operations, Gold continues to generates interest amongst its’ buyers.


The Gold Standard:

The world was officially in a Gold standard from 1881-1913. This was one of the best periods of stability Globally and would have continued to do so in much the same way had it not been for WWI. Even during the Bretton Wood’s System, the world witnessed a fast-paced growth and inflation was contained and under control. With increased central bank interventions, the world is on the cusp of a major global financial crisis.


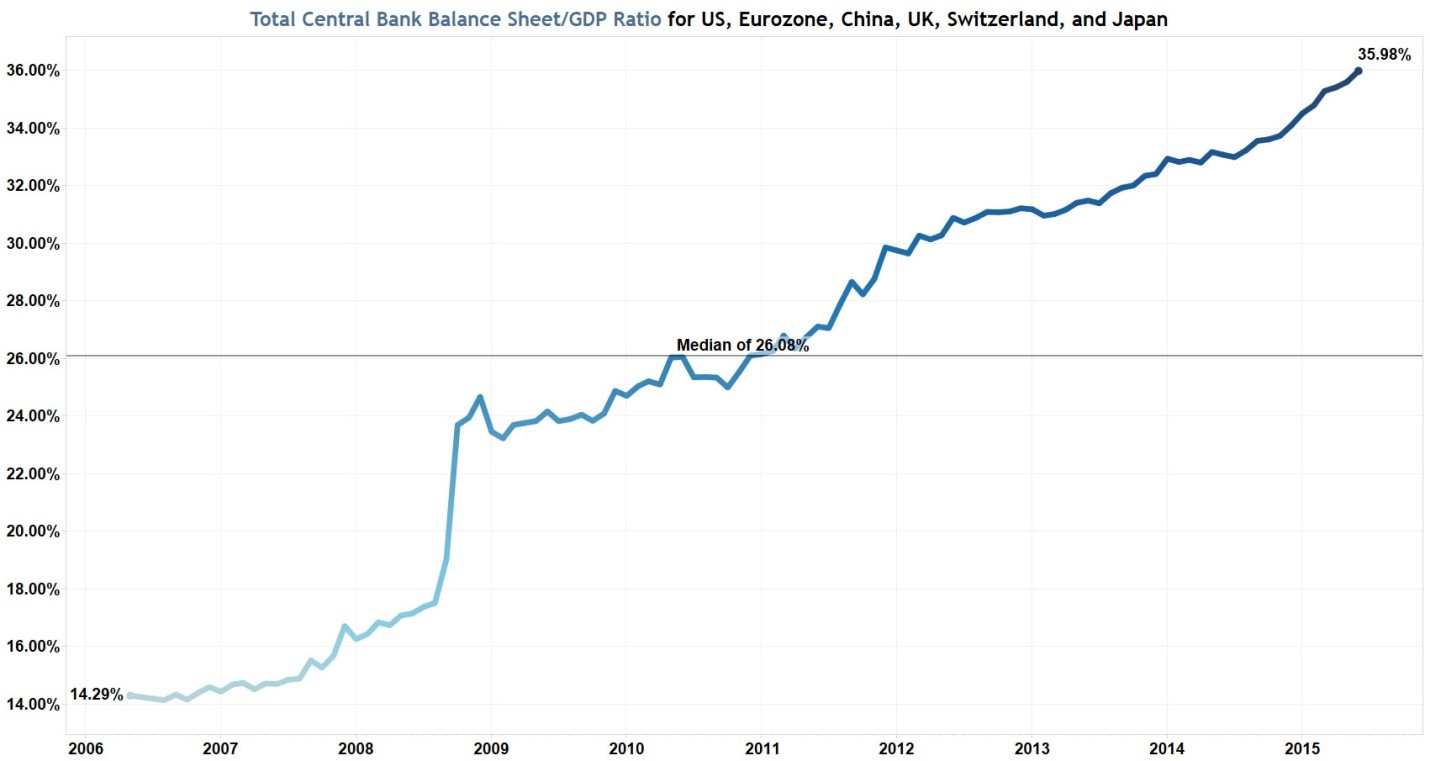
The world is currently witnessing unprecedented Central Bank interventions. The chart below displays a graph of the rise in the Central Banks’ assets to GDP of all of the major economies globally. With yet another fresh round of QE, as announced by Japan and the EU, it appears that there is no end to the “madness”.

gold10


How can we protect ourselves from the impending debacle?

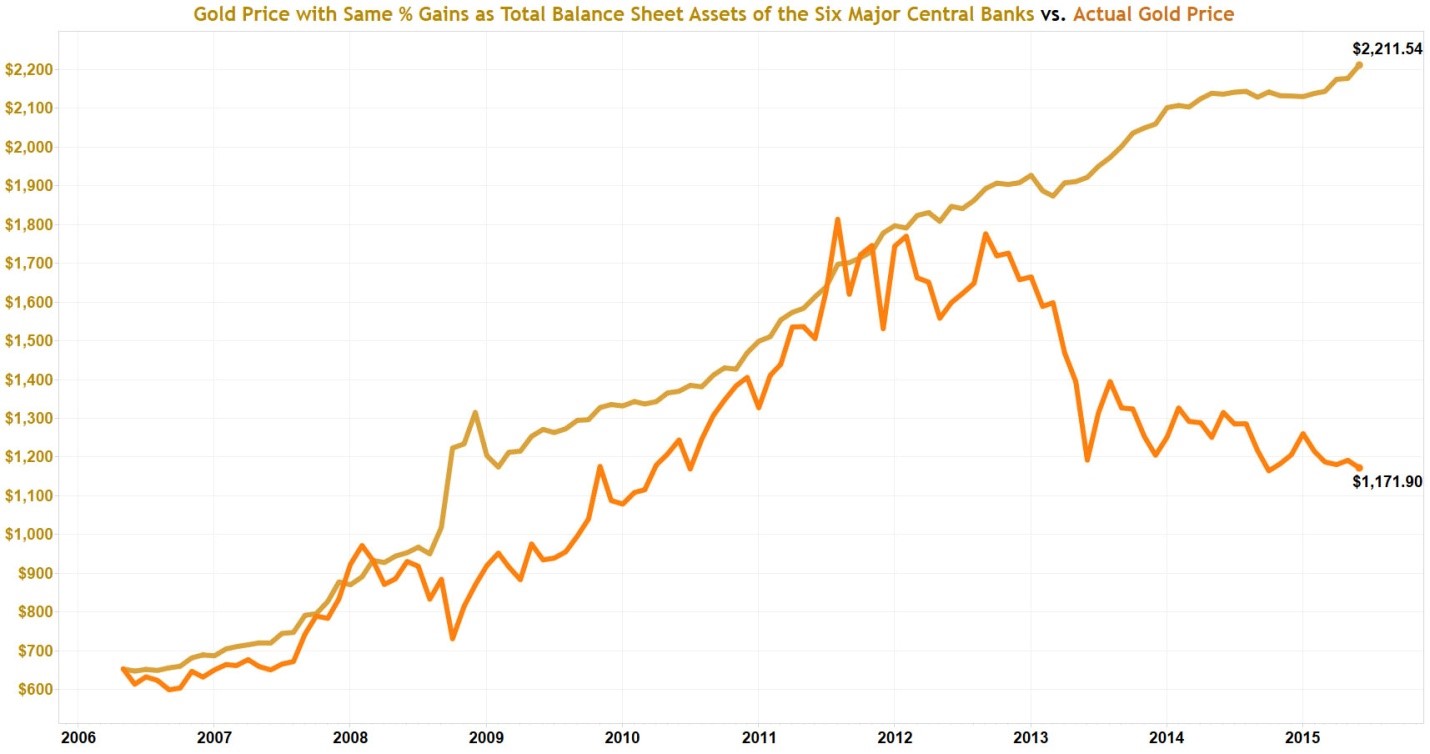
Even if Gold were to experience the same growth as the Central Banks’ assets, it should be trading much higher. The chart below shows the valuation gap. With the world economy on tenterhooks, currency wars between nations are rapidly increasing. We have seen glimpses of such occurrences, when the Swiss Central Bank unpegged the Franc to the Euro, which in turn, led to massive bankruptcies.


With talks of a Brexit and the European Union on a slippery slope, it has all the makings of the next big crisis. The famous commodity Guru, Jim Rogers, often states that ‘The US dollar is a terribly flawed currency’.


gold11


Performance of Gold against the recent fall in equity prices:

History suggests a bullish future for Gold, but how has Gold performed during the current drop in equity prices.?


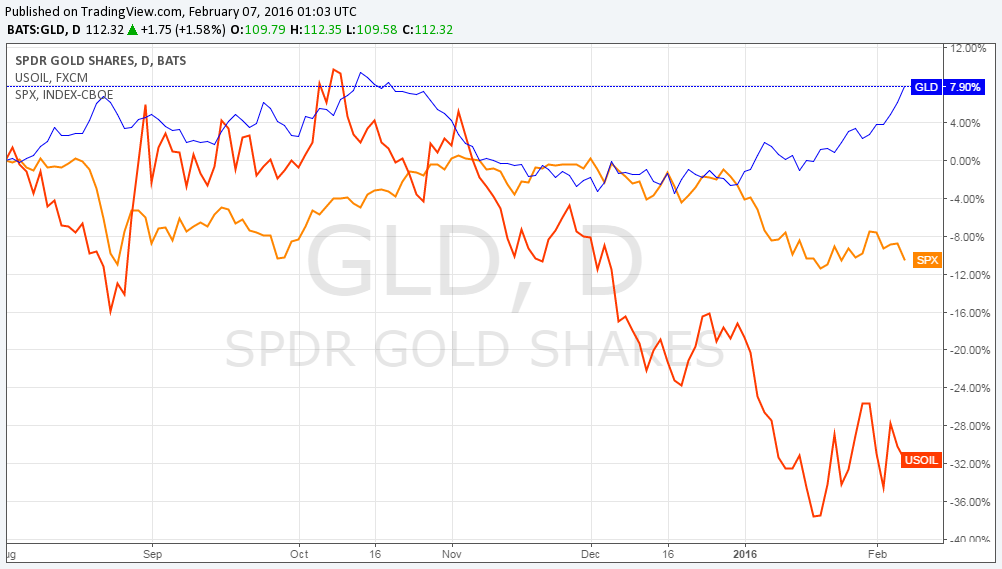
The below chart displays the comparative performance of the three important asset classes:  Gold, SPX and Crude Oil. Gold is an outperformer while the other two are struggling to put in a bottom. Moving forward, with the US equity markets entering into a bear market.  The confirmation of the bear market will be complete once the markets break their recent lows. Gold is the only “financial standard” in which you should invest during the current financial crisis.


Watch this video analysis from Feb 10th that explains where gold is headed in the next few days: https://youtu.be/yWPT_3Huxhk

gold12


Conclusion:

In short, Stanley Druckenmiller, amongst other informed investors, are purchasing Gold. In fact, Druckenmiller sees Gold as a ‘run’. I am not advocating that you should follow them blindly, but the data and the economic conditions suggest that this is the new. In order to benefit the Bull Market in gold.


I will further advise you of the proper timing of the correct entry price. Be sure to join my free newsletter for future updates and trade alerts! In the past two months I have closed 11 trades with 9 of those being winners.


Visit: www.TheGoldAndOilGuy.com


Chris Vermeulen

After a gap in time of almost a decade the FED increased interest rates on December 16th, 2015,. The SPX has a one day bounce from the news on the day of the announcement, then it turned negative and since that time the index plumeded 13%.

The markets, which were rising, due to the low-interest-rate environment, encountered a rude awakening, catching most investors off guard. Was this a surprise reaction from the market? Absolutely not. Just look back in time and compare interest rates and the stock market. When the fed starts to raise rates equities typically top out and fall.

On January 29th, 2016, the Bank of Japan lowered their interest rates into negative territory, which inspired the markets, thus causing them to “rally” by 2.4%.


Why is this important?

I had written in my earlier article of how the FED steps in with a QE, or an interest rate drop whenever there is a significant fall in the SPX.  During their recent policy meeting, they maintained their resolve to raise rates, albeit with caution; however, the market is skeptical, today. The FED is still far from obtaining their inflation objective while the recent GDP numbers came in at a disappointing 0.7%, for the fourth quarter.  Suddenly, the economy does not look to be standing on a strong footing.


What is the mood of the market?

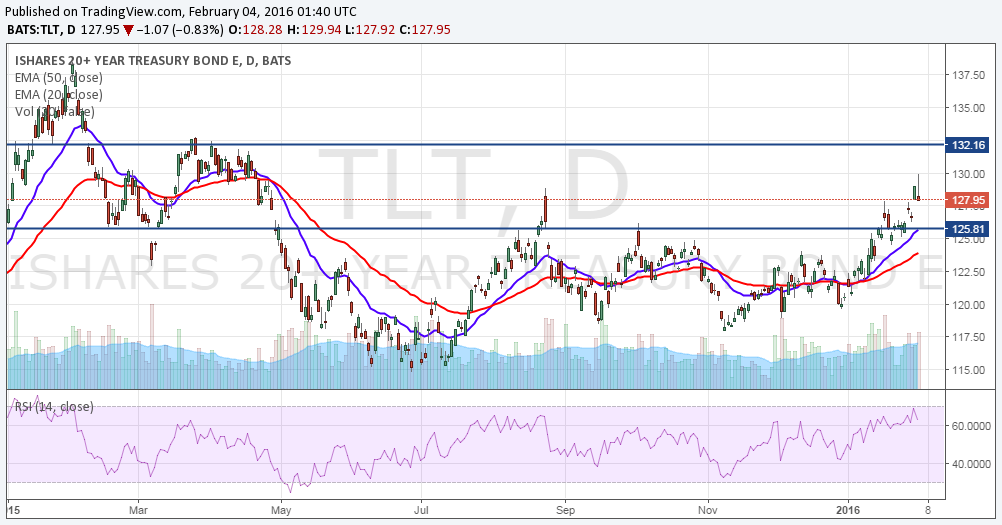
Bonds are the best indicator in which they predict what the FED is likely to do.  Take a look at the chart below, of iShares Barclays 20 Year Treasury Bond Fund ETF (NYSEARCA: TLT) in order to understand the mood of the market participants.

TLT should have been declining, since the FED rate hike was implemented in December. It did begin to decline after the announcement was made but that only lasted a couple days. And with the US markets “tanking”, it has since turned its’ direction around as being a safe haven and presently reflects a fresh breakout (from a 10-month range).

The move has a pattern target of 132.7, which is also a resistance level from an earlier high. This means two things:  1) the equity investors are choosing the safety of the TLT rather than “buying the dip”, and 2) the market participants do not believe that the FED will raise interest rates, anytime soon.

There is a cool new site that provides Free Stock Ratings if you want more ideas.

tlt

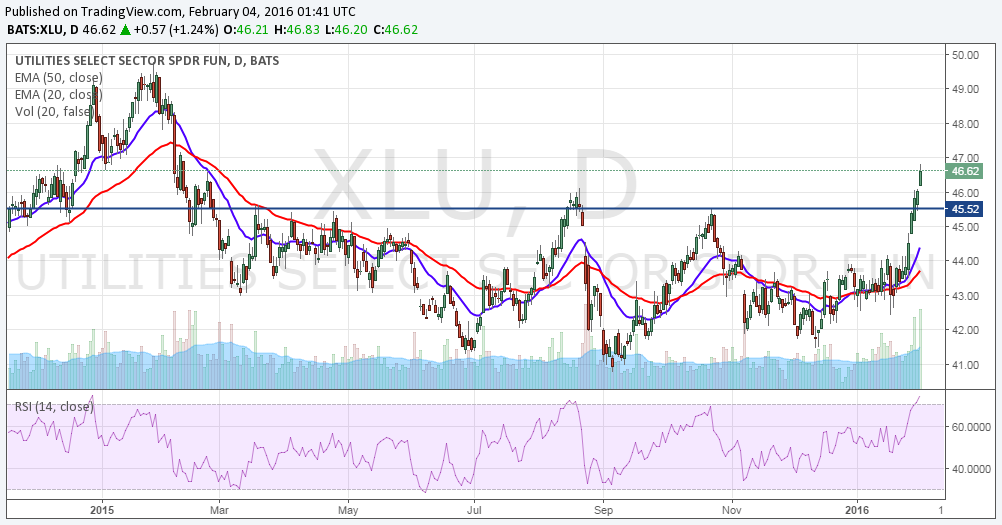
The Utilities Select Sector SPDR (NYSEARCA: XLU) is also moving in the opposite direction towards a tightening interest rate environment.

The utility sector is a defensive sector which is popular among investors for its dividend yield. When interest rates rise, investors shift to the safety of the banks in order to earn a handsome return.  However, despite an increase by the FED, the utility sector has also broken out of a year long consolidation.  The chart pattern targets suggest a move towards 49.5. This suggests that traders are flocking to the defensive and are ignoring the commentary of the FED who are promising high-interest rates, in the future. They do not believe interest rates will rise to make the yield from the XLU less attractive.

xlu

What do these two charts indicate?

The two charts indicate that the market believes the FED will have to quickly reverse the direction of interest rates. They may need a sharper decline, in the markets, in order to reverse; however, the market believes that they are not only going to reverse but will also come out with a QE4 in order to appease the markets.


Will QE always work?

No, it can never ALWAYS work.  The market participants are already questioning the effects of QE and soon, there will come a point when the market will stop reacting to QEs. This may possibly happen in 2016 when the markets enter a freefall and stop responding to the FED actions. The market will correct the excesses of the past few years with a sharp selloff.


Conclusion:

The market is indicating the forthcoming FED actions. It does not believe that the FED will be able to stick to their rate tightening cycle. Traders must be prepared to face the forthcoming slide in the US stock market. There will be only a handful of asset classes which will put up a brave front. Timing, as always, is the key.

Crisis always brings opportunities for those who can see the obvious realities. I am very excited about what’s starting to unfold. You will be presented with these opportunities to make more profits in the next 3 years than you accrued in the previous 9 years.

Watch My Video About What Is About To Happen Next: www.TheGoldAndOilGuy.com

Chris Vermeulen
A preview of this weekend’s show The Gold and Oil Guy, Chris Vermeulen provides his outlook on gold. For the full interview on the weekend show we also cover the movements in the oil price.

LISTEN NOW: http://www.kereport.com/2016/02/04/gold-promising-expect-straight-run/

Are you getting excited to buy oil stocks? you may want to think twice because the bottom may be in for oil but that is only the beginning of the bloodbath that is in-store…

A “rally” attempt is underway. Stocks are continuing to rebound and all is well with the World?  Or is it?  With each passing day, the United States plummets deeper and deeper into a “black hole” of debt, of which it will be almost impossible to repay. At the time, of this writing the national debt is $18,939,663,109,937!

To put this into perspective, the national debt is so bad that if every citizen (including children) were to help pay it off, each one of us would have to contribute $58,652.00.

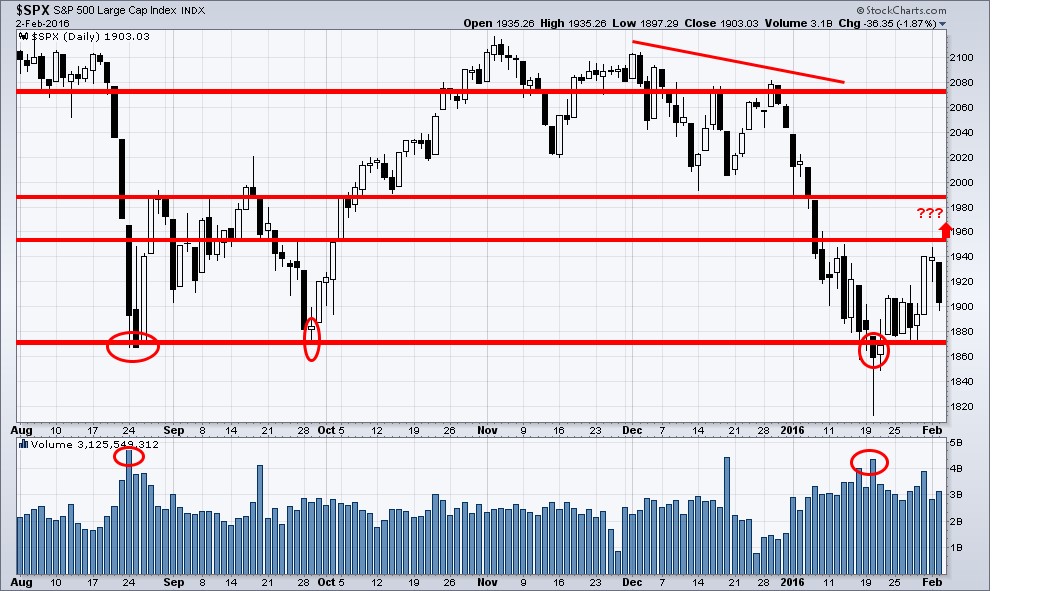
In the last couple of weeks, I have informed you of this “rebound” in the US Markets.  Yesterday, February 2nd, 2016, a sharp fall in the markets was recorded.

Major support levels have held, perhaps slightly bent last month, but they did not break.  Major support level of the SPX is 1880.  If this support is breached, it may drop to 1861 before it rebounds. I do not see the SPX sustaining below 1880.

Markets are once again expected to bounce back.

CHART1FEB32016

I still have a bullish bias for the market, in fact if my analysis is correct it could last until March 24th.

But if we do get more downside from this current level it would create another wave of “Panic Selling” and we must hold above the low of January 20th, 2016 or it may be the start of the next bear market for large-cap stocks sooner than later.

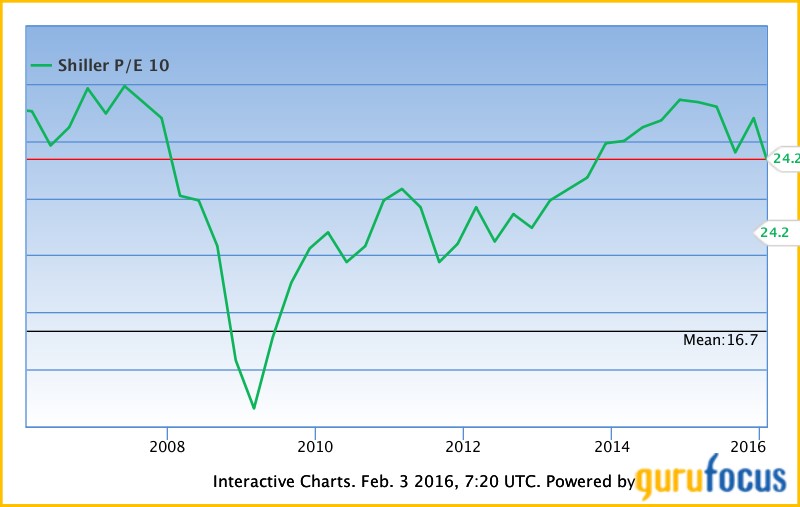
The U.S, Stock Markets have not reacted to any bad news, as of yet. The markets are at their fourth highest level of valuation, in history, according to the Shiller P/E Model.  Professor Robert Shiller, of Yale University, invented the Schiller P/E to measure the markets’ valuation. The Schiller P/E is a more reasonable market valuation indicator than the P/E ratio, because it eliminates fluctuations of the ratio, caused by the variation of profit margins, during business cycles.  There are only three other periods, in time, that these ratios occurred (1929, 2000, 2007) in with we measured similar readings when the market topped or should I say triggered market crashes and multi-year bear markets…

chart2FEB32016


Short term I’m still bullish but the longer-term bias remains firmly BEARISH!

Get My Trading Forecasts and Trade Signals Today.

Make 2016 Winning A Wining Year For Your Trading Account: www.TheGoldAndOilGuy.com

Chris Vermeulen
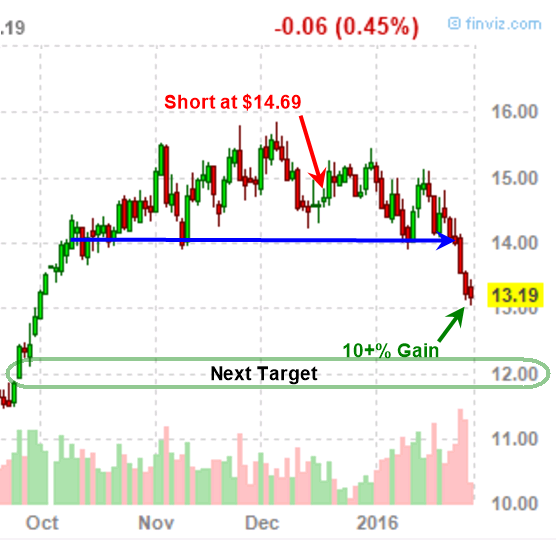
On Wednesday Jan 27th I wrote an article that gave you a picture perfect trade setup. The trade is on sugar or the SGG sugar ETF. As of this writing sugar is now over 10% in our favor from the original entry and trading at short term support.

This is a critical level to lock in partial profits and move your stop in the money for the balance of the trade to be safe. I just want to keep following up with this trade as many followers are in this trade with me.


Daily Chart of Sugar

As you can see in the chart below sugar price formation has turned bearish. With price breaking through support we have seen a beautiful wave of stops being triggered and traders selling their long positions.

There were a few ways to execute this trade. You can do what I do and trade the sugar contract using CFD’s. I do this with AVAFX as I like being able to trade smaller position sizes than that of a full futures contract. Or you can trade the SGG sugar ETF, you will need to have a margin account and be approved for short selling so we profit from price falling.

sugartime


Sugar Trade Idea Conclusion:

In short, sugar was poised for a strong move down as mentioned Jan 17th Read Post. But now is the time to locking in gains and tightening your stop. This was a simple and profitable setup and there is no need to give back these gains.

If you like this type of trading: Slow, Simple, Logical, Tradable Ideas then be sure to watch my video and join me at www.TheGoldAndOilGuy.com

Chris Vermeulen
As traders we are always on the hunt for new trade ideas poised and ready for big moves. And back on Dec 17th 2015 I shared a sweet trade idea publicly on my blog and other financial websites.

If you want so see much more detailed charts and analysis from Dec 17th visit my blog page as it paints a clear picture: http://www.thegoldandoilguy.com/a-sweet-trade-setup-for-the-holiday-season-tis-the-season/

Now, as of Jan 2016 I would like to update on this trade because I feel one of the biggest moves for this trade is going to take place within a few days.


Daily Chart of Sugar

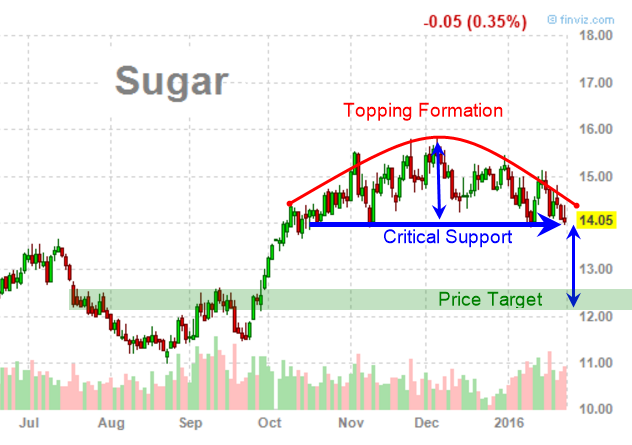
As you can see in the chart below sugar price formation has turned bearish. With price testing support once again we could very well see another bounce before a breakdown. Also, with Valentines just around the corner there could be some speculative buying in sugar in anticipation of an increase in demand.

We have seen some strong rallies the second half of February the last few years but not enough to call it any type of tradable trend if you ask me. And with REAL sugar not being used in anything anymore after being replaced with the fake chemical sweeteners it kind of voids the need for sugar during Valentines Day making it a wash.

There are a few ways to play this. You can do what I do and trade the sugar contract using CFD’s. I do this with AVAFX as I like being able to trade smaller position sizes than that of a full futures contract. Or you can trade the SGG sugar ETF, you will need to have a margin account and be approved for short selling as we want to profit from the falling prices.

sweet-stuff

Trading Conclusion:

In short, sugar looks poised and ready for a breakdown in price to test the $12.50 level over the next month. This is just one of many trades myself and fellow subscribers to my newsletter have taken recently.

Recently we have closed 10 trades and 8 of those were winners and we still have another winning trade open as of this article.

Join Us Today & Make 2016 Winning A Year For Your Trading Account: www.TheGoldAndOilGuy.com

Chris Vermeulen
January was the worst start of a New Year in the history of the US stock market.

Last week was one of the most intriguing weeks in global equity markets ever. As the week got started, there was a powerful sense of foreboding that stock markets around the globe were going to crash. Last Wednesday, January 20, 2016, many global indices were making new yearly lows, some of which had fallen below the 20% mark which have been associated with a new bear market.

Investors have been so scared and they pulled $24 Billion from their equity funds so far this month. They are fleeing into US Government funds shifted $5 Billion so far this year. This was the largest inflow of cash in over one year.

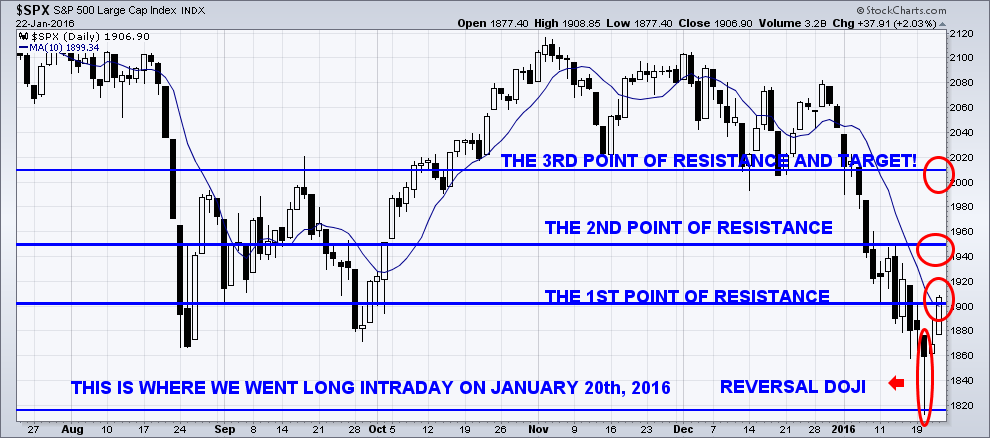
As I mentioned in last week’s article we should see the stock market stage a bounce or rally, and why this was a good price level for it to start. With everyone jumping off the ship bodes well that the market should go against the masses emotional trade. I took a long position on the SPY on Wednesday, January 20th 2016 with subscribers.

spxm

The SPX index took out the low of August 24, 2015, while the DJIA is still 600 points higher. The Dow Jones Industrial Average held above their lows of August 24, 2015 for a clear case of intermarket bullish divergence. This was validated last Friday, January 22, 2016, when each of these indices closed above daily resistance as the DJIA up over 200 points. That is not a bad recovery. However, maybe it was not so great when you consider that it had fallen 2300 points from the 17,750 high of December 29, 2015 just three weeks earlier.

The Asian markets, except the Chinese Shanghai Index, broke below its low of August 26, 2016 last week. It bounced back spuriously by the end of the week. The Hang Seng of Hong Kong fell to 18,534, its lowest level since June 8, 2012. The Japanese Nikkei plummeted to 16,017 on January 21, 2016, its lowest point since October 2014.

Now everyone is wondering if this is the end to the stock market decline? Will stocks resume their bull market? Do not be surprised to see a bounce up first from these levels.

Rallies in bear markets tend to be quite strong, fueled by short covering. Investors will be quite surprised this week as this is only a “counter trend rally” and not a “buy the dip” investment opportunity.

This big problem will become crystal clear to everybody in 2016. Oil is likely to continue to struggle, and China will continue its struggle. There is no money printing, and with a recent interest rate increase the stock market is inevitably going to go down. It appears likely that we will see a point when the Dow Jones is around 15,000, the same place it was at its peak in 2007. The worst has yet to come.

We are still going to have to face all the same problems. The continued debt crisis in Europe is unsolvable and the psychology of the financial community is going to be very bleak heading into 2017.

Debt, which is always the root of financial crises and their resulting economic contractions, didn’t go away. The financial system is even more dysfunctional than the one the U.S. was facing in 2007 to 2008. The Office of the Comptroller of the Currency, as of September 30, 2015 which insures U.S. commercial banks and savings associations, reported that they had exposure to $192.2 trillion notional (face amount) of derivatives. The report goes on to verify that only four banks hold 90.8 percent of all derivatives: Citigroup, JPMorgan Chase, Goldman Sachs and Bank of America.

January’s sharp decline, coupled with all the negative news regarding the stock markets, presents a situation where the market participants should go elsewhere with their investment capital.

Crisis always brings opportunities for those who can see the obvious realities. I am very excited about what’s starting to unfold. You will be presented with these opportunities to make more profits in the next 3 years than you accrued in the previous 9 years.

Watch My Video About What Is About To Happen Next: www.TheGoldAndOilGuy.com

Chris Vermeulen
Here is a 1 hour radio show I was part of this weekend. You will see on the webpage the full “Hour 1” show audio option at the top, if you just want to listen to my section listen to “Segment 8” which is 10 minutes.

http://www.kereport.com/2016/01/23/trends-markets-hour-2/

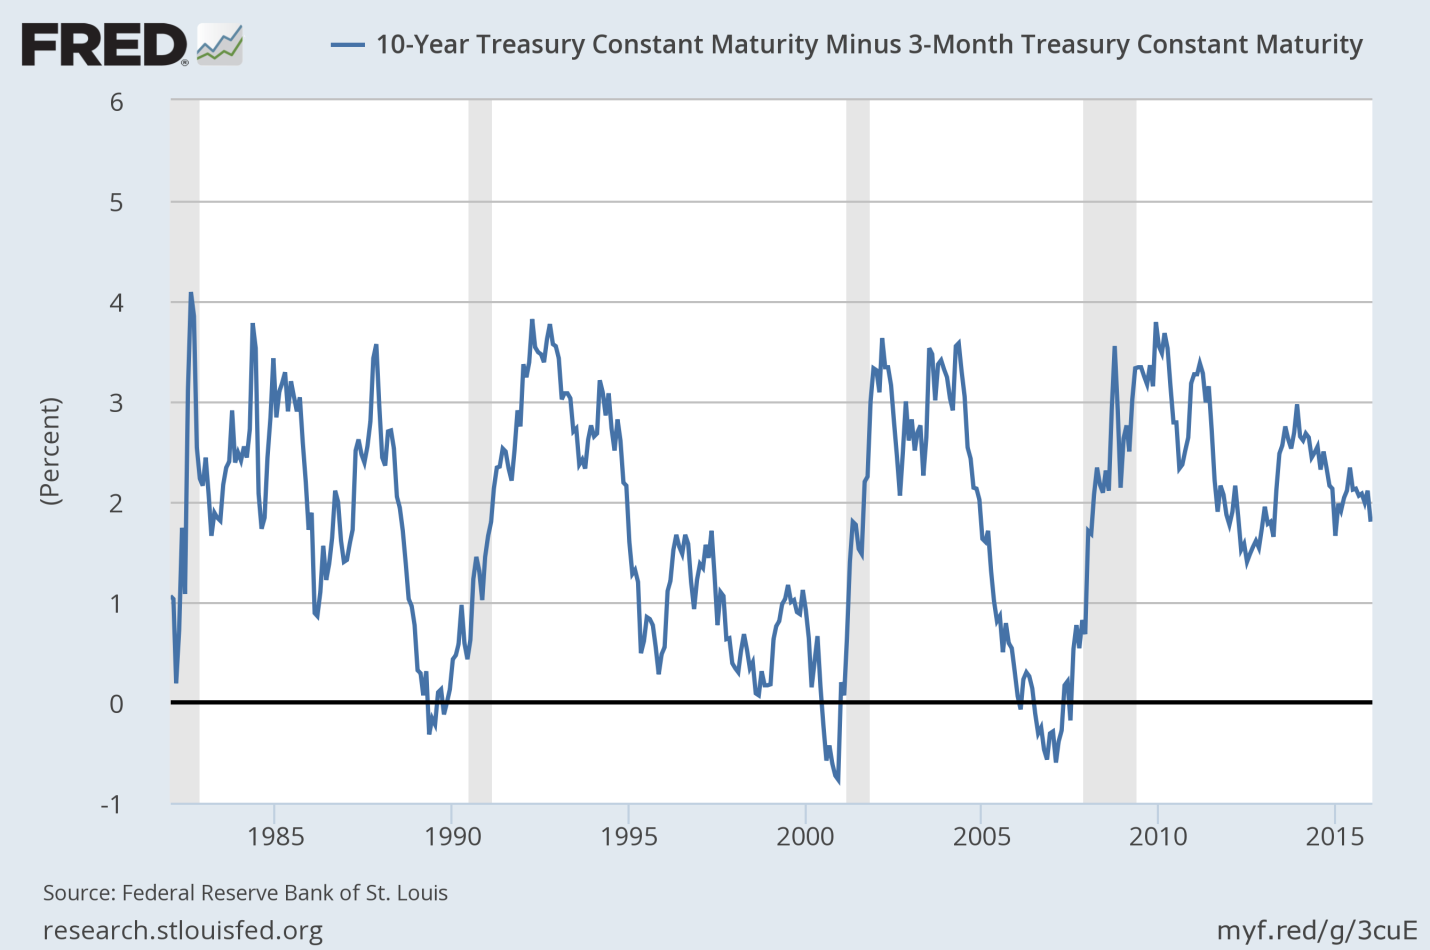
Every crash was preceded with the 10 year minus the 3 month Bond Yields dropping towards the zero line. Although the equity markets have crashed, the bond markets are still not displaying any signs of panic. This tells us the market must continue to fall until the percent return is around the zero mark.

Thinking of this logically, it makes sense. Investors when scare start moving more and more of their capital in to safer investments, like bonds. Eventually there is a change in this perception, which occurs when bonds are not paying anything in return. That is when investors say enough is enough, and start taking risk and start moving back into the stock market.

The indications from the bond markets should be respected, as they are a leading indicator.

The chart below is up to date as of Jan 19th 2016, and it’s clear that the masses (investors) have not yet moved their capital into bonds which drives the percent down.

 bonds5

Leading Indicator Conclusion:

In short, I think we have a long time yet before bonds start rocketing higher and the percent yield drops to near zero. I’m expecting a 6-18 month time frame, but we will know better once the large cap stocks start to breakdown and enter a bear market.

I will be sure to keep you informed with the market tops and bottoms as they unfold. Make sure you join my free email list and don’t miss my next important update!

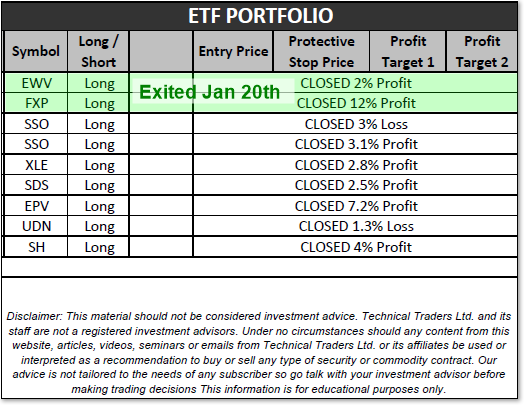
Check out our recent trades below and it does not include another trade we have profits on and are still in.

Updated-Perf

Chris Vermeulen – www.TheGoldAndOilGuy.com