KRE ETF trader tip: Technical Traders goes over KRE ETF, an ETF that allows traders and investors to learn more about the stock market movements of regional banks. Chris details how history is repeating itself by the KRE ETF recently emulating the consolidation pattern from April to November of 2020. Now that the highs of May 2021 have been broken, Chris looks at the weekly chart.

After a brief pullback, a KRE ETF bull flag has formed that is pointing to higher prices. This type of pattern can indicate that when price breaks to the upside, it can happen pretty quickly – over the course of 3 to 4 trading sessions.

Using the 30-minute chart and a conservative Fibanoci extension, Chris highlights where the power of the rally and pause of the KRE ETF can lead. The 100% measured move shows a 5+% move to the upside.

TO LEARN MORE ABOUT KRE ETF – WATCH THE VIDEO

Subscribers: Please let us know what you would like to learn and we will add it to the roster of our weekly Technical Trader Tips!

Non-subscribers: Please enjoy these micro-lessons as a way to further your education and understanding of how a technical trader…well…trades!

TO EXPLORE THE DIFFERENT TRADING STRATEGIES CHRIS OFFERS, PLEASE VISIT US AT THE TECHNICAL TRADERS. YOU’VE GOT MORE TO GAIN THAN TO LOSE WHEN SEEKING INFORMATION!

Disclaimer: None of this material is meant to be construed as investment advice. It is for education and entertainment purposes only. The video is accurate as of the posting date but may not be accurate in the future.

ARKW ETF trader tip – Technical Traders goes over ARKW ETF which is the next generation internet. Chris follows and trades the ARK Invest ETFs with his sector rotation strategy using pure technical analysis, and this is his ARKW Invest ETF Stock review for a new trade idea of which ARK ETF is best.

Subscribers to any service at The Technical Traders: Please let us know via a member ticket what you would like to learn about and we will do our best to make sure this happens.

Non-subscribers: Please enjoy these micro-lessons as a way to further your education and understanding of how a technical trader…well…trades!

BEST ARKW ETF TO BUY NOW – WATCH THE VIDEO

Which ARK exchange-traded fund is best to buy now?

I see ARKW as the best exchange-traded fund to buy for growth.

ARKW ETF Company

In this video, I’m going over the charts as a technical analyst to show you everything you need to know about the ark invest ARKW ETF.

What I like about the overall stock market condition with the small-cap stocks (Momentum and Growth Stocks) breaking to new highs is that is what many of the ARK ETF holdings are. It is always crucial to understand if investors are buying or selling any sector or ETF as you don’t want to invest in ARK funds if the price is still falling.

Follow us and get our ARK Invest ETF Trade alerts.

TO EXPLORE THE DIFFERENT TRADING STRATEGIES CHRIS OFFERS, PLEASE VISIT US AT THE TECHNICAL TRADERS. YOU’VE GOT MORE TO GAIN THAN TO LOSE WHEN SEEKING INFORMATION!

Disclaimer: None of this material is meant to be construed as investment advice. It is for education and entertainment purposes only. The video is accurate as of the posting date but may not be accurate in the future.
If you have been paying close attention to the stock market, market internals/breadth, and bonds for the past three months, you’ve likely come to the same conclusion that I have.

The US stock market is showing signs of severe weakness with the market breadth and leading indicators pointing to a sharp correction for stock prices.

With fewer stocks trading above their 50 and 200 day moving averages each week, while the broad market S&P 500 index continues to rising, this bearish divergence is a red flag for long term investors.

When a handful of large-cap stocks are the only things propelling the stock market higher while the majority of small-cap stocks are falling you should keep new position sizes smaller than normal and start moving your protective stops up to lock in gains/reduce losses in case the market rolls over sooner than later.

Small cap stocks are typically a leading indicator of the broad market. The Russell 2000 index is what investors should keep a close eye on because it’s the index of small-cap stocks. Since March of this year, the Russell 2000 been trading sideways and actually making new lows. This tells us that big-money speculative traders are rotating out of the stock market and into other investments like high dividend paying stocks, blue chips, and likely bonds.

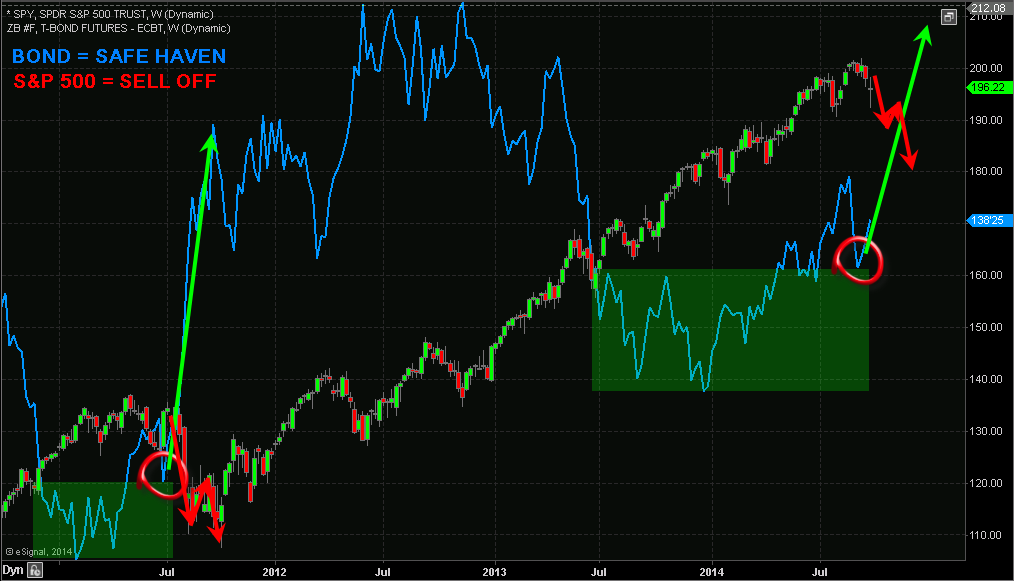
Looking at the chart below I have overlaid the S&P 500 index and the price of bonds. History has a way of repeating itself; although it may never feel the same and the economy may be different, price action of investments have the tendency to repeat.

In 2011 we saw the stock market and bonds form specific patterns. These patterns clearly show that money was rotating out of the stock market and into bonds. During times of uncertainty in the stocks market money has the tendency to move into bonds, as they are known as a safe haven. Bonds tend to reverse before the stock market does, so if you have never tracked the price chart of bonds before, then you should start.

SPXvsBONDS

From late 2013 until now bonds and the stock market have repeated the same price patterns from 2011. If history is going to repeat itself, which the technical and statistical analysis is also favoring, we should see the stock market correct 18% to 30% in the near future. If this happens bonds will rally to new highs.

It’s important to realize the chart above is weekly. Each candle represents five trading days, and four candles represents one month. So while this chart points to an imminent selloff from a visual standpoint, keep in mind this could take 2 to 3 months to unfold or longer. The market always has a way of dragging things out. If the market can’t shake you out, it will wait you out.

So if you are short the market or planning to short the market be very cautious as it could be choppy for the next several weeks and possibly months before price truly breaks down and we see price freefall.

To get my pre-market video analysis each day, and trade alerts visit: www.TheGoldAndOilGuy.com

Chris Vermeulen

The energy sector has surged during the last two months which can be seen by looking at the XLE Energy Select Sector Fund. If crude oil continues to climb to the $112 level, XLE will likely continue to rally for another few days or possibly week as energy stocks are considered a leveraged way to play energy price movements.

Another way to look at this info is through the USO United States Oil Fund. This tracks much closer to the price of oil. The only issue is that many ETFs that “try to track” an underlying commodity is in how the funds are built. They own multiple contracts further into the future which does not exactly provide us with the short term news/event driven price movements in the current front month contract as they should.

What does this mumbo jumbo mean? Well, it means funds like USO and the highly respected UNG, and VIX ETFs… (just joking about the highly respected part), fail to track the underlying commodity or index very well when it comes to short term price movements. This means, you can nail the timing of a trade, and the commodity or index will move in your favor, yet your fund loses money, or goes nowhere…

Let’s Focus on the Technicals Now…

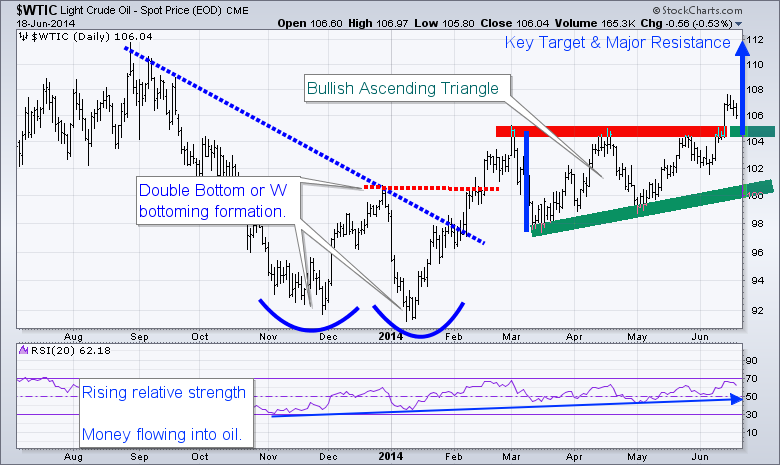
WTI crude oil has formed a bullish ascending triangle pattern from March to May of this year. The breakout to the upside is bullish and should be traded that way until the chart says otherwise. This breakout and first pullback must hold, or I will consider it a failed breakout. So if price dips and closes 2 days below the breakout level, it will be a major negative for oil in my opinion.

The range of the ascending triangle provides us with a measured move to the upside which is $112. Typically the first pullback after a breakout can be bought. The first short term target to scalp some gains would be $109, and at that point moving your stop to breakeven is a wise decision. Trading is all about managing capital and risk, if you don’t, then the market will take advantage of your lack in discipline.

Looking further back on the chart, you can see the double bottom formation also known as a “W” formation. Once the high of the “W” formation is broken the trend should be considered neural or up.

Also note that the RSI (relative strength) has been trending higher for some time now. This means money is rotating into this commodity. This is in line with my interview this week with Kerry Lutz and my recent article talking about the next bull market in commodities and the TSX (Toronto Stock Exchange).

clfutures

WTI Crude Oil Trading Conclusion:

In short, oil has some extra risk around it. The recent move has been partly fueled by news overseas. So at any time oil could get a lift or take a hit by news that hits the wires. I tent to trade news related events with much less capital than I normally do because of this risk.

Happy Trading!

WANT MORE TRADE IDEAS?
GET THEM HERE: WWW.THEGOLDANDOILGUY.COM


Chris Vermeulen
CEO & Founder
AlgoTrades.net
TheGoldAndOilGuy.com


Commodities in general have been under pressure for the last couple years. This can be seen by looking at the GCC Greenhaven Continuous Commodity ETF which holds a basket of resources.

The weekly chart has formed a bullish bottom pattern, and as of last January it looks as though it’s now building a basing pattern. Overall commodities are in the very early stages of a stage 1 basing pattern and it looks as though it will be a few more months before any significant breakout will occur. But there could be some early entry points if you know what to look for…

A few days ago I talked about how commodities tend to perform well near the end of a bull market in the United States stock market. I also pointed out which hot index was going to benefit from this.

Read Commodity Index Report: http://www.gold-eagle.com/article/gold-and-oil-fuel-canadian-stock-market-rally

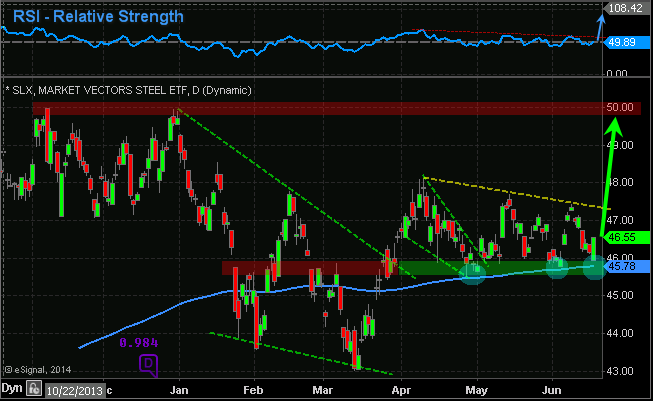
In this article I want to bring your attention to the steel market. Using the SLX Steel ETF you can clearly see the bottoming pattern and basing pattern for this commodity.

Currently steel is underperforming the stock market and is vulnerable to lower prices. But if we see a few things come together in the coming days or weeks, this could be a screaming buy.

My technical take on steel is this:

SLX has formed a bottoming pattern from January – mid March. It has since put in a strong impulse rally to make a higher high, and is now consolidating above key support. The RSI (Relative Strength) remains in a down trend, but if this starts to rise and SLX breaks above its recent highs around the $47.75 level I feel steel will start to rally with $50 being the next major whole number and previous high for steel to find some resistance.

Also price has been riding along the 200 day moving average which is acting as support. If price closes a couple of days below the 200 moving average I would consider this to be a bearish sign.

SLX

Steel Trading Conclusion:

In short, we are looking for the relative strength to start making new highs. Also we want to see a reversal bar on the SLX chart to the upside which we got on Tuesday. Or you can wait for a breakout and close above $47-48 area. Stop would be somewhere around the $45.75 area to start, then raise it as price rallies using intraday pivot lows on the 30 minute chart.

GET THESE REPORTS DELIVERED TO YOUR INBOX FREE: www.GoldAndOilGuy.com

Chris Vermeulen
Disclaimer: I do not own shares of TAN as this point, but may buy some in the near future.


During the past couple months several indexes, sectors and commodities have sold off more than 10 – 20%. But now some are looking like new buying opportunities. Over the next week I will bring a few of these trades to your attention as they start to unfold.

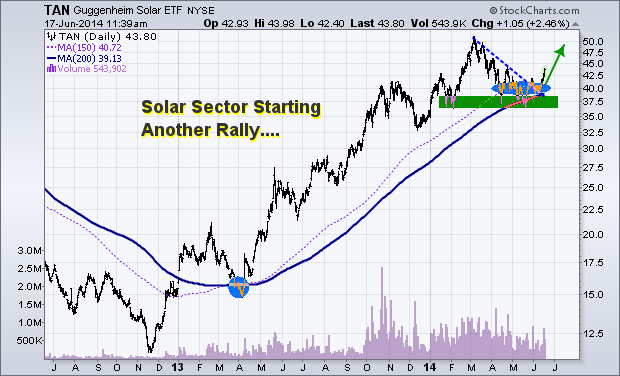
Today we are looking at the TAN solar ETF. This sector recently had a 23% hair cut in price. A 20-25% correction in price is a typical intermediate correction for a fast moving sector. The price correction has pulled the sector down to its 150 and 200 simple day moving averages. These levels tend to act as long term support for investors, a buying point.

Many of the individual stocks within this sector are starting to pop and breakout of bullish price patterns. These individual stock prices point to higher prices for TAN going forward.

Be aware of crude oil…. I do think that as long as the price of crude oil stays up solar stocks will continue to rise overall. But if oil starts to roll over and break down, TAN will struggle.

My Technical Take on The Chart:

Big picture analysis shows a powerful uptrend with bullish consolidation.

Intermediate analysis shows a falling bullish wedge, test of moving averages, and a reversal breakout pattern.

tan

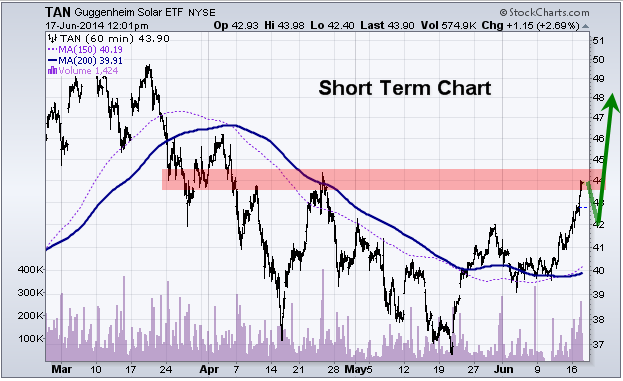
Short term analysis shows we are at a resistance level and we will likely see a pause of pullback over the next few days before it goes higher.

TANshortterm

TAN Trading Conclusion:

If price closed back below the $39.00 I would consider this bounce/rally failed.

Get My Trade Ideas Delivered To Your Inbox FREE: www.GoldAndOilGuy.com

Chris Vermeulen

Disclaimer: I do not own shares of TAN as this point, but may buy some in the near future.

Here is my market forecast for precious metals and this weeks trade setups.

Like this video? Join my premium service and get them EVERY DAY!

Subscribe Here: http://www.thegoldandoilguy.com/etf-trading-newsletter/

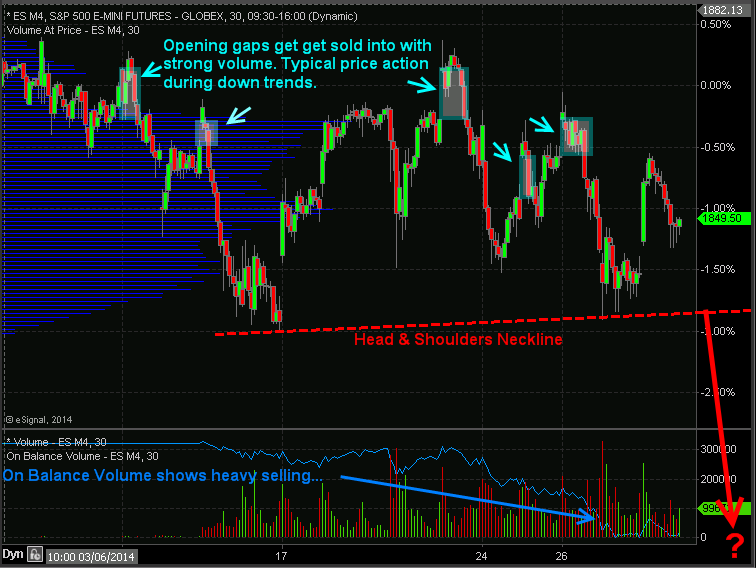
Index ETF Trading Strategies: Stocks have kick started this week with a 0.85% pop in price but the big question is if the market can hold up. Last week stocks repeatedly gap higher and sold off with strong volume telling us that institutions are slowing phasing out of stocks (distribution selling) unloading shares into strength and passing them onto the a average investor to be left holding bag.

I want to show you a couple charts which show the price action, volume and money flow of the SP500 so you have a visual of what I am talking about.

30 Minute Intraday SP500 Chart – ETF Trading Strategies

In the chart below you can see the price gaps followed by selling. Why is this important? It is important because during a down trend the market makers and big money plays who have the money and tools to manipulate the markets will allow the market drift higher or they will run price up in overnight or premarket trading when volume is light. Once the 9:30am ET opening bell rings volume and liquidity spike which allows the big money player to sell remaining long positions and or add to short positions they have.

If you look at the blue on balance volume line at the bottom of the chart you can clearly see that more contracts are being sold than bought which is typically an early warning sign that the market is about to fall farther.

ETF Trading Strategies


Automated Trading System – 30 Minute ES Futures Chart

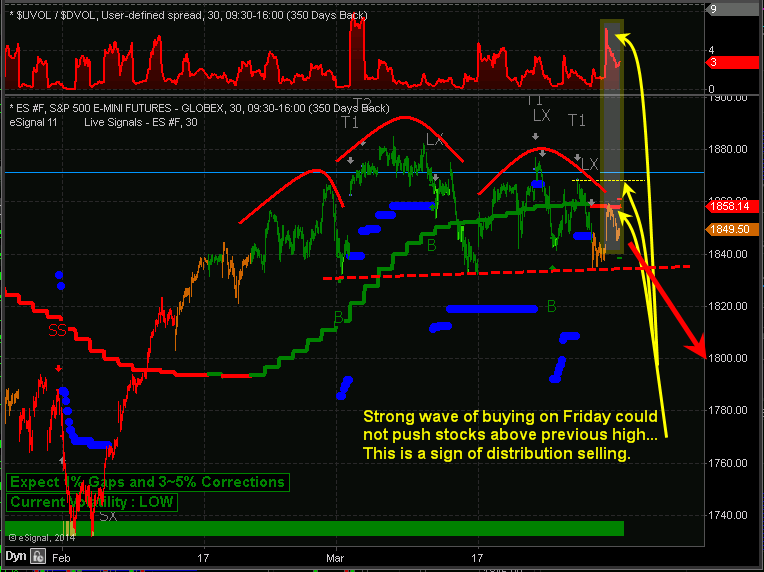
Below is a marked up screen shot of my automated trading system which I use for timing both futures and ETF trading strategies. The color coded bars tell you the market trend along with the strength of buyers and sellers.

When you couple market cycles, trends, volume/money flow, along with chart patterns we can forecast and trade markets with a high degree of accuracy in terms of market direction and timing. Ross Clark & I talk about cycle analysis, market stages etc… which you can listen to live here: http://talkdigitalnetwork.com/2014/03/this-week-in-money-129/

Automated Trading Systems


My Index ETF Trading Strategies Conclusion:

My Personal Trading Strategies Book

Just to be clear on the current market trend and my overall outlook let me explain a little more. Overall, the broad stock market remains in an uptrend. Thursday and Friday of last week we started getting orange bars on the chart telling us that cycles, volume, and momentum are now neutral. It’s 50/50 on which way the market will go from here, so until the market internals (cycles, volume, breadth) push the odds in our favor enough for a short sell trade or a new long entry we will not add new positions to our portfolio.

It is important to understand that nearly 75% of stocks/investments move with the broad market. So we don’t want to add more long positions when the odds are not in favor of higher prices. Trading in general is not hard to do, but creating, following, executing properly money and position management is. If you have trouble with following or creating an ETF trading strategy you can have my ETF trading system for rising, falling and sideways markets traded automatically in your trading account.

Learn more here about my Automated Trading Systems

Chris Vermeulen
www.TheGoldAndOilGuy.com
www.AlgoTrades.net

As we all know, there is always a bull market somewhere…

In this video report I will share with you the next three big investments for 2014 which are unfolding as we you read this. And Precious metals (gold, silver & miners) are only one of the bull markets…

You have not heard anything about these sectors on CNBC, radio, and no one is writing about them. Because of this, it has me really excited because the more people that are caught off guard with a move the bigger upside potential there is.

All you have to do is watch the video to find out…

Watch Video Now:

Get All My Trades and Investments with my ETF Trading Newsletter

Chris Vermeulen
www.TheGoldAndOilGuy.com