This week’s investor insight will make you think twice about the current stock and bond rally as we head into the end of the year.

We get a lot of questions about if the stock market has bottomed or if it is headed lower and how they can take advantage of the next Major market move. Over the next 6 to 12 months, I expect the market to have violent price swings that will either make or break your financial future. So let me show a handful of charts and show what I expect to unfold using a single asset revesting method.

Let’s dive in.

We’re told that “quitters never win.” But is it always wise to stick with something when it no longer serves us or, worse, continues to harm us?

Many years ago, when Texas hold’em poker was big and online gambling was allowed in Canada, I used to run a poker league and build custom poker tables for people across the United States and Canada. I love poker, and I still play it to this very day, but the game does require skill, a proper mindset, and self-discipline. Without all three of these things, poker is pure gambling. It’s the same when it comes to active trading or investing if you lack the skills, mindset, and self-discipline.

Retired professional poker player Annie Duke, who is also a best-selling author, and decision strategist who advises seed-stage Startups, says that learning when to quit is a critical skill, especially for investors.

Annie states, “Quitting is a good thing when applied at the right time.”

If you’ve been following me for any time, then you know I follow a detailed trading strategy with position and risk management rules. As a result, you won’t find me taking random trades or trading based on emotions. Instead, you’ll find me patiently waiting on the sidelines for a high-probability trade signal to reinvest my capital.

I trade differently. I don’t diversify. I don’t buy-and-hope, and I don’t have any positions at certain times.

What I do is reinvest in assets that are rising in value. And when a particular asset stops moving higher, I give up on the position and exit it immediately. Because I use technical analysis to follow price action, we can quickly and easily determine if an asset is rising or falling. Therefore, I can step aside and let the asset fall and look for a new opportunity that is rising, or hold the falling position and ride it lower for who knows how long…

Unfortunately, most traders and investors do not understand how to read the markets, or they don’t have control of their money. They are at the mercy of what the market does or the skills of whoever controls their capital.

Let me share some of my market insight
and help guide you

On October 21st, I stated that retirement accounts should bottom and rally into the end of the year. Bonds were hitting 11-year lows. In short, anyone holding 20+ year treasury bonds just had more than ten years of investment growth wiped out.

Bonds, the highly touted safe, low-risk asset, fell over 47% from the 2020 high. It caused similar losses to the average investor portfolio comparable to the 2008 financial crisis.

It was the worst selloff ever for treasury bonds that I can see on my charting platform. The real kicker is that the selloff in both stocks and bonds could have been avoided with just a little education and management. Subscribers and I happened to ride the COVID bond rally higher by 19%, exited the position, and moved to cash the day bond prices topped. It was partly luck to exit at the peak, but we would have exited the following trading session if we didn’t lock in profits because we managed our positions and risk. As the price reversed direction, we jumped shipped to one of my favorite positions, which almost no one thinks about or uses – CASH.

2022 has been a painful year for investors, and people are telling me they are scared to look at their investment statements. It now looks like bonds and stocks have started a seasonal rally that could help lift your portfolio as we head into the end of the year, but once it ends, look out!

Bonds and Stock Seasonality Price Movement

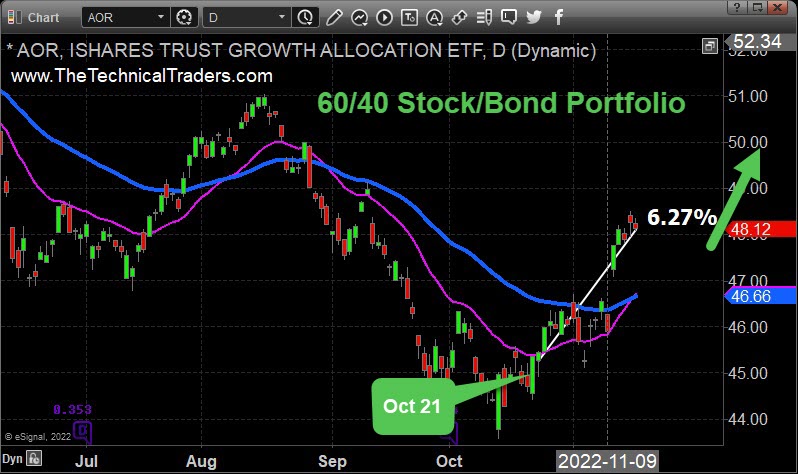
Daily Chart of 60/40 Portfolio

You should have seen your account rally 6% or more since Oct 21st, and I think it will continue higher once the market digests the recent move up. While this may excite you, be aware that after this rally, we could see another 20-47% decline in stocks and bonds in 2023. This year-end bounce is nothing more than an opportunity to get out of the antiquated Buy-and-Hope strategy that does not work during a volatile and weakening economic environment.

The next few charts, which are big heavyweight stocks that drive the market higher and pull it lower, should help you see what I see.
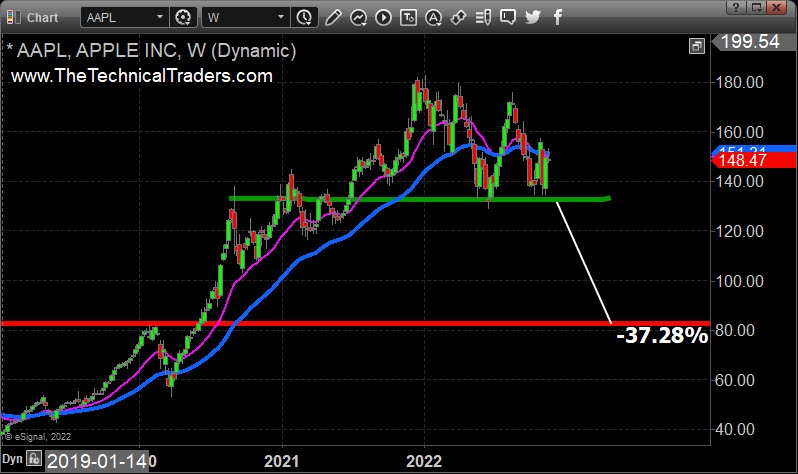
AAPL Weekly Chart and Potential Breakdown

Apple is a heavyweight stock. When it moves, it moves the stock market. Currently, AAPL shares are in what I call a STAGE 3 Distribution phase, and if support is broken, then look out below!
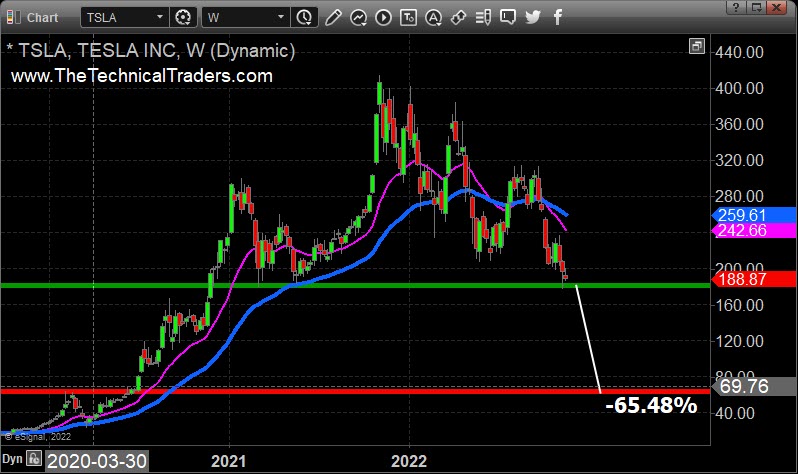
TSLA Weekly Chart and Potential Breakdown

Tesla shares are another heavyweight, and its weekly chart paints a bleak future for holders.
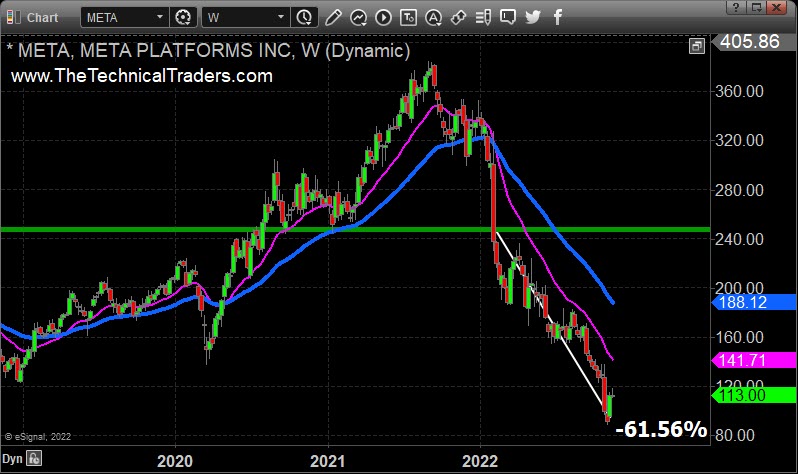
META (Facebook) Weekly Chart Breakdown Leads The Way Down

Facebook, or what is now called META, is a heavyweight stock that has already broken down from its STAGE 3 Distribution phase. As you can see, when these mega stocks break down and unwind, individual investors who have their money managed by so-called professionals who don’t know how to manage risk suffer the most.

The drop in META shares has held the tech, social, and even the S&P 500, and Nasdaq from rallying freely to the upside in the past month. When/if AAPL, TSLA, and other heavyweights break down, expect panic on Wall Street.

My general rule of thumb is if someone tells you to diversify into a bunch of different assets, stocks, commodities, bonds, crypto, etc… then they don’t know what they are doing. They are a buy-and-hold believer and willing to let their own money or that of their clients experience the severe price swings the market dishes out.

Billionaire investor warren Buffet says, “Diversification makes very little sense for those who know what they are doing.

Multimillionaire investor Jim Rogers said, “Diversification is something that stockbrokers came up with to protect themselves, so they wouldn’t get sued for making bad investment choices for clients, and that you can go broke diversifying.

The Four Stages Of Asset Prices

If you think the 2022 pullback has been distressing, you better buckle up because the bear market has not even technically started yet, from my standard. Instead, in early 2023 we should enter a STAGE 4 Decline. This is when people’s financial future and retirement lifestyles are created or broken, depending on how it’s managed.

Don’t get me wrong, I’m not saying the market will fall in 2023. I’m letting you know it’s very possible, and you best have a plan in place. On the other hand, if the markets have some miraculous recovery and start a new bull market, well, you better have a plan for that also. Either way, you need a plan, and if you are a technical trader who follows price and manages positions, it doesn’t matter what the market does; we are set either way.

If you want to learn more about who you are at a deeper level and what you specifically need to make your personality work best with your trading and investing be sure you read this and do the mini quiz on your trading personality type.

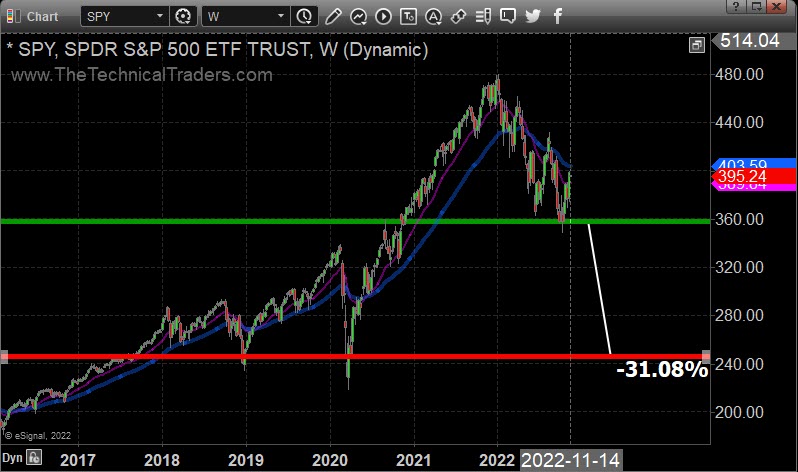
S&P 500 Bear Market Expectations 2023

The S&P 500 chart shows the extreme low that we could possibly reach if the economy and stock market fully unwind. Bonds would sell off as well until the Fed decides to step in and starts lowering the rates to try and save investors, but there will be a delay, and bonds will likely fall sharply before we see that take effect.
CONCLUDING THOUGHTS:

In short, without going off too much on a rant, you can read the three lies we are told by financial professionals that really IRK me. Because of these lies, individual investors must work harder, work longer and often experience painful financial outcomes.

What you may not know is that what you went through in 2008, the 2020 crash, and this year’s correction could have been completely avoided. If you followed a NO BS investing method that tracks price using technical analysis, is simple to follow, and is uber-conservative, then your account would be sitting at a new all-time high watermark as of this week.

The financial industry tells us to do all the wrong things, and almost everyone falls for the BS; it’s so frustrating to watch!

LIE #1: Diversify, Diversify, Diversify

LIE #2: Bonds Are A Safe Investment And Should Represent A Large Portion Of An Investors Portfolio

LIE #3: Speak With An investment Broker Or Advisor Before Placing Any Trade To Be Sure It Is Suitable For Your Personal Circumstances.

It’s total baloney because almost everyone gets the same generic advice, buy-and-hold stocks and bonds, don’t give up on it, ride out the rollercoaster, and you will be fine, trust me…

Who came up with that strategy? Sure, my 10-year-old son could buy some stocks and bonds once, let it ride for 20-30 years, and be ok. He has time and not that much money, but the big question is at what age does the stock and bond, buy-and-hope strategy become a harmful and risky investment strategy? 50-ish years of age is my thinking.

Knowing bear markets can take 3-12 years to recover from, someone who is 50+, planning to retire soon, or is already retired, doesn’t have 10+ years to keep working and saving to avoid withdrawing funds from their retirement account. Also, the fact that they have the most wealth ever in their lifetime, they should be concerned about holding through future bear markets.

Don’t be fooled. Just because everyone else has been brainwashed to buy-and-hold, aka buy-and-hope, and suffers stock market selloffs does not mean you should…

It’s like the average investor has Stockholm syndrome. They have all been beaten up by the markets over and over again. They think that’s how it should be. And in some cases are paying someone to take their money, plop it into the market, and do nothing with it for 10 – 40 years. They pay a % of their life savings each year to someone who has no risk and does not need to do too much of anything, while the investor suffers massive multi-year drawdowns, experiences high levels of stress, and sometimes big losses.

The typical investing experience most people endure is NOT how it should be. There is a better way, and I can show you.

My passion is trading and investing, having been at it for over 25 years. My goal is to help as many investors as possible to preserve their capital during difficult times and also be able to grow their wealth by trading only the most liquid ETFs. My asset revesting signals allow individuals to only hold assets that are rising in value.

Asset Revesting strategy for Wealth Manager involved moving assets between options based on market signals and that assets would be more protected against devaluation with market downturns.

Chris Vermeulen
www.TheTechnicalTraders.com

Disclaimer: This email and any information contained herein should not be considered investment advice. Technical Traders Ltd. and its staff are not registered investment advisors. Under no circumstances should any content from websites, articles, videos, seminars, books or emails from Technical Traders Ltd. or its affiliates be used or interpreted as a recommendation to buy or sell any security or commodity contract. Our advice is not tailored to the needs of any subscriber so talk with your investment advisor before making trading decisions. Invest at your own risk. I may or may not have positions in any security mentioned at any time and maybe buy sell or hold said security at any time.

Let’s kickstart things and conduct a quick thought experiment, shall we?

Who is wealthier?

Someone who works eighty hours per week and earns $450,000 per year,

or…

Someone who works 20 hours per week and earns $250,000 per year?

Insert the Jeopardy theme song here…!

There is no right or wrong answer because multiple strong cases can be made for both.

If we break things down into absolute terms, the person earning $450,000 has more money. However, the person making $250,000 is more productive per hour and has a lot more available time once the workday is done.

Your choice speaks volumes about who you are as a person, your mindset, and the life stage you are currently experiencing. I encourage you to ponder WHY you chose the answer you did.

For example…

You may be in a mid-life phase, the prime of your income-earning days. You are working hard every day to build your passion business as big as you can. You want to build wealth while the going’s good and while you have the energy to do so. One day you plan to slow down.

Maybe you are a more balanced lifestyle person and would instead choose to make less money, work fewer hours, and enjoy hobbies or adventures outside of work with family, friends, etc. To you, wealth is more about living, not working.

Again, there is no right or wrong answer. We are all in the position you are in and must do what works best for our own situation and investment personality.

Ok, let’s try another thought experiment…

This time, we’ll assume that your investment dividends and interest income pay your lifestyle expenses. Therefore, your income is separated from your time because your bills and activities will get paid even if you do zero work.

Does that seem like a wealthy person and lifestyle to you?

If so, then you likely have an intuitive understanding that wealth is a by-product of assets operating independently of your time. Take a moment to think about that…

Wealth is a by-product of assets operating
independently of your time.

Does this thought provide you the idea of freedom to do the things that excite you, make the hairs stand up on the back of your neck, and allow you to spend more time with those you love?!

It certainly does for me.

With some of my spare time, I give a helping hand to those who are not as fortunate through local charities and fundraisers. I started the 100MenWhoCare group in our town, where we focus on raising $10,000 in 60 minutes with 100 men who donate $100 each.

My daughter Mirabelle and I are part of the BrainFreeze Challenge, where our team is taking the plunge into ice-cold Canadian waters to support Mental Health for Youth programs. Did you know that suicide is the #1 cause of death for young people? I didn’t and was both shocked and saddened by that statistic. Shameless plug alert – I would love it if you helped us support the cause!

I also am an avid inventor who designed and created the world’s first flying jet surfboard – VeFoil!

How do I have time for all of this?

Because my brain thinks and works differently than almost every other trader and investor, maybe even person, I know.

Start making your capital work for you,
and then you can help others.

My life’s work is helping individual investors and financial advisors become wealthier. I help them make more money with less effort and less risk by only holding assets rising in value. When that particular asset trend ends, we reinvest our capital into a different asset that has started a new uptrend.

This asset revesting strategy allows investors to sidestep and even profit during falling stock and bond prices without taking any additional risks. In fact, it can reduce portfolio risk and volatility if you are committed to the revesting process.

What I do is very different from the old Buy-And-Hope investment strategy of the past. You know, the one we all grew up with. The strategy pounded into us as soon as we learned what money was and trumpeted by virtually all investment advice you could find. Only now, instead of the ‘big-money’ we were all but promised, we get to watch as most portfolios take an ugly swan dive and will likely end with a painful bellyflop.

No. Just NO. It does not need to be this way and certainly isn’t in my world.

What I do is the complete opposite. No Diversification, No Buy-and-Hold, No Positions at times, plus I manage positions to control risk and profits. These are things you likely don’t do, and a way of investing you won’t find any advisor doing unless they happen to be one of my clients.

I do this by helping enlightened financial advisors and individual investors embrace the idea that by using technical analysis we are able to follow price trends very closely to know when one trend has ended and a new one has started. I only invest in the most liquid assets (stock indexes, bonds, US Dollar index). I also embrace the use of systems that operate without our time and energy, which continue to work for us whether we are sleeping, playing, or on vacation.

To bring this full circle, this happens the same way that dividends will arrive and be deposited into your brokerage account no matter what you may be doing elsewhere.

Ways income can be automatically generated
with this new way of investing

They are:

  • Dividend payments from index ETFs
  • Bond ETF interest payments
  • Share lending interest income
  • Portfolio growth through revesting trades (we locked in a 5% gain yesterday in SPY)

Now, if you don’t know anything about trading or investing, that’s fine.

And if you value your time and don’t want to think about managing your investments, that’s not a problem either.

I’m all about being as efficient as possible and not having to do anything that can be done for me.

This leads to having an ETF trading strategy executed automatically in your brokerage account. I believe human error is the reason why most traders fail to make consistent money. People’s emotions, lack of self-discipline, missing trades, incorrect trade order execution, etc., all lead to investing underperformance.

For these reasons, I offer autotrading of my primary strategy at no cost. I know it’s the best option for individuals to build wealth on autopilot with less risk and less stress. And I am all for a world where we can spend more time and energy with the people, events, passions, etc., that cause our cup to runneth over.

The bottom line…

Using a multi asset revesting strategy to make your capital work for you while you are boating, golfing, working, sleeping, or traveling is like having another profitable business making you money…only without the headaches.

I explain exactly how this process works below if you want to learn more.

[embedded content]

If you have any questions, I’m always here to answer your questions!

Chris Vermeulen
Chief Investment Officer
www.TheTechnicalTraders.com

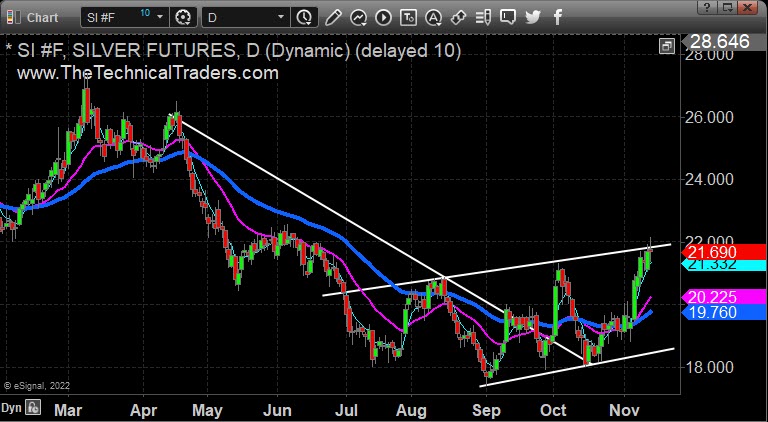
Precious metal prices – gold, silver – and related miners have been bearish for quite some time now.  It looks like that is starting to change.

When I look at the charts for gold and silver, I see similar periods of consolidation with multiple tests of support.  But even more interesting is the recent upturn in price and moving averages with some new higher highs.  That makes me interested but tentatively bullish on the metals.

There are many ways to participate in this sector.  There is, of course, physical metal – bullion or numismatics.  I’ve always liked the idea of having some physical metal that I can put my hands on.  And there are many secure storage options as well.

The metals sector has several popular ETFs – GLD, GDX, GDXJ, SLV, SILJ, etc.  One approach would be to simply buy shares in whichever one is the Best Asset Now (BAN) one or more of these ETFs.  That’s as easy as buying shares of stock.  But, like owning stock, gains may be slow to come as we participate in the price action tick for tick.

Gold Daily Chart

Silver Daily Chart

As an options trader, I like to give myself a little room to be wrong on price and reduce my cost basis by selling option premiums.  There are two basic ways to do that.  I can buy shares and sell “covered calls” against those shares.  Or I can sell puts, essentially committing to buy shares at the strike price in return for receiving an option premium.  The profit and loss graph for selling a put is the same as for selling a covered call.

I prefer the “selling puts” strategy for its simplicity and relative ease of rolling out in time and up in strike price when there is an uptrend in the underlying shares.   I don’t own any shares with this strategy.  I’m just committing to buy shares at a certain price for a certain time period and getting paid to do that.  So, it’s important to only sell puts for the number of shares I’m willing to own at the strike price sold.

Selling Puts For Consistent Income

While the option selling strategies presented here can work on any stock or ETF that has options, they work best with relatively lower-priced products that are under about $25.  A commodity ETF such as SLV – currently trading around $20 a share — is a good candidate.  SILJ at around $10.50 a share also looks good.

If we sell puts, we may have shares “put” to us at some point and will then own the shares at the strike price we sold minus the premiums collected.  Having shares put to us at a reduced-cost basis is part of the plan.  When we sell an out-of-the-money (OTM) put, we’re methodically nudging the statistics in our favor by “buying low” when there is a pull-back in the underlying.  We can alternately think of selling a put as a standing limit order to buy shares with the limit price equal to the strike price we sold.

If we have shares “put” to us, we can then sell calls against the shares we now own.  And the cost basis of the shares we purchased will have been reduced by the cumulative option premium collected by selling puts.

Trade Management

Writing puts and covered calls are relatively low-maintenance strategies that don’t have to be watched continuously.  Once we write options, we do have to be patient and let time decay in the options we sold work for us.

If the options we sold expire worthless, we can sell new options for some future expiration cycle and collect more premium.

If our sold options are in-the-money (ITM) as expiration approaches, we can defer an assignment by rolling out for additional credit.   In that case, we would buy back the option close to expiration and sell another one further out in time.  We can usually do this for an additional credit because we are selling more time value.

Want your investing done for you on autopilot? Get autotraded asset revesting signals executed in your brokerage account.

Upside and Downside Risks

As with any strategy, it’s important to ask and understand “What could possibly go wrong?” before getting involved.   Selling puts and writing covered calls are neutral to bullish strategies.   There can be sustained down trends, price shocks, and changes in volatility that can affect strategy performance.

There’s always a tradeoff when selling options.  In exchange for collecting option premium, profit is limited to the amount of premium collected plus any appreciation in shares up to the strike price in the case of covered calls.  We may not have a great opportunity to sell option premium in every possible cycle.

Keeping probability in our favor and letting time decay work for us are benefits of selling a put or covered call.   As option sellers, we don’t need large up moves to make a profit.   We have the statistical odds in our favor and option time decay working for us.  The underlying share price can go up, sideways, or even down a bit, and we can still profit.

What To Learn More About Options Trading?

Every day on Options Trading Signals, we do defined risk trades that protect us from black swan events 24/7. Many may think that is what stop losses are for. Well, remember the markets are only open about 1/3 of the hours in a day. Therefore, a stop loss only protects you for 1/3 of each day. Stocks can gap up or down. With options, you are always protected because we do defined risk in a spread. We cover with multiple legs, which are always on once you own.

If you are new to trading or have been trading stock but are interested in options, you can find more information at The Technical Traders – Options Trading Signals Service. Brian, who has been trading options for almost 20 years, sends out real live trade alerts on actual trades, such as TSLA and NVDA, with real money. If ready to subscribe, click here:  TheTechnicalTraders.com.

Enjoy your day!

Brian Benson
Co-Author: Chris Vermeulen
Chief Options Strategist
TheTechnicalTraders.com

Disclaimer: This email and any information contained herein should not be considered investment advice. Technical Traders Ltd. and its staff are not registered investment advisors. Under no circumstances should any content from websites, articles, videos, seminars, books or emails from Technical Traders Ltd. or its affiliates be used or interpreted as a recommendation to buy or sell any security or commodity contract. Our advice is not tailored to the needs of any subscriber so talk with your investment advisor before making trading decisions. Invest at your own risk. I may or may not have positions in any security mentioned at any time and maybe buy sell or hold said security at any time.

TheTechnicalTraders team, plus hundreds of others, are leading the charge in awareness and fundraising to help reduce youth suicide and would love your support. The BrainFreeze challenge we will be filming is Nov 26th so time is ticking for us to reach our goal to help as many kids as possible.


Photo: Chris, Val, Elizabeth, Ashley

I’ve been trying to find a new way to help others in need of support for a long time, and until a couple of days ago, I didn’t know what to do, but I know now!!!

I’m Freezin’ for a Reason!
I have decided to take the plunge for youth mental health in the BrainFreeze Challenge on November 26th in the icy great-lakes of Canada – Eh!

I believe in helping others whenever we can, and the cause of supporting Youth Mental Health is to make sure that one day soon, suicide will no longer be the leading cause of death for young people.

Now, if you know anything about me, you’ll know that when I feel that zing of energy or an idea, I go full tilt….and boy, did I feel that zing and get inspired from the dip!

Because I am a huge fan of extreme weather hot tubbing, and I have a rather large 10-person inground spa at my house, I decided to create 
TheTechnicalTraders Hot Tub Team.

Check Out TheTechnicalTraders Team Page:
https://jack.akaraisin.com/ui/brainfreeze2022/t/ttt

On the weekend, I was inspired by two friends (Val and Elizabeth) to do the Brainfreeze challenge after Elizabeth challenged me to a polar dip at my house to see who could stay fully submersed up to our shoulders in the lake. Elizabeth is the queen of cold water, but I took her up on the bet…

Ten minutes later, after floating in the cold lake, she asked if we could both get out together, so we did, and it was a tie. But I technically did wait a split second to let her stand first before I did… but I’m not competitive 🙂

Anyways, Brainfreeze is a yearly fundraising event created by the teams at Jack.org and Surf The Greats. Its mission is to raise money for youth mental health programs, to inspire youth to become advocates for change, and to support youth in their quest to be authentic and brave in their journey to adulthood.

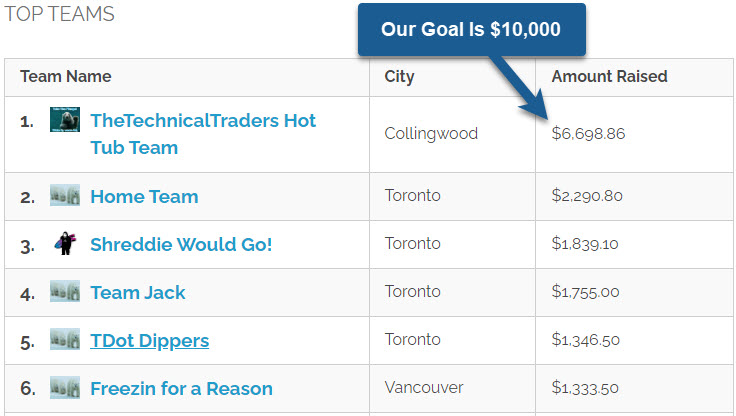
Anyways, the team and I would love for you to join us in the experience. Our goal is to raise $10,000 or more. Donors will receive a video of us all taking the plunge. The team and I are starting to raise funds, and donations on our personal pages all go towards TheTechnicalTraders Team Total. Keep in mind this is Canadian Currency, so $1 CAD is only 73 cents USD.

Water You Waiting For?

Supporting Youth Mental Health is to make sure that one day soon, suicide will no longer be the leading cause of death for young people. Help The Technical Traders Team Make A Difference – Click Here

Chris Vermeulen
Chief Investment Officer
www.TheTechnicalTraders.com

P.S. I know some of you have donated in the past to support the “100 Men Who Care” charity fundraiser I started with a few other guys. We recently supported a homeless shelter for kids with over $8000 in our one-hour gathering and group zoom event. A big thank you for your support. I know that many of you have your own charities/fundraisers/etc you donate to that are important to you. Let’s just keep helping the world one cause at a time, and together we will make a difference.

Disclaimer: This email and any information contained herein should not be considered investment advice. Technical Traders Ltd. and its staff are not registered, investment advisors. Under no circumstances should any content from websites, articles, videos, seminars, books or emails from Technical Traders Ltd. or its affiliates be used or interpreted as a recommendation to buy or sell any security or commodity contract. Our advice is not tailored to the needs of any subscriber so talk with your investment advisor before making trading decisions. Invest at your own risk. I may or may not have positions in any security mentioned at any time and maybe buy, sell or hold said security at any time.

Since July of 2014 the big cap stocks have continued to make new highs as investors dump more and more money into the stock market. Overall bullishness on the stock market is now at extremely high levels which typically happen before a major stock market correction and sometimes start a full blown bear market.

While the average investor continues to become more and more bullish, the market breadth/health has been rapidly deteriorating. Unless you are market savvy you would not know how weak the market actually is and this always leads to strong losses and drawdowns for the uninformed investor.

What we know and most do not about this rising market, is that the big cap stocks in the SP500 index appear to be holding the overall market up and masking the weakness. So as investors become more bullish at these lofty levels putting more money into generic funds that push the SP500 higher, we see strong selling and unwinding of the more leveraged position like small cap stocks.

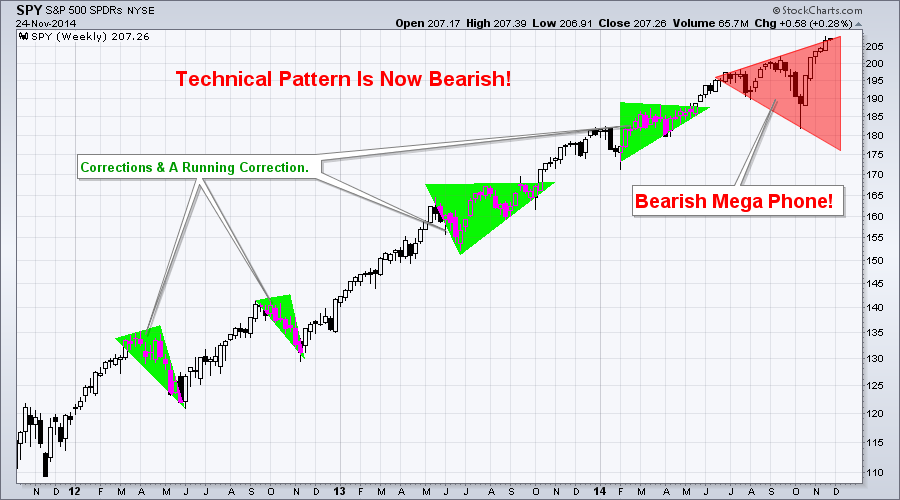
Over the past couple years the SP500 has formed a series of bullish corrections and running corrections. But the current formation is that of a bearish mega phone pattern and these typically point to lower prices.

SP500 BIG CAP STOCKS:

spy1


THE BOLD STOCKS:

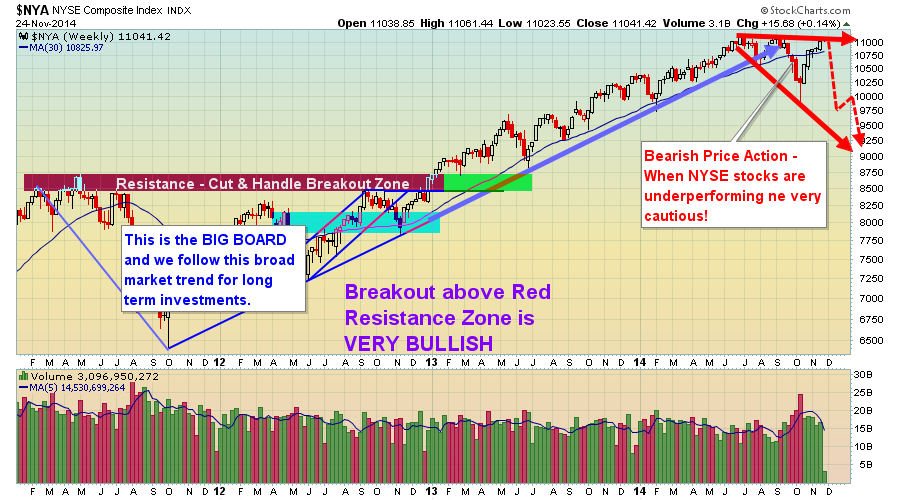
I have always liked to follow the NYSE index because its a basket of 1900 stocks with 1500 of them being U.S companies. Its breadth/strength makes it a much better indicator of the market performance than the more narrow indexes with less stocks.

While this index remains in a bull market, it only looks as though it’s a few months away from a possible reversal and confirmation of a new bear market.

nyse


THE UGLY:

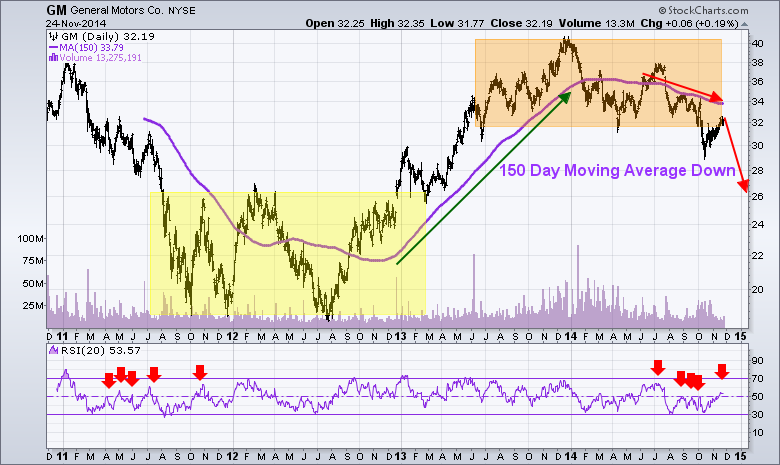
If you have ever read Stan Weinstein’s book then you know he followed GM share price closely. He believed that what GM did, the stock market would follow, to some extent. GM was/is an early leader of the US economy and stock prices in general.

The chart below paints a clear picture of the Stage 1 Accumulation in 2011- 2012, and also of the Stage 3 Distribution phase in 2013 – 2014. GM shares have traded down literally from the first week of the year and have now broken below critical support. Things could get interesting…

GM1


MY TRADING CONCLUSION:

In short, I remain bullish on the stock market with both my short term and investing outlook but I am very cautious and have closed out several large positions recently. Cash is king and I plan to protect, rather than invest my nest egg when risk is higher than normal.

Short term trading where trades only last 3-10 days is the way to go at this stage of the game. Some recent winning ETF trades with my ETF newsletter www.TheGoldAndOilGuy.com have been in SCO, a quick bounce trade in UCO, REM, and our current trade as of last week EEM.

The majority of my investment capital is traded with my automated trading system. It trades the S&P500 index directly in my brokerage account catching these 3-10 day swings in the market saving me time while reducing my emotional attachment to the market.

blackfriday1

Chris Vermeulen

If you have been paying close attention to the stock market, market internals/breadth, and bonds for the past three months, you’ve likely come to the same conclusion that I have.

The US stock market is showing signs of severe weakness with the market breadth and leading indicators pointing to a sharp correction for stock prices.

With fewer stocks trading above their 50 and 200 day moving averages each week, while the broad market S&P 500 index continues to rising, this bearish divergence is a red flag for long term investors.

When a handful of large-cap stocks are the only things propelling the stock market higher while the majority of small-cap stocks are falling you should keep new position sizes smaller than normal and start moving your protective stops up to lock in gains/reduce losses in case the market rolls over sooner than later.

Small cap stocks are typically a leading indicator of the broad market. The Russell 2000 index is what investors should keep a close eye on because it’s the index of small-cap stocks. Since March of this year, the Russell 2000 been trading sideways and actually making new lows. This tells us that big-money speculative traders are rotating out of the stock market and into other investments like high dividend paying stocks, blue chips, and likely bonds.

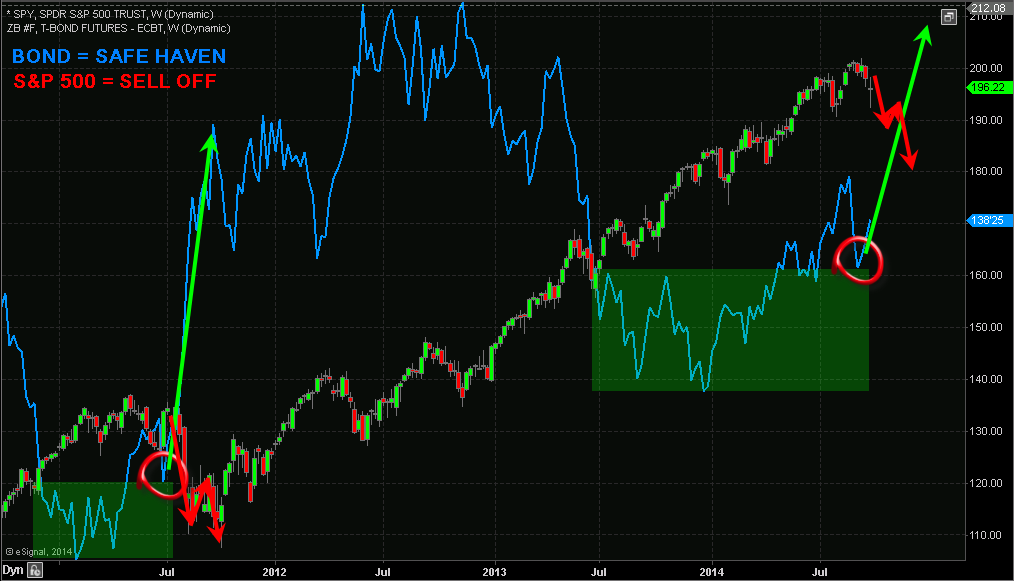
Looking at the chart below I have overlaid the S&P 500 index and the price of bonds. History has a way of repeating itself; although it may never feel the same and the economy may be different, price action of investments have the tendency to repeat.

In 2011 we saw the stock market and bonds form specific patterns. These patterns clearly show that money was rotating out of the stock market and into bonds. During times of uncertainty in the stocks market money has the tendency to move into bonds, as they are known as a safe haven. Bonds tend to reverse before the stock market does, so if you have never tracked the price chart of bonds before, then you should start.

SPXvsBONDS

From late 2013 until now bonds and the stock market have repeated the same price patterns from 2011. If history is going to repeat itself, which the technical and statistical analysis is also favoring, we should see the stock market correct 18% to 30% in the near future. If this happens bonds will rally to new highs.

It’s important to realize the chart above is weekly. Each candle represents five trading days, and four candles represents one month. So while this chart points to an imminent selloff from a visual standpoint, keep in mind this could take 2 to 3 months to unfold or longer. The market always has a way of dragging things out. If the market can’t shake you out, it will wait you out.

So if you are short the market or planning to short the market be very cautious as it could be choppy for the next several weeks and possibly months before price truly breaks down and we see price freefall.

To get my pre-market video analysis each day, and trade alerts visit: www.TheGoldAndOilGuy.com

Chris Vermeulen

During the past couple months several indexes, sectors and commodities have sold off more than 10 – 20%. But now some are looking like new buying opportunities. Over the next week I will bring a few of these trades to your attention as they start to unfold.

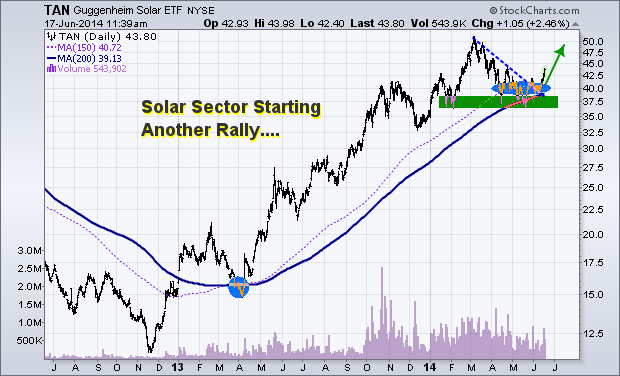
Today we are looking at the TAN solar ETF. This sector recently had a 23% hair cut in price. A 20-25% correction in price is a typical intermediate correction for a fast moving sector. The price correction has pulled the sector down to its 150 and 200 simple day moving averages. These levels tend to act as long term support for investors, a buying point.

Many of the individual stocks within this sector are starting to pop and breakout of bullish price patterns. These individual stock prices point to higher prices for TAN going forward.

Be aware of crude oil…. I do think that as long as the price of crude oil stays up solar stocks will continue to rise overall. But if oil starts to roll over and break down, TAN will struggle.

My Technical Take on The Chart:

Big picture analysis shows a powerful uptrend with bullish consolidation.

Intermediate analysis shows a falling bullish wedge, test of moving averages, and a reversal breakout pattern.

tan

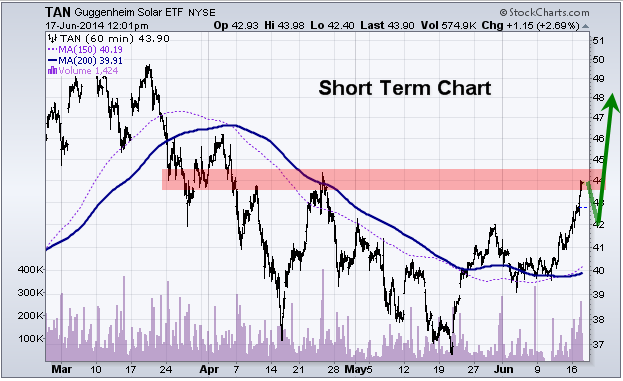
Short term analysis shows we are at a resistance level and we will likely see a pause of pullback over the next few days before it goes higher.

TANshortterm

TAN Trading Conclusion:

If price closed back below the $39.00 I would consider this bounce/rally failed.

Get My Trade Ideas Delivered To Your Inbox FREE: www.GoldAndOilGuy.com

Chris Vermeulen

Disclaimer: I do not own shares of TAN as this point, but may buy some in the near future.

If you have been struggling with your trading the past few months with most of your stocks losing value as the broad market continues to make new highs, you are not alone. There is a common reason why your individual stocks have been up so hard the past two months and I will tell you why in the next educational trading video I send you next week.
 
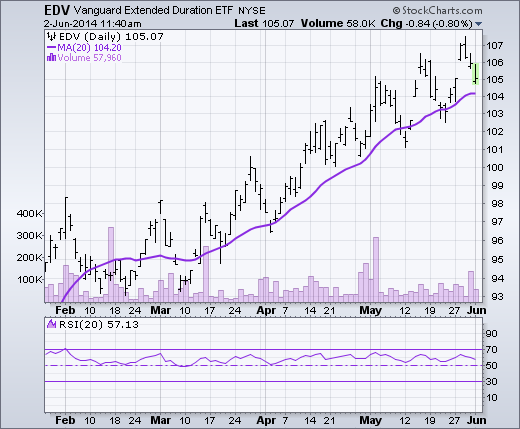
In the mean time subscribers of TheGoldAndOilGuy Newsletter pocketed 6.3% on our EDV bond ETF last week. We still hold a core position but the easy money in that asset class has now been made.
 
See Chart Below:

 
Become a more educated and consistent trader with my trade alert newsletter: www.TheGoldAndOilGuy.com

Sincerely,
Chris Vermeulen
www.TheGoldAndOilGuy.com
www.AlgoTrades.net

It looks as though the Nasdaq is about ready for another leg lower. Watch these key resistance levels for a short trade this week.

Get These Trade Alerts Every Week with my ETF Trading Newsletter

ETF Trading Newsletter: In early February I started watching the CORN ETF very closely for a possible new bull market starting and a long entry point. Many of the other commodities had already posted strong rallies while corn sat on the side lines.

The Corn ETF is designed to follow the price of the continuous corn futures contracts. This commodity looked as though it was forming a base (launch pad) for the new rally and possible major bull market to start.

This post walks you through each step of the way from entering the Corn ETF trade, adding to a winning position, tightening our stops, locking in partial profits at our first price target etc.. In fact myself and subscribers are still long the Corn ETF as of today with my ETF trading newsletter.

________________________________________


ETF Trading Newsletter – CORN ALERT #1

We have been watching the commodities index rally for a few weeks now with natural gas, coffee, sugar, gold, silver and several others jump in price. We have been watching the GCC ETF which is a basket of several commodities to get a feel for the commodities market as a whole.

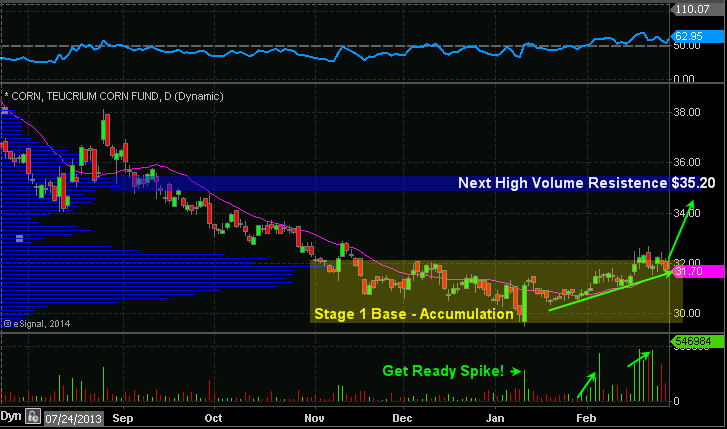
While most of the commodities have posted some solid gains, CORN has yet to pop in price. Corn looks to be forming a stage 1 basing pattern and the volume/money flowing into this fund suggest new money is moving into corn because it looks as though it will be the last to pop and rally in price.

This is similar to how we entered the silver trade a few weeks back. Everything else in the precious metals sector popped and silver lagged giving us a high probability setup.

Both the short and long term the charts of corn look bullish. As usual I will lock in some gains if we get a pop in the commodity, then let the balance ride with a break even stop. If corn is entering a new bull market phase (Stage 2) I want to hold some long term. There is potential for a 19%-30% rise in value.

Corn Trade Information:

Buy CORN etf, Stop $29.90, Downside Risk 6%, Portfolio Size 6%

ETF Trading Newsletter - Corn


________________________________________


ETF Trading Newsletter – CORN ALERT #2

New CORN Trade Order Pending

During the past couple weeks we have seen the CORN ETF trade sideways with fading volume. Recently we have seen a couple strong buying days in CORN which I call GET-READY spikes. These typically indicate some big money (insiders) are accumulating a position ahead of good news.

We are currently long CORN already and in the money, which is why I like this second setup even more. Because we already have a profit buffer, making the risk here is lower than normal. If you have ready some of the market wizard books you will also pickup on how the most successful traders pyramid up (average up) in winning trades.

My Plan Of Attack: I only want to buy on strength here focusing on entering the trade once is breaks a previous pivot high which in this case is: $34.06

Trade Setup:

Place a Buy-Stop order at $34.06, GTC (Good Till Canceled), 8% of portfolio position size

This type of order will enter you into the trade if price rallies and breaks that price point so you do not need to sit around and watch the charts. If you do not know this type of order just Google it only or call your broker. It is a very simple and basic order type.


________________________________________


ETF Trading Newsletter – CORN ALERT #3

CORN Position Added

This afternoon our CORN trade order was executed. Yesterday we set a Buy-Stop order so we get entered the commodity if price starts to breakout to the upside. These types of order are just like a stop order in respect that you just enter it and the market and broker do all the work after that.

This is why trading with a plan/strategy is much easier and less stressful. If you have a plan, do the leg work and execute it, things do not seem difficult or stressful. Problem is most traders don’t have a plan and even if they do, most times they don’t follow it. The result is a confused, stressed out trader/investor second guessing their every move.

I have updated the portfolio in the member’s area so you can review positions and protective stops.


________________________________________


ETF Trading Newsletter – CORN ALERT #4

CORN Position Adjustment – Locking in Gains

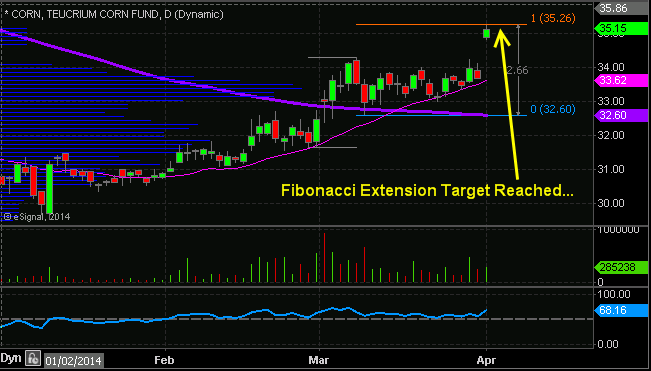
CORN has been moving in our favor for about a month now. Today’s pop in price has reached my short term measured move using fibonacci extensions and I feel it is time to lock in some gains and move our protective stop to breakeven.

We entered this position twice and your average price per share should be around $32.96.

I am moving my stop to breakeven and selling half of my position today. Current price is $35.10, as we are up 6.5%.

See chart below for a visual:

ETF Trade Newsletter

________________________________________


Why You Need My ETF Trading Newsletter as a Self-Directed Trader

You know it and I know it, trading is extremely difficult, time consuming and can be expensive if not done properly. What I have shown you above is verbatim of what subscribers to my ETF Trading Newsletter received thus far for the corn trade.

I do updated and show the charts live each day in my daily video forecast which members have access to but that is just to keep everyone up to speed on the trade to help manage their emotions and prepare for what it to happen before it happens.

Consider joining my group of happy traders today at www.TheGoldAndOilGuy.com

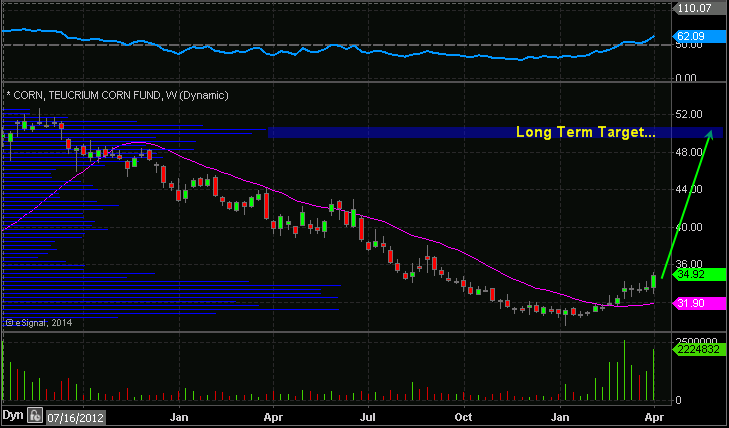
Corn ETF Trading Newsletter

Consider joining my group of happy traders today at www.TheGoldAndOilGuy.com

Chris Vermeulen