Gold Forecast Gold EagleGold Forecast: During the past year there has been very little talk about gold, silver or gold stocks in the media. Yet the year before it was all the media could talk about and they even had the price of gold streaming live all day in the corner of the tv monitor.

I am always amazed how the masses and media can be so off in their timing of the stock market and commodities in general. For example when Greece was having issues in 2012 and everyone was avoiding investments in that country like it was the plague. Looking back now, Greece is up huge and only recently investors are confident enough to put money into the Greek stock market again.

But the truth is that big move has already happend, and the US and global markets are in rotation (changing trends). Money is slowly shifting from what has been hot during the past year or two, to new investments which have a lot more room to rise in value. And this is leads us back to my gold forecast.

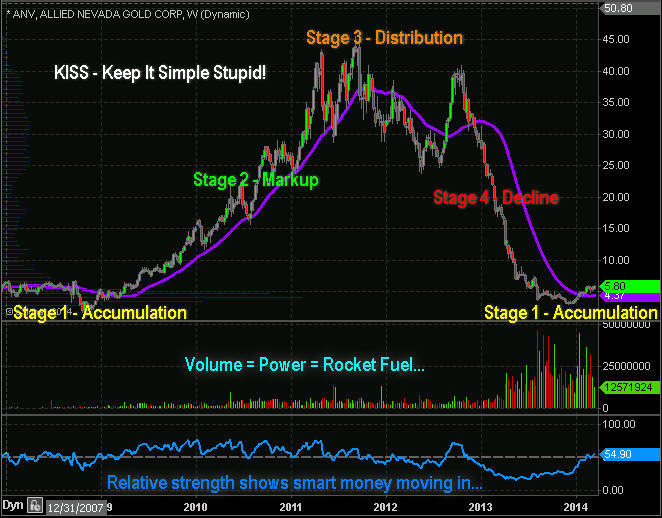
If you are at all familiar with Stan Weinstein’s work, then you understand the four market stages. If not, you can learn these four stages on my Stan Weinstein page.  Through stage analysis we can predict the type of price action we should expected and have a rough idea just how long a move (new trend) is likely to last. It is important to know that Stan Weinstein’s stage analysis works on any time frame from a one minute chart to a monthly chart. If you do not know this then you are trading almost blind without a doubt.

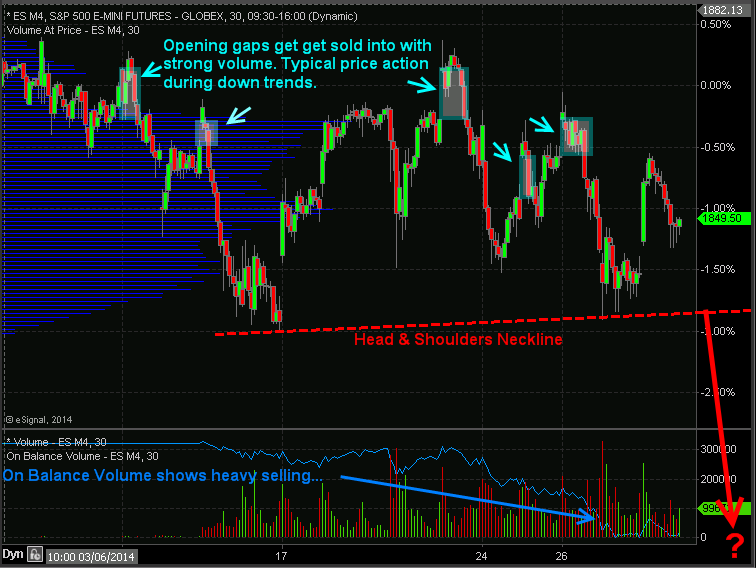
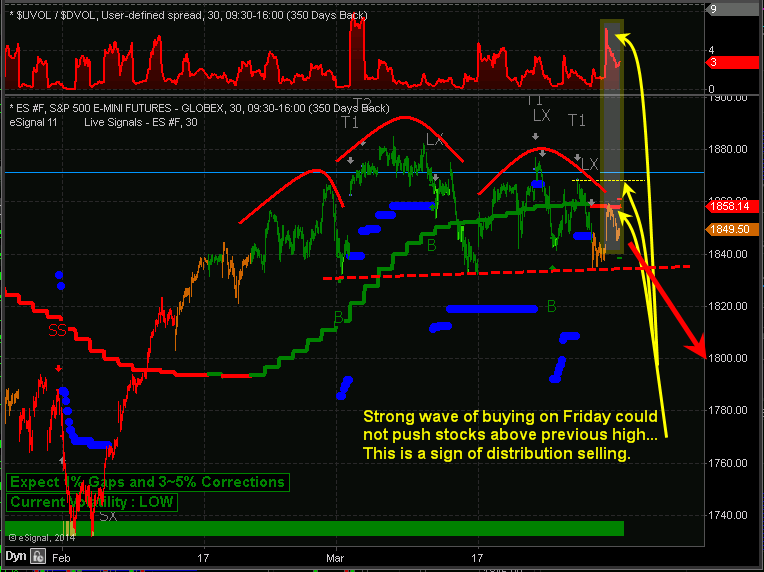
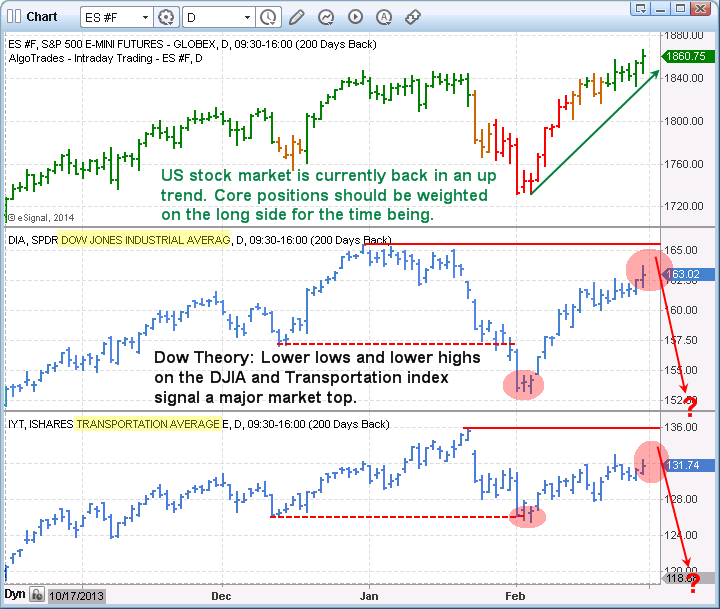
Current stage analysis looks as though the US stock market may be starting to form a stage three top. There are several indicators and market behaviors which are screaming, telling us to trade with caution to the long side. But the masses do not see this or hear what is unfolding in front of their very own eyes, and that I fine. It actually reminds me of a funny old movie called “hear no evil, see no evil”.

In short, the market is showing some signs of distribution selling in stocks, and the once market leaders are now getting completely crushed with heavy selling volume like the biotech stocks, social media stocks and other momentum stocks and this is bad.

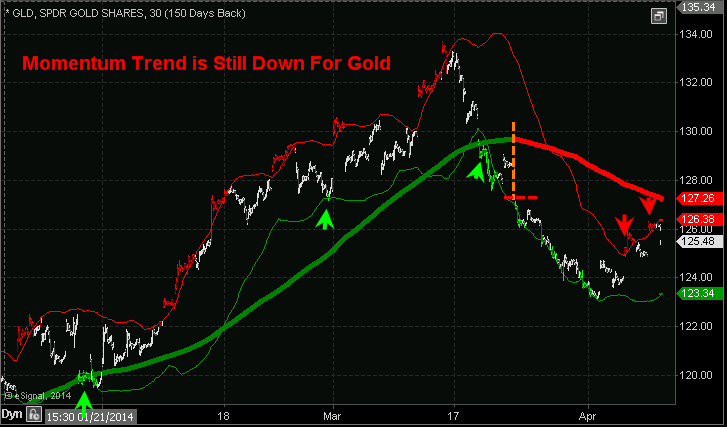
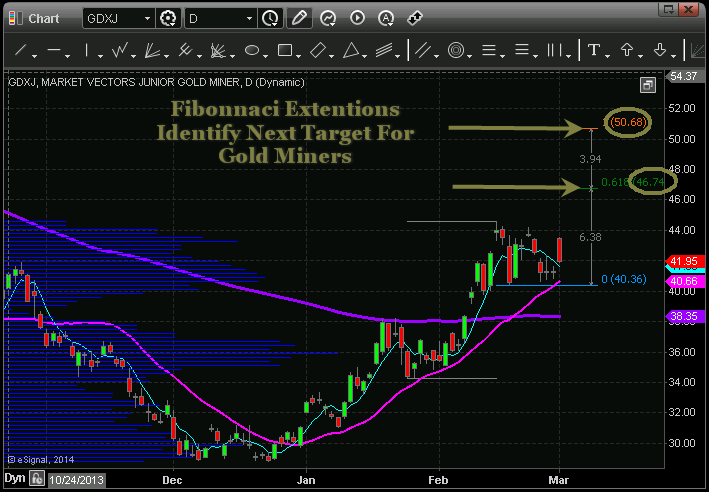
Gold on the other had has been forming a stage one basing pattern. This provides a very bullish long term gold forecast that investors could ride for several years.

———————–

Q: Where Will Investment Capital Go During The Next Bear Market In stocks?

A: One of the places will be precious metals. Click here for my gold forecast which shows the main reason why

———————–

Gold Forecast Coles Notes:

1. The US dollar index has setup a massive stage 3 topping pattern on the weekly chart. A falling dollar will send the price of gold higher naturally.

2. Bullish gold forecasts by the media have dropped substantially, meaning everyone is bearish on gold.

3. Gold stocks are already showing signs of massive accumulation. I always use the price and volume action of gold stocks to help create and time my gold forecasts which it starting to look bullish.

Gold Forecast Conclusion:

Gold market traders should understand that precious metals in general are still months away from breaking out to the upside and starting a new bull market. Do not be in a rush to buy gold or gold stocks yet. There will be plenty of time folks.

Get My Daily Video Gold Forecast & Gold Trading Alerts at: www.TheGoldAndOilGuy.com

Chris Vermeulen

I did a short video a while back on momentum trading gold and wanted to share it and post it in the members area of the website for you to view. It’s short and basic, but useful.

Current snap shot of gold trend…

Gold - ETF Trading Newsletter


Learn More & Trade With My Alerts with my ETF Trading Newsletter

Chris Vermeulen

Index ETF Trading Strategies: Stocks have kick started this week with a 0.85% pop in price but the big question is if the market can hold up. Last week stocks repeatedly gap higher and sold off with strong volume telling us that institutions are slowing phasing out of stocks (distribution selling) unloading shares into strength and passing them onto the a average investor to be left holding bag.

I want to show you a couple charts which show the price action, volume and money flow of the SP500 so you have a visual of what I am talking about.

30 Minute Intraday SP500 Chart – ETF Trading Strategies

In the chart below you can see the price gaps followed by selling. Why is this important? It is important because during a down trend the market makers and big money plays who have the money and tools to manipulate the markets will allow the market drift higher or they will run price up in overnight or premarket trading when volume is light. Once the 9:30am ET opening bell rings volume and liquidity spike which allows the big money player to sell remaining long positions and or add to short positions they have.

If you look at the blue on balance volume line at the bottom of the chart you can clearly see that more contracts are being sold than bought which is typically an early warning sign that the market is about to fall farther.

ETF Trading Strategies


Automated Trading System – 30 Minute ES Futures Chart

Below is a marked up screen shot of my automated trading system which I use for timing both futures and ETF trading strategies. The color coded bars tell you the market trend along with the strength of buyers and sellers.

When you couple market cycles, trends, volume/money flow, along with chart patterns we can forecast and trade markets with a high degree of accuracy in terms of market direction and timing. Ross Clark & I talk about cycle analysis, market stages etc… which you can listen to live here: http://talkdigitalnetwork.com/2014/03/this-week-in-money-129/

Automated Trading Systems


My Index ETF Trading Strategies Conclusion:

My Personal Trading Strategies Book

Just to be clear on the current market trend and my overall outlook let me explain a little more. Overall, the broad stock market remains in an uptrend. Thursday and Friday of last week we started getting orange bars on the chart telling us that cycles, volume, and momentum are now neutral. It’s 50/50 on which way the market will go from here, so until the market internals (cycles, volume, breadth) push the odds in our favor enough for a short sell trade or a new long entry we will not add new positions to our portfolio.

It is important to understand that nearly 75% of stocks/investments move with the broad market. So we don’t want to add more long positions when the odds are not in favor of higher prices. Trading in general is not hard to do, but creating, following, executing properly money and position management is. If you have trouble with following or creating an ETF trading strategy you can have my ETF trading system for rising, falling and sideways markets traded automatically in your trading account.

Learn more here about my Automated Trading Systems

Chris Vermeulen
www.TheGoldAndOilGuy.com
www.AlgoTrades.net

Watch here to learn more about my improved gold forecast and etf newsletter…


Also You may want to see these three new long term investment plays:
http://www.thegoldandoilguy.com/next-three-bull-markets-starting/


And my unique way to gauge the market strength:
http://www.thegoldandoilguy.com/gm-gs-xom-broad-market-trading-strategy/


JOIN ME WHILE I TRADE FOR CONSISTENT LONG TERM GROWTH – Click Here

As we all know, there is always a bull market somewhere…

In this video report I will share with you the next three big investments for 2014 which are unfolding as we you read this. And Precious metals (gold, silver & miners) are only one of the bull markets…

You have not heard anything about these sectors on CNBC, radio, and no one is writing about them. Because of this, it has me really excited because the more people that are caught off guard with a move the bigger upside potential there is.

All you have to do is watch the video to find out…

Watch Video Now:

Get All My Trades and Investments with my ETF Trading Newsletter

Chris Vermeulen
www.TheGoldAndOilGuy.com

Over the years working with professional traders I found it interesting how each individual has their bellwether stock they follow to gauge the stock markets trend and identify reversals before they take place.

About 10 years ago I traded with a floor trader who swore that whatever GS (Goldman Sachs) did the market followed. Another said he only used XOM (Exxon Mobile), while Stan Weinstein says GM (General Motors) was the stock to follow.

While each of these traders have been highly successful with their bellwether stock, I wanted to cover these in more detail and show you have to get the best of each of their strategies working for you. This will help you properly time the market, identify the overall market health and at which point you should be getting long or short stocks in your portfolio.

Watch this quick video below:

If you would like to successfully trade both bull and bear markets then join my trading and investing newsletter today and catch the next hot sectors for 2014 using my ETF Trading Strategies.

Chris Vermeulen
www.TheGoldAndOilGuy.com

Gold and gold stocks have be stabilizing for months and have been quietly rising. Many gold stocks are up 30% even 50% in the past three months. The $HUI AMEX Gold Bugs Index is up over 30% from the lows.

If you think you have missed most of the move already you are wrong. The truth is most of the biggest rallies in stocks take place after a basing pattern with 30 -50% or more has formed. This is signaling massive accumulation in gold stocks and its happening right now by the institutions.

So in this exclusive report I want to share one golden rocket stock pick which I feel has huge upside potential “IF” the precious metals market and miners can breakout of this stage 1 pattern it has formed.

One thing that excites me is about precious metals and gold stocks is the fact that we have heard nothing about gold, silver or mining stocks in the media for months… almost like the big institutions have told the media to avoid putting the spot light on it until they accumulate all they can in terms of physical bullion and stock shares.

This is the same for a few other sectors I have been watching build massive stage 1 bases in over the past few months and will be investing and actively trading them also once they break out of the basing stage.


Gold Stock Trading & Investing Success Formula

1. KISS – Keep It Simple Stupid! – Non one likes or follows complicated trading strategies

2. Understand and know how to identify the four market stages – Read My Book: Click Here

3. Know why and how stages must be traded for timing your entry, profit taking and exits.

4. Scan the market for the top performing sectors and focus on stocks/ETFs within those sectors.

5. Review all stocks and funds to meet setup criteria and trade only the best looking charts primed to start a new bull market (low overhead resistance nearby, strong relative strength, strong volume on breakout, 30 week SMA moving up etc..) Get this done for you: Click Here

6. Sit back, watch and monitor position for possible change in the stage, to adjust stops and identify profit taking levels.


Golden Rock Stock Pick

The chart below is top quality gold stock which has all the characteristics of a big winner. Just to be clear, I normally do not mention individual stocks within public reports. I am not compensated in any way to post this report. This is nothing more than my technical outlook on a stock and not investment advice. I do plan on buying some shares of this company this week or next.

Gold Forecast - Gold Stock Picks


Golden Rocket Conclusion:

While it still my be a little early for precious metals to bottom, it looks as though the stage (pardon the pun) has been set for a precious metals bull market to start. As they say, there is always a bull market somewhere… the key is finding it and taking the proper action.

If you want simple, hassle free trading and investing join my newsletter today.

Chris Vermeulen – www.TheGoldAndOilGuy.com

Over the years Chris Vermeulen has identified a price pattern that consistently makes me money time and time again. This pattern is not found in books, nor is it talked about in any trading course or by any elite traders.

What Is It And Why Doesn’t Anyone Talk About It?

Well that is a good question and he thinks the main reason is because no one knows about it. He has mentioned it to a lot of traders and many of them are professional traders yet it completely goes over their head or they are dismissing it because they don’t want others to find out about it.

The other reason could be because traders don’t know what to call it. He gave it a simple name as he just named it what it is, so it is self-explanatory.

While he sees and trade this secret price pattern on all time frames (it does not work on tick charts), the longer the time frame in which it forms the better. If the pattern forms a weekly chart then you are looking at a major investing opportunity that has an average return of 57% return within a few weeks. The daily chart pattern tends to provide 10- 20% return within a few days of this pattern forming.

Subscribers of hisETF Portfolio Newsletter profited twice in February from it locking in 10% and 21.9% trading simple ETFs.

He also mentioned this pattern does not form on baskets of investments like a sector or index. It only takes please on individual investments like stocks and commodities.

Here is what a fellow subscriber said:
Chris, Over the years, I’ve learned so much from your videos.  One of the set ups I love most, because it has been very profitable is the must be a paid subscriber pattern.  I believe subscribe  is now forming the last part of this pattern.

So if you want to be making these trades with Chris join his ETF Trading Newsletter todayETF Newsletter
Chris Vermeulen

Over the past few weeks I have been watching the DOW and Transportation index closely because it looks and feels like the Dow Theory may play out this year and the stock market could take a 15% haircut.

But what if you skipped on the haircut and opted for a 40% refund?  What? Keep reading to find out how.

Keeping this post short and sweet, I think the US stock market is setting up for a sharp selloff. And it will look a lot like the July 2011 correction. If my calculations are correct this will happen in the next 3-9 weeks and we will see a 15% drop from our current levels. Only time will tell, but I have a way to hedge against this with very little downside risk to you ETF portfolio.


The Dow Theory Live Example for ETF Portfolio

The daily chart of the SP500 index below shows our current trend analysis with green bars signaling an uptrend, orange being neutral, and red signaling bearish price action. Currently the bars are green and we can expect prices to have an upward bias.

The Dow Theory could be  in play. When both the Transports (IYT) and the Dow Jones Industrial Average (DIA) cannot make higher highs and start making lower lows, according to the Dow Theory the broad stock market is topping.

We are watching the market closely because they have both made lower highs and lows.  This rally could stall in the next couple weeks and if so we expect a 15% correction.


Model ETF Portfolio


Take a look at the 2011 Stock Market Crash

Model ETF Portfolio Trading

The chart above shows how fearful traders have a delayed reaction to moving money from stocks to a mix of risk-off assets.

The choppy market condition during August and September clearly helped in frustrating investors and created more uncertainty. This helped prices of this ETF portfolio fund rally long after the initial selloff took place. This is something I feel will take place again in the near future and subscribers of my ETF newsletter will benefit from this move.

Because we have a Dow Theory setup, our risk levels are clearly defined as to when to exit the trade if it does not play out in our favor. But with the potential to make 40% and the downside risk only being 4%, it’s the perfect setup for a large portion of our ETF portfolio. And just so you know this is not a precious metals trade as we are already long that sector and up 10% in that position already.

Get My Daily Video Forecasts & ETF Trades Today – Get Off The Fence Make Your ETF Portfolio Perform

Chris Vermeulen
www.TheGoldAndOilGuy.com

Gold mining junior stocks (Market Vectors Junior Gold Miners Fund 0 GDXJ) looks poised for higher prices…

Many traders are getting nervous about metals and gold stocks falling but if you ask me the chart looks very attractive.

gold-forecast-gold-stocks


Gold Forecast

Get My Gold Forecast & Gold Trades: Click Here