One thing I have talked about several times which cannot be understated is that is the tendency for investors to believe that complex trading ideas and automated trading systems are better than simple, logical ones.
At first thought this notion is completely understandable. After all, if an idea is fairly simple, how could it possibly be “a secret” and investors not using it yet?
Successful trading and investing is not about how good you look or how impressive you sound in videos. It’s about what, when and how you do it. It does not matter if you are placing the trades yourself or using an automated trading system. What, when and how the investment is traded is all that matters.
It’s known that highly intelligent people struggle with the markets because they believe intelligence will improve their trading results. The reality is, they do not thing simple trade setups and strategies that look like they will make easy money, will work. Why? Because they think that the market is complex and thus trades should not be simple to spot and time, therefore the simple ideas should not work.
In all fairness “simple trading” is not really that simple. Successful trading requires the right kind of simplicity, in the right amount at just the right time. This is what creates the highly profitable investors and automated trading systems.
Why The Short Traders Are Losing Money This Week:
They are fighting a bull market which is still pointing to higher prices.
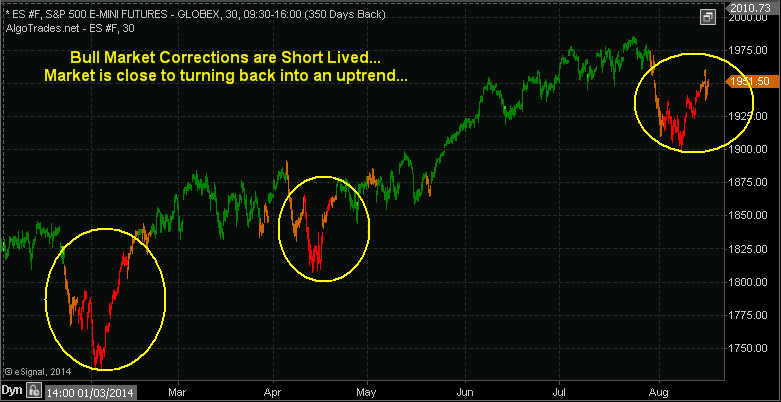
Take a look at the chart below of the SP500 futures index. You will notice the bars are color coded; this is done by my automated trading system which identifies the market trend which trades should be trading in line with.
The stock market remains in a full blown bull market. Investors should remain long for time being. On the other hand active investors should be trading with the current market trend which is shown on the chart.
Market corrections within a bull market are sharp and short lived. As an active investor you will be lucky to catch one or two short trades during these pullbacks before the uptrend is retaken.
It is important to know that eventually one of these bull market corrections will be the straw that breaks the camel’s back, and kick starts a new bear market. This his why I always move to cash and look to short each of these corrections. We just never know WHEN a full blown bear market will start. If you are holding your positions through these corrections and think you’re a great investor, just wait until the market does actually breakdown and most of your gains are gone before you realize it. I will admit, its very easy to get lazy with investments after years of rising prices. Laziness and a the lack of a trading strategy for a falling market is what causes 99% of investors to lose their money.
I believe in trading defensively. Sure it’s more work, takes time to follow, and there are extra trading commission fees, but its a small price to pay to keep the majority of your gains.
SP500 Monthly Big Picture Analysis
Here is the big picture and trend of the SP500 index. Simple fact is, eventually things are going to get really ugly. By stepping back and looking at this chart, it’s clear the market must still fall substantially in value to break below its critical support trend line and before we can confirm a true bear market is in place.
Do you want to see your nest egg drop 20-30% before you decide to exit? Or do you want to profit from this initial correction when it does happen, and make even more money when the stock market drops for a year or two after taking your account to new all-time highs.
Keep It Simple Conclusion: Automated Trading Systems?
The good news is that if you keep things simple by following the intermediate trend, like the color coded chart above, you can keep making money as the market rises to ridiculous new highs, and avoid market corrections, and possibly even profit from them.
In my next article I will show you a simple trading strategy that I have used for many years to time stock market bottoms and tops for swing trading. Best part is that the data I use is available online for free.
One final note, there are automated trading systems that does all this for you. I also use it and have it trade my own investment capital for me. You can learn more about it and join my mailing list here:http://www.algotrades.net/automated-trading-system-2/
Chris Vermeulen
Back in the day when I was a newbie trader and investor I used to follow several stocks, sectors and commodities that had a setup chart patterns. I would draw all over them and then wait to catch the day of the breakout.
Unfortunately I would miss a good chunk of the trades because they would breakout when I want not watching the chart forcing me to miss some unbelievable momentum and swing trading opportunities. I used to get rather frustrated with trading to put it kindly.
But I eventually learned that there are several ways to avoid this from happening and each of these options work much better than watching the charts like a hawk waiting for that breakout that may or may not happen.
The beauty of my trading system is that it allows me to buy on the breakout whenever a strong breakout happens without me, I have methods that will automatically enter me into a long position on the first pullback after a confirmed trend reversal.
The positive trade-off of buying a pullback that follows a trend reversal or chart pattern is that buying pullbacks is often lower risk than buying breakouts because there is a lower risk of the breakout failing.
Before I get into those details let me update you on what gold stocks just did and what I expect them to do in the near future.
Recently we have seen big money move into gold stocks. Gold and silver stocks are popping on high volume which is great to see. While it is exciting gold stocks are not yet in the clear from further selling or sideways trading.
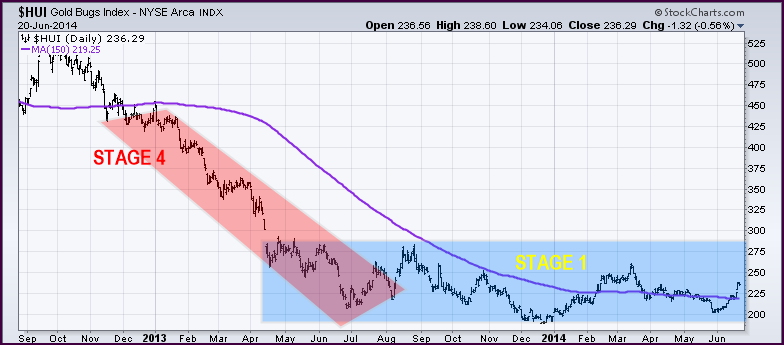
If you are familiar with Stan Weinstein or have followed my work for a while you likely understand the four stages the market goes through (same on all time frames). Looking at the chart below its clear that the gold stock index HUI has completed a stage 4 decline and appears to be in the second half of an accumulation stage 1.
The stages in this chart I am talking about are big picture trends which last a year or two, more of an investors 35,000 foot view on the market. I breakout and rally above the $280 level will be very bullish, any pause or pullback after that will provide a low-risk opportunity to get involved.
I will let you in on a little secret of mine, and almost never buy an upside breakout, I actually wait for the first pullback. And on the flip side, I always short on the breakdown, and if I miss it, I will then get short on the first bounce.
If you have not read my report on the next countries to start bull markets then checkout it out here: Click Here
In my next article I am going to tell you exactly how to avoid missing the breakdowns and how to be entered automatically into these trades when the market has its first pullback for 100% Hands-Free Trading.
Find This Article Educational? Delivered To Your Inbox Free Here www.GoldAndOilGuy.com
Chris Vermeulen

 Click Here to Listen to the Audio

