 https://thegoldandoilguy.com/wp-content/uploads/2016/06/jobsgrowth.jpg
183
275
admin
http://www.thegoldandoilguy.com/wp-content/uploads/2014/11/tgaoglogo.png
admin2016-06-06 11:33:282016-06-06 11:33:28Don’t Bank On Rate Hikes!
https://thegoldandoilguy.com/wp-content/uploads/2016/06/jobsgrowth.jpg
183
275
admin
http://www.thegoldandoilguy.com/wp-content/uploads/2014/11/tgaoglogo.png
admin2016-06-06 11:33:282016-06-06 11:33:28Don’t Bank On Rate Hikes!Improve your trading and
 https://thegoldandoilguy.com/wp-content/uploads/2016/06/jobsgrowth.jpg
183
275
admin
http://www.thegoldandoilguy.com/wp-content/uploads/2014/11/tgaoglogo.png
admin2016-06-06 11:33:282016-06-06 11:33:28Don’t Bank On Rate Hikes!
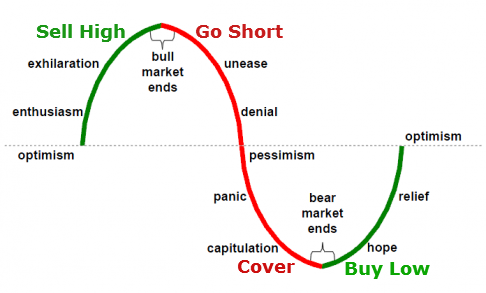
Stock Market Elliott Wave Count, Economic Cycle and Equities Cycle
As you know a picture is worth 1000 words so consider this short yet detailed post a juicy 2000+ word report on the current state of the stock market and economic cycle.
The charts below I think will help you see where the US stock market…

The Great Financial Disconnect!
The G-7 global finance meeting failed to yield fresh ideas for spurring global growth.
The Finance ministers of the Group of Seven major economies ended a weekend meeting without agreement on a plan to revive global growth. Most of the G-7…

Is There A Bear Market in Progress?
The SPX topped out one year ago, on May 20th, 2015 at 2134.72. One year has gone by in the SPX and has still not made a new high. It could be many years before we breach that high!
The SPX chart below indicates why it is not making any new…

The Next Top Performing Asset to 2020 & Beyond
2016 has been a great year for gold. Its currently up 17%.
This is the best time to invest in gold for the long-term investor.
The Elliott Wave Principle is a form of ‘technical analysis’ that believes investors move between periods…

Is This the End of the Road?
In May of 2008, there was a very similar stock market ‘rally’ as compared to today's ‘rally’. Investors believed that the ‘turmoil’ during the latter part of 2007 and the early part of 2008 was permanently over and that we were…

The Financial Stress Index: A Tool for Monitoring Financial Stability
There are several ways to stress test the market and to get a feel for overall strength of the overall economy and financials of the United States. Each with their own strengths and weaknesses.
Find out what these two stress tests are telling…

Why Price Spikes Are Actually Your Friend
I could go on in detail about why and what price spikes provide us short term trades with, and I will in a future article and video. Keeping things short and simple we will let the charts to the speaking for now because they paint a very clear…
 https://thegoldandoilguy.com/wp-content/uploads/2016/05/radio-on-air.jpeg
408
615
admin
http://www.thegoldandoilguy.com/wp-content/uploads/2014/11/tgaoglogo.png
admin2016-05-18 07:20:112016-05-18 07:21:30Radio Interview with Chris Vermeulen – Major Moves Starting