IS THE OTHER SHOE ABOUT TO DROP WITH FED NEWS?
We’ve been watching the markets today and over the past few days after the Saudi Arabia attack and are surprised with the real lack of volatility in the US major markets – excluding the incredible move higher, then lower in Oil. The real news appears to be something completely different than Oil right now. Might it be the Fed Meeting?
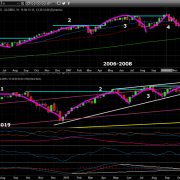
You might remember our August 19th prediction, based on Super-Cycle research and patterns, that a breakdown in the global markets was about to take place? This failed to validate because of external factors (positive news related to the US China Trade talk and other factors). This didn’t completely invalidate the super-cycle pattern – it may have just delayed it a bit.
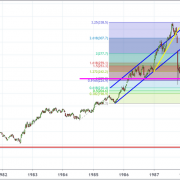
That super-cycle pattern initiated in 2013-2015 and concludes in 2019/2020. This is one of the reasons why we believed the August 19 date was so important. It aligned with our price cycle analysis and our Fibonacci Price Amplitude Arcs. We believed this was the date that we would learn the future of the markets and possibly start a bigger price breakdown.
It now appears that the foreign and US credit markets are starting to “freak out” and we may find out that the US Federal Reserve is rushing in to rescue the global markets (again) from their own creation. The Repo Markets appear to be setting up a massive crisis event as rates skyrocket overnight. See the article below from ZeroHedge.
Source : Zerohedge.com : “Nobody Knows What’s Going On”: Repo Market Freezes As Overnight Rate Hits All Time High Of 10%
Many analysts have discussed the US Dollar shortage in foreign markets that relates to global credit functions, sustainable trade functions and much more. If the US Dollar shortage is reaching a critical point where foreign markets are unable to function properly and where Repo Rates are reflecting this crisis, we may be on the verge of a much bigger credit crisis event that we have imagined.
In our opinion, the scope and scale of this event depends on the September 17/18 US Fed meeting outcome and the tone of their message afterward. If the Fed softens and injects capital into the global markets, we may see a bit of a reprieve – even though we may still see concerns weighing on the global markets. If the Fed allows the card to fall where the may, so to say, we may see a bigger crisis event unfolding over the next 2 to 4 weeks – possibly much longer.
We believe this event is related to the Capital Shift that we have been discussing with you for more than 2+ years. Capital always seeks out the safest and most secure returns in times of crisis. Capital will also seek out opportunity at times – only when opportunity is relatively safe compared to risk. This may be a time when opportunity is limited and the potential for risks/crisis are very elevated. At those times, capital rushes away from risk and into safety in Cash, Metals and the safest instruments in the global markets – we believe that would likely be the US, Canadian, Japanese, British and Swiss markets/banking systems.
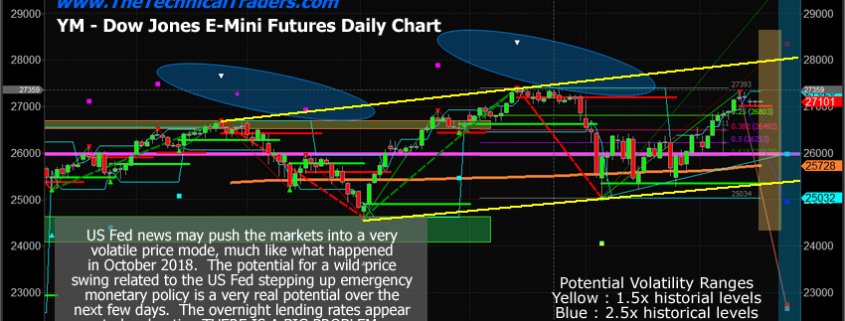
DOW (YM) DAILY CHART
This YM Daily chart highlights recent price ranges and shows us what a 1.5x and 2.5x volatility explosion could look like (see the Yellow and Blue highlighted ranges on the right end of the chart). We believe the event that is setting up, with the US Fed meeting/announcements pending, could prompt a large volatility event over the next few days/weeks/months that may target these expanded volatility ranges.

MIDCAP INDEX DAILY CHART
This MC, MidCap, Daily chart highlights the same range expansions (1.5x and 2.5x) related to the recent price ranges in the MidCap Index. Traders must take a moment to understand how an extremely volatile pricing event within these ranges could create dramatic profit or loss risks. Imagine what would happen is the MC was suddenly targeting 1775 or 1620 on some type of crisis event – a 20% to 30% price decline.

DAILY TRANSPORTATION INDEX CHART
This Daily TRAN, Transportation Index, chart provides a similar picture of the type of volatility event that we believe could be setting up currently. From current levels, the Transportation Index could rotate within a +/- 15~25% price range if a new credit crisis event were to roil the markets.

CONCLUDING THOUGHTS:
What can you do about it and how can you protect your investments from this event? Learn to protect your assets by taking advantage of current high prices, pulling some profits, protect long trades, scale back your active trading and learn to size your trades appropriately. If you have not already done so, strongly consider a position in precious metals (Gold or Silver) and move a larger portion of your portfolio into CASH.
The risks of another global credit crisis event appear to be starting to show very clear signs right now. This event will likely be focused on foreign markets – not necessarily focused on the US markets. We’ve been warning our followers about this type of event for many months now and we are alerting you to the fact that the Repo Markets appear to be screaming a very clear warning that foreign credit many be entering a crisis mode.
I urge you visit my Wealth Building Newsletter and if you like what I offer, join me with the 1 or 2-year subscription to lock in the lowest rate possible and ride my coattails as I navigate these financial market and build wealth while others lose nearly everything they own during the next financial crisis. Join Now and Get a Free 1oz Silver Round or Gold Bar!
I can tell you that huge moves are about to start unfolding not only in metals, or stocks but globally and some of these supercycles are going to last years.
As a technical analysis and trader since 1997, I have been through a few bull/bear market cycles. I believe I have a good pulse on the market and timing key turning points for both short-term swing trading and long-term investment capital. The opportunities are massive/life-changing if handled properly.
Chris Vermeulen
www.TheTechnicalTraders.com

