Gold Price and Indian Demand Shifting Trends
Chris Vermeulen – www.TheGoldAndOilGuy.com
One of the top stories in the financial markets in 2012 has to be the stagnation in the price of gold at around $1600 an ounce, which is down approximately 17% from its peak at $1920.30. Those bullish on the yellow metal have been disappointed in gold’s performance while those bearish on the shiny metal have reveled in its stagnation, saying that gold’s status as a safe haven is over.
What is behind gold’s sluggish performance in 2012? There are several reasons, but one of the key fundamental reasons has been the lack of demand from traditionally the largest buyer of gold on the planet – India (although China will surpass it this year). India bought only 181.3 tons in the second quarter of 2012, a 2-year low, according to the London-based World Gold Council.
There are several factors at play as to why Indian demand for gold has fallen. One reason is the sharp drop in the value of its currency, the rupee, which is down by 25% versus the U.S. dollar this year. This decline has kept gold prices high in relative terms while the actual dollar value of gold was falling. Perhaps even more important has been the ‘war’ declared on gold by its central bank which has blamed all of the country’s economic ills on Indian citizens’ traditional buying of gold. In an attempt to slow down gold and silver imports, the Indian government has imposed new taxes on the purchase of these precious metals.
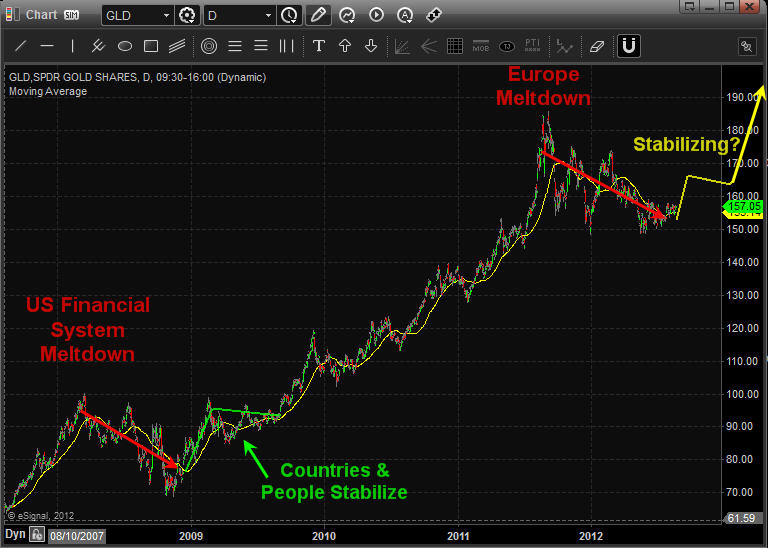
But even though demand for the precious metal is way down in India, the situation still offers hope for gold bulls. Why? Because we’ve been here before – in 2009 to be exact. In early 2009, the Indian economy and rupee tanked. Gold demand almost completely dried up. According to precious metals consultancy GFMS, Indian demand for gold in the first quarter of 2009 collapsed by 77%. For the full year GFMS said Indian consumption dropped by 19%.
Now with the Indian economy slowing to its weakest growth rate in nearly a decade and the rupee falling, we are seeing a replay of 2009. The monsoon season has been poor, hitting farmers – among the biggest buyers of gold – hard. Gold prices have hit a record high in rupee terms, and India is expected to purchase, as forecast by the World Gold Council, only 750 tons of gold, down 25% from 2011 levels. Meanwhile, the WGC forecasts that China will buy 850 tons of gold this year.
Investors should pay heed to the clues that recent history is giving us. The drop in Indian demand is simply a cyclical phenomenon due to the lousy state of the Indian economy. It will recover eventually. And when it does, look out for the fireworks from renewed Indian demand for gold added to the Chinese demand. In 2010, as pent-up demand for gold was unleashed, Indian gold consumption soared 74% to a record high of 1,006 tons according to GFMS.
Gold bulls surely hope we see something similar in 2013 and that is exactly what I talked about last week based around gold miner stocks and also what Dave Banister’s recent gold forecast was about at TheMarketTrendForecast.com sees in 2013.
Gold Chart Showing 2009 Collapse and Outcome and Current Gold Price Analysis:
Gold Trading & Investing Conclusion:
In short, gold and gold stocks have a lot of work to do before they truly breakout into the next major leg higher. I feel we are nearing that point and they may have bottomed already. Starting a small long position to scale in I think is a safe play. But I would only add more once the trend actually turns up and shows strength in terms of price and volume action.
If you would like to get my weekly analysis on precious metals and the board market be sure to join my free newsletter at www.TheGoldAndOilGuy.com
Chris Vermeulen


