Q1 GDP Data Will Likely Mask True Global Economic Future, Part II
This portion of our continued research into the Covid-19 virus event, one of the greatest disruptions to the global economy over the past 50+ years, concludes in this article. In Part I of this article, we highlighted how price factors and economic data continue to suggest the US and the global stock market will likely attempt to retest recent lows or fall further, as the extent of the virus event continues to play out. In this second portion, we’ll highlight some of this data and present the opposite aspect of the technical/data-driven research we’ve been providing to you.
Recently, something very important has happened in the US stock market – a breakout of sorts. The weakness we expected to see last week prior to the new $500 billion in new stimulus appeared to end this past week. Not only have the markets opened a bit higher this week, but they have continued to push higher over the past 3+ days. From a technical standpoint, as long as the support channels and current trends do not falter, the US stock market may continue to push higher before breaking this uptrend.
Before we continue, be sure to opt-in to our free market trend signals
before closing this page, so you don’t miss our next special report!
NASDAQ 100 DAILY CHART
This NASDAQ 100 Daily chart highlights the upside price trend that originated a bottom just as the US Fed initiated a massive stimulus program. Weakness in the market, from a technical perspective, is still the overall trend because of the move away from the February highs. At this point, even if the markets continue to rally, we would need to see a substantially higher price move to establish a new bullish trend. Yet, as long as price stays above the RSI price channel and the relatively low price channel on this chart, the upside potential is higher than the downside price trend we have been predicting.

SPY DAILY CHART
This SPY Daily chart highlights the same type of setup. We can easily see the minor rotation in price last week which prompted us to issue a warning that price may be turning lower near key Fibonacci levels. Yet, early this week stock prices pushed higher – even as far weaker global economic data was published. As long as this upward trend holds, price should continue to move higher. If it breaks below these price channels we’ve highlighted on this chart – look out below.

At this point, it appears the market is more about a battle between the US Fed and the global central bankers dumping capital into the market to prevent a greater price collapse vs. the data that is starting to support a global economic collapse that may be bigger than the 2008-09 credit crisis. Currently, it appears global traders and investors are banking on the central bank’s capacity to pour capital into the markets to suppress risks that appear to be growing.
The next series of charts highlight the US economic data as we are just entering a reporting period that reflects the contraction in the US and global economies. Pay attention to this data and the scope of the collapse compared to the 2008-09 crisis event.
REDBOOK RETAIL SALES INDEX (WOW)
This first chart is the Redbook Retail sales index (WoW) data. The collapse this week and last is far greater than the lowest levels in 2008~09.

RICHMOND MANUFACTURING INDEX
This next chart is the Richmond Manufacturing Index – again, the newest data is near twice as deep as the 2008-09 credit crisis levels at their deepest levels. Remember, we are just starting to see the data from the Covid-19 virus event.

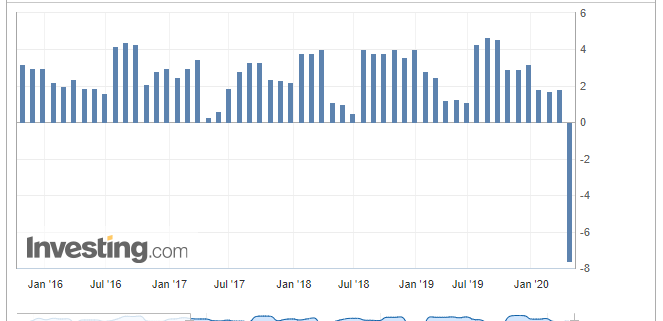
US QUARTERLY GDP DATA
This next chart is the US Quarterly GDP data. The -4.8% level is deep, but still a bit away from the -6.3% level that happened in the 2008-09 credit crisis. Yet, we believe the Q2 GDP data could offer a number below -8~10%.

PENDING HOME SALES CHART
This Pending Home Sales chart confirms a very broad contraction in home buying activity. In the midst of the 2008-09 crisis, this data printed a -29.9% data point in July 2010 – well after the bottom in the markets had completed. We believe the next few months will present even deeper sales data.

REAL CONSUMER SPENDING
Real consumer spending has collapsed. Consumer engagement makes up a large portion of all global GDP numbers. As long as consumers stay away from normal activities, the global GDP levels will continue to contract.

CONCLUDING THOUGHTS:
From a technical standpoint, at this point, as long as price continues to track within the upward sloping price trend, the bullish trend may continue for a bit longer. Once price breaks below this channel though, look out below.
Our longer-term price modeling systems continue to suggest price is still in a Bearish price trend and this move is a bullish price recovery in a bearish price trend. Time will tell if the markets have enough resilience to push higher even further. We believe the data is pointing to a very real potential for a new bearish price trend to emerge.
As a technical analyst and trader since 1997, I have been through a few bull/bear market cycles in stocks and commodities. I believe I have a good pulse on the market and timing key turning points for investing and short-term swing traders. 2020 is an incredible year for traders and investors. Don’t miss all the incredible trends and trade setups.
Subscribers of my Active Swing Trading Newsletter had our trading accounts close at a new high watermark. We not only exited the equities market as it started to roll over in February, but we profited from the sell-off in a very controlled way with TLT bonds for a 20% gain. This week we closed out SPY ETF trade taking advantage of this bounce and entered a new trade with our account is at another all-time high value.
Ride my coattails as I navigate these financial markets and build wealth while others watch most of their retirement funds drop 35-65% during the next financial crisis.
Just think of this for a minute. While most of us have active trading accounts, what is even more important are our long-term investment and retirement accounts. Why? Because they are, in most cases, our largest store of wealth other than our homes, and if they are not protected during the next bear market, you could lose 25-50% or more of your net worth. The good news is we can preserve and even grow our long term capital when things get ugly like they are now and ill show you how and one of the best trades is one your financial advisor will never let you do because they do not make money from the trade/position.
If you have any type of retirement account and are looking for signals when to own equities, bonds, or cash, be sure to become a member of my Passive Long-Term Investing Signals which we issued a new signal for subscribers.
Chris Vermeulen
Chief Market Strategies
Founder of Technical Traders Ltd.

