Chris sits down with Kevin Wadsworth and Patrick Karim from Northstarbadcharts to discuss the next big move for Gold, Silver, Commodities, and more. Looking at the daily chart of gold, we can see that gold is popping, and we actually have a sell signal. Gold is likely to continue struggling until the stock market puts a bottom. Typically gold will pull back in a bear market, though it is usually one of the first to recover.
Commodities are the cheapest they have ever been in comparison to the S&P 500. The last time we approached this level was backing early 2000. It was at this point that gold put in a bottom and started a massive run. Will this relationship repeat itself? Could this be the beginning of a super-cycle for commodities?
Overall, we are just starting what could be a multi-month complacency rally in the stock market. Gold and silver should hold their ground which is ideally what we want. For all we know, this market is going to roll over thus, we are actively managing positions. The stock market is in stage 3, which means it is very difficult to trade. The opportunity is in stage 2 or stage 4 decline when there is a trend.
Chris also delves into the changes that must be made when living, trading, and investing through a bear market. The old Buy-&-Hold strategy is no longer the safe haven it once was. Instead, stops need to be tightened up, profits taken early, and capital must be protected. The average bear market can delay retirement for 3-7 years or can greatly affect those who are already retired. It’s time to look at strategies that will help consistently grow your portfolio.
TO LEARN MORE ABOUT THE NEXT BIG MOVE FOR GOLD, SILVER, AND COMMODITIES, WATCH THE VIDEO
TO EXPLORE THE Total ETF Portfolio, PLEASE VISIT US AT The technical traders. You’vE GOT MORE TO GAIN THAN TO LOSE WHEN SEEKING INFORMATION!
Disclaimer: None of this material is meant to be construed as investment advice. It is for education and entertainment purposes only. The video is accurate as of the posting date but may not be accurate in the future.
http://www.thegoldandoilguy.com/wp-content/uploads/2014/11/tgaoglogo.png00adminhttp://www.thegoldandoilguy.com/wp-content/uploads/2014/11/tgaoglogo.pngadmin2022-08-24 09:52:092022-08-24 09:52:11Another Big move for gold, Silver, and Commodities – Video
Chris Vermeulen of TheTechnicalTraders sits down with David Lin, Anchor for Kitco News, to discuss new stock market buy signals and the complacency rally to come. Looking at the broad stock market, we can see a complacency rally that is ready to start – if it hasn’t already. This is a great opportunity for potential trades that can last several weeks or months.
We are in that phase right now where shorter-term investing in growth stocks should come back to life. Based on the weekly chart for the S&P 500, our long-term investing signals are in red, meaning we are technically in a long-term downtrend. This complacency rally is thus a counter-trend rally affecting shorter-term investing. To protect capital in this environment, profit targets and exit stops have been tightened up. As we can see this market continue to rally for several weeks, potentially several months, it pays to be conservative.
Chris goes into a detailed explanation of how he sees the markets as a technical trader. Get a closer look at what our subscribers already know about how the strategies at TheTechnicalTraders.com can protect your capital and, at the same time, conservatively grow your accounts.
Overall, if we are going into a true complacency rally for the stock market, gold and miners should perform really well. During this phase, they tend to become market leaders.
TO LEARN MORE ABOUT NEW BUY SIGNALS AND COMPLACENCY RALLY, WATCH THE VIDEO
TO EXPLORE THE Total ETF Portfolio, PLEASE VISIT US AT The Technical Traders. YOU’VE GOT MORE TO GAIN THAN TO LOSE WHEN SEEKING INFORMATION!
Disclaimer: None of this material is meant to be construed as investment advice. It is for education and entertainment purposes only. The video is accurate as of the posting date but may not be accurate in the future.
http://www.thegoldandoilguy.com/wp-content/uploads/2014/11/tgaoglogo.png00adminhttp://www.thegoldandoilguy.com/wp-content/uploads/2014/11/tgaoglogo.pngadmin2022-08-24 09:48:162022-08-24 09:48:19New Stock Market Buy Signals In A Complacency Rally – Video
In the trader tip video below, Chris explores an opportunity appearing on the Crude Oil ETF USO chart in the energy sector.
Looking at the daily chart, the 200-day moving average is showing as a major level of support since early 2021. Narrowing in on the shorter-term price action, crude oil has gone through a strong reversal pattern. A bull flag has formed that is pointing to higher prices. Using the Fibonacci extension, we can gauge that a 10% move to the upside is possible for USO ETF.
This tight pattern and potential upside target could play out over the next few trading session, or it could take a couple of weeks to unfold.
TO LEARN MORE ABOUT THE USO TRADE SETUP – WATCH THE VIDEO
Subscribers: Please let us know what you would like to learn, and we will add it to the roster of our weekly Technical Trader Tips!
Non-subscribers: Please enjoy these micro-lessons as a way to further your education and understanding of how a technical trader…well…trades!
TO EXPLORE THE STRATEGIES THAT CHRIS USES, PLEASE VISIT THE TECHNICAL TRADERS. YOU’VE GOT MORE TO GAIN THAN TO LOSE WHEN SEEKING INFORMATION!
Disclaimer: None of this material is meant to be construed as investment advice. It is for education and entertainment purposes only. The video is accurate as of the posting date but may not be accurate in the future.
http://www.thegoldandoilguy.com/wp-content/uploads/2014/11/tgaoglogo.png00adminhttp://www.thegoldandoilguy.com/wp-content/uploads/2014/11/tgaoglogo.pngadmin2022-08-03 10:01:402022-08-03 10:01:42USO ETF – Trade Setup Of The Week – Video
Many traders are focused on Gold as price has contracted over the past 5+ weeks, and the $1700 level is being retested. This prompted my team and I to do some research related to the US Federal Reserve’s recent rate increases and how Gold has previously reacted to rising and falling interest rates.
Exploring Price Patterns Between Gold and Fed Rate Decisions
I knew from the 2008-09 Global Financial Crisis and the 2020 COVID-19 event that Gold initially moves downward as extreme selling pressures drive almost all assets lower. Yet, in both cases, Gold quickly rebounded and began to move higher within 5+ weeks after setting up a bottom.
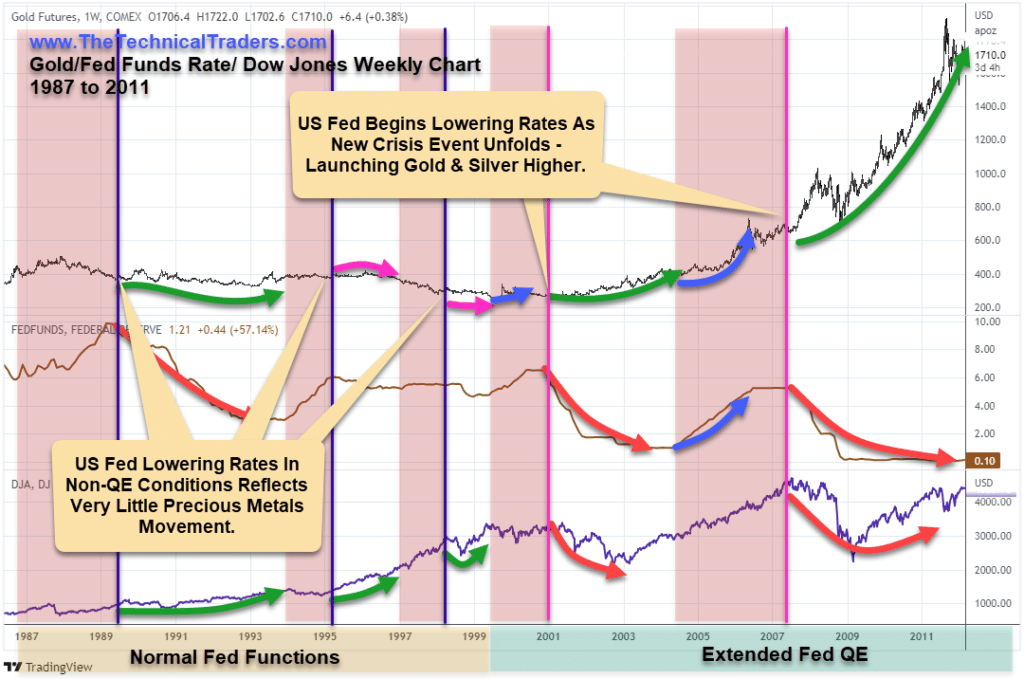
I started my research by outlining “Normal Fed Activity” and “Extended QE Fed Activity” to see if I could identify any difference in how Gold reacted to fear and uncertainty in these phases. My thinking was that Gold would react more muted in a price range in Normal Fed Activity phases because crisis events and economic uncertainty are more muted overall. When the Fed enters an expansive QE phase, this activity is associated with a US/Global economy that requires extraordinary measures to prompt expected normal capital functions.
I quickly learned that Gold tends to stay fairly muted through Fed rate increases and decreases in the absence of Fed QE functions. Yet, I learned something even more extraordinary about how Gold trends within extended Fed QE Functions: The Two-Stage Capitulation Bottom.
The Two-Stage Gold Setup In QE Fed Activities
This unique pattern seems to be associated with extended fear related to the US Fed (and global central banks) decisions to print extended capital and provide extraordinary capital support for global equity markets and the economy. It does not appear to happen in credit contraction phases. So keep this in mind as we continue to watch global central banks navigate future economic concerns.
My belief is that extended central bank QE functions are already baked into the current Gold price pattern and will continue to drive the two-stage pattern over the next 24+ months.
Defining The Two-Stage Gold Pattern
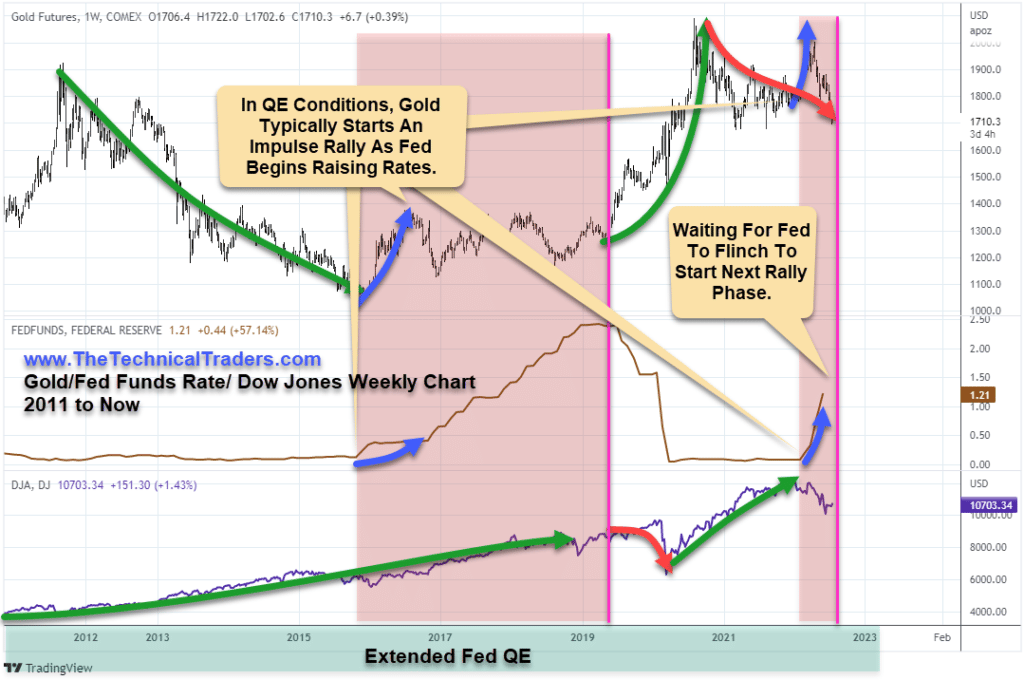
This pattern is relatively simple to understand when one considered the psychology behind the price moves. It starts with a Fed Funds Rate Increase after an extended period of lower Fed Funds Rate levels. When the Fed starts to raise rates, Gold tends to experience an almost immediate rally. Here are some recent examples:
Dates
FFR Rate Increase
Gold Increase
Oct-93 ~ Feb-96
3% ~ 6%
+22%
Apr-99 ~ Jul-99
4.75% ~ 6.5%
+33%
Apr-04 ~ Jul-06
1.0% ~ 5.25%
+95%
Oct-15 ~ Aug-19
0.13% ~ 2.42%
+46%
Mar-21 ~ Now
0.07% ~ 1.21%
+24%
Each of these Gold rally phases was accompanied by a second-stage Gold rally when the US Fed suddenly reversed direction and started lowering Fed Funds Rates. It appears this panic by the Fed sends a jolt of fear into the markets – driving Gold & Silver into a potential parabolic price trend if the conditions are right. Here are some examples.
Dates
FFR Rate Increase
Gold Increase
Oct-93 ~ Feb-96 ~ Dec-98
3% ~ 6% ~ 4.63%
+22% ~ -28%
Apr-99 ~ Jul-99 ~ Dec-03
4.75% ~ 6.5% ~ 1.0%
+33% ~ +67%
Apr-04 ~ Jul-06 ~ Sept-11
1.0% ~ 5.25% ~ 0.08%
+95% ~ +245%
Oct-15 ~ Aug-19 ~ Apr-20
0.13% ~ 2.42% ~ 0.10%
+46% ~ +49%
Mar-21 ~ Now
0.07% ~ 1.21% ~ Unknown
+24% ~ Unknown
Examples Of This Two-Stage Precious Metals Rally Pattern
The most recent examples of this two-stage precious metals rally pattern happened in 2008-09 and 1999-2001. The COVID-19 example is still a valid example, yet that setup/cycle concluded very quickly as an anomaly event.
Global Financial Crisis
In 2008-09, after the initial rally phase prompted by raising rates from Apr-04 to July-06, Gold collapsed as the 2008-09 GFC crisis unfolded. Gold quickly recovered back to near previous highs over an 18-week span after establishing a bottom. Then, Gold consolidated for 33 weeks before launching into an incredible parabolic rally phase – close to 10 months after Gold bottomed in October 2008 (see the Green Arrow Rally on the Gold Chart Below).
Recession
From 1999-2001, a similar price pattern unfolded in Gold. This time, the bottom in Gold setup in February 2001, and it took an additional 67 weeks for Gold to rally back to near recent highs before stalling and rallying further upward as the US Fed reacted to the 9/11 attacks.
Current Gold Price Action
Currently, Gold has collapsed to price levels near $1700 after trading above $2000 just a few months ago as the US Fed aggressively raised interest rates attempting to combat inflation. I’m not trying to guess if/when the Fed will change course, but I do believe Gold is poised for a very significant rally from any bottom set up by the current two-phase price pattern.
If history is any example, this current contraction in Gold and Silver is very likely a reaction to the sudden inflation crisis event and may prompt future price rally anyone’s imagination. Global central banks around the world are continuing to push QE in some form while the US Fed is attempting to raise rates. If the US Fed suddenly shifts towards more Dovish policies, I believe a new wave of fear will drive Gold higher – starting the second phase of the rally.
If the Fed raises rates one or two more times before changing policy, that would simply build more momentum for any future breakout in precious metals.
Concluding Thoughts
As long as some quantifiable measure of stimulus or QE exists throughout the US/EU/Chinese economies, I believe this expansionary two-stage cycle in Gold & Silver will continue to play out.
We have already experienced the early rally phase associated with the initial Fed rate increase. Now, we are in the contraction price phase where a bottom will set up – which may take many weeks or months still. We are waiting for the Fed to “flinch” and begin to decrease rates. That will start the new bullish price phase for Gold and Silver – and possibly send us into another parabolic price phase.
HOW WE CAN HELP YOU LEARN TO INVEST CONSERVATIVELY
At TheTechnicalTraders.com, my team and I can do these things:
Safely navigate the commodity and crude oil trend.
Reduce your FOMO and manage your emotions.
Have proven trading strategies for bull and bear markets.
Provide quality trades for investing conservatively.
Tell you when to take profits and exit trades.
Save you time with our research.
Proved above-average returns/growth over the long run.
Have consistent growth with low volatility/risks.
Make trading and investing safer, more profitable, and educational.
We invite you to join our group of active traders who invest conservatively together. They learn and profit from our three ETF Technical Trading Strategies. We can help you protect and grow your wealth in any type of market condition. Click on the following link to learn how: www.TheTechnicalTraders.com.
Chris Vermeulen Founder & Chief Market Strategist TheTechnicalTraders.com
http://www.thegoldandoilguy.com/wp-content/uploads/2014/11/tgaoglogo.png00adminhttp://www.thegoldandoilguy.com/wp-content/uploads/2014/11/tgaoglogo.pngadmin2022-08-03 09:28:522022-08-03 09:28:53Do Fed Rate Decisions Affect The Price Patterns For Gold?
This week Brian sets his eyes on Ford, ticker symbol F. Through repeated economic and political cycles during their history, Ford has come out the other side in good shape.
Though there have been supply chain issues and general worry about the overall economy, the Ford chart is looking good ahead of the earnings report. Rather than purchasing shares, consider the possibility of selling some puts that go out for about a month. This will allow time to collect some premiums to offset the cost basis.
If you want to be a bit more conservative, you can look at the charts after the earnings report comes out before considering a purchase.
TO LEARN MORE ABOUT THE FORD TRADE SETUP – WATCH THE VIDEO
Subscribers: Please let us know what you would like to learn and we will add it to the roster of our weekly Technical Trader Tips!
Non-subscribers: Please enjoy these micro-lessons as a way to further your education and understanding of how a technical trader…well…trades!
TO EXPLORE THE STRATEGIES THAT BRIAN USES, PLEASE VISIT THE TECHNICAL TRADERS. YOU’VE GOT MORE TO GAIN THAN TO LOSE WHEN SEEKING INFORMATION!
Disclaimer: None of this material is meant to be construed as investment advice. It is for education and entertainment purposes only. The video is accurate as of the posting date but may not be accurate in the future.
http://www.thegoldandoilguy.com/wp-content/uploads/2014/11/tgaoglogo.png00adminhttp://www.thegoldandoilguy.com/wp-content/uploads/2014/11/tgaoglogo.pngadmin2022-08-03 09:24:512022-08-03 09:24:52Ford (F) – Trade Setup Of The Week – Video
In the trader tip video, Chris talks about the US Dollar Index ETF UUP. We have been talking about the UUP for the past couple of months which has been one of the strongest currencies. UUP has also been trending higher while the rest of the stock and bond market has been falling.
We also talked about the BIL last week which is the one to three-year T – Note. It is pretty much a cash position. You can earn a little bit of interest while sitting in cash. Overall, those really have been the two major plays. We’ve been in these plays, watching the cash and the dollar market really since February.
TO LEARN MORE ABOUT THE UUP TRADE SETUP – WATCH THE VIDEO
Subscribers: Please let us know what you would like to learn and we will add it to the roster of our weekly Technical Trader Tips!
Non-subscribers: Please enjoy these micro-lessons as a way to further your education and understanding of how a technical trader…well…trades!
TO EXPLORE THE STRATEGIES THAT CHRIS USES, PLEASE VISIT THE TECHNICAL TRADERS. YOU’VE GOT MORE TO GAIN THAN TO LOSE WHEN SEEKING INFORMATION!
Disclaimer: None of this material is meant to be construed as investment advice. It is for education and entertainment purposes only. The video is accurate as of the posting date but may not be accurate in the future.
http://www.thegoldandoilguy.com/wp-content/uploads/2014/11/tgaoglogo.png00adminhttp://www.thegoldandoilguy.com/wp-content/uploads/2014/11/tgaoglogo.pngadmin2022-07-20 09:07:442022-07-20 09:07:46UUP ETF – Trade Setup Of The Week Video
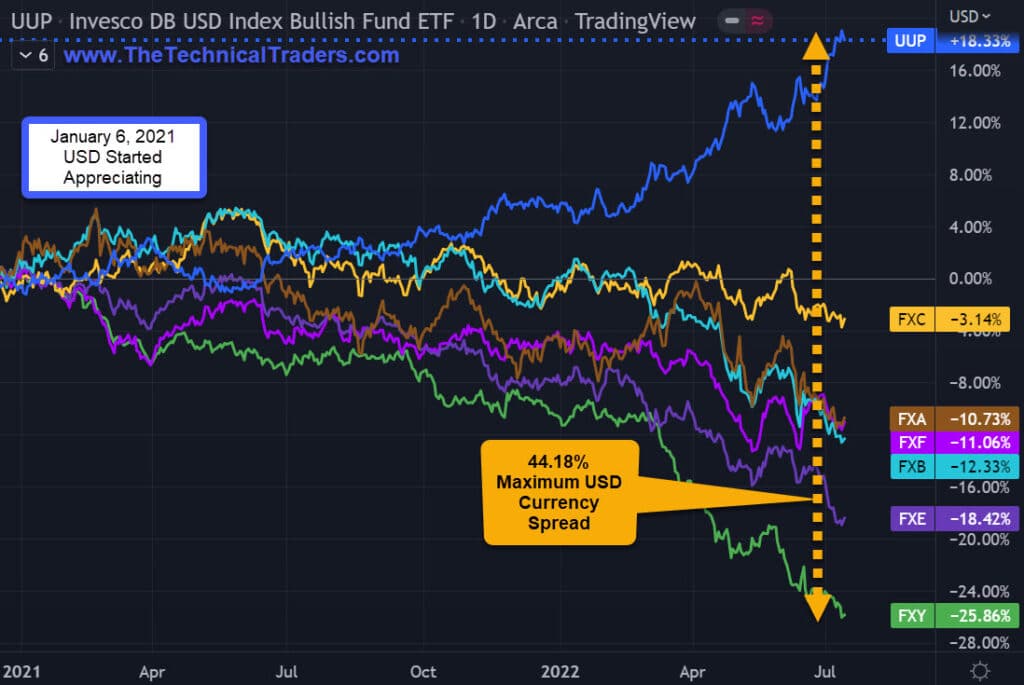
The U.S. Dollar uptrend has been going on since January 6th, 2021:
U.S. Dollar is at a 14-year high
2020-2022 U.S. Presidential Cycle: USD appreciated +18.33% to date
2016-2020 U.S. Presidential Cycle: USD depreciated – 12.80%
2012-2016 U.S. Presidential Cycle: USD appreciated +37.20%
International investors interested in buying U.S. real estate are having issues as converting their country’s currency into the USD significantly reduces the amount of real estate they can purchase.
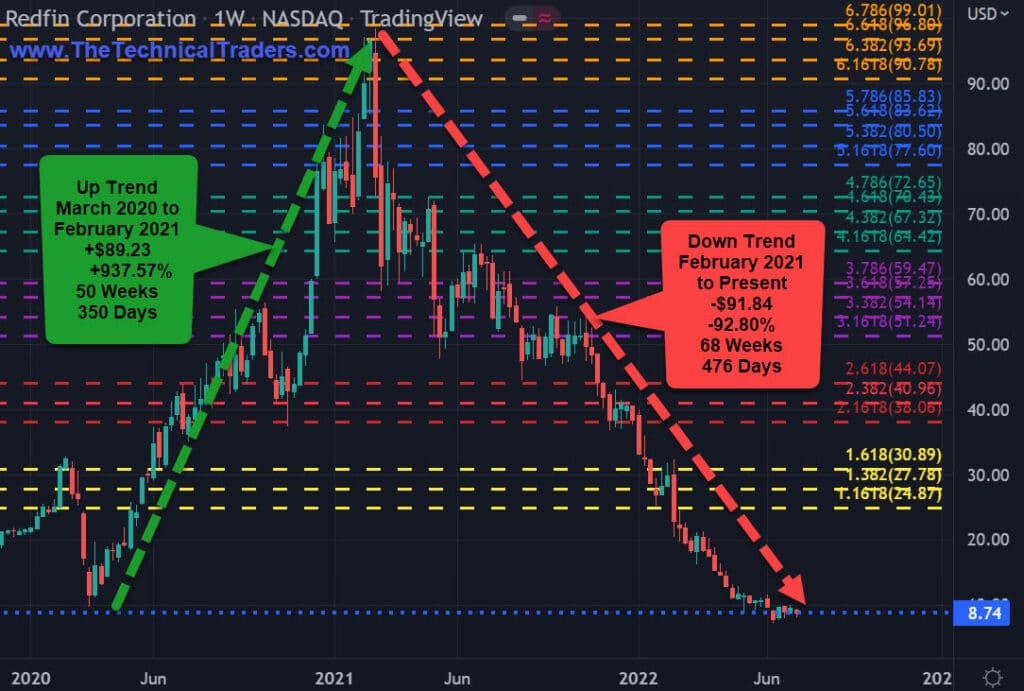
According to an article by Patrick Clark of Bloomberg on July 11, 2022, “Across the country, nearly 60,000 homes sales fell through according to an analysis by Redfin Corp.” “That was equal to 15% of transactions that went into a contract that month, the highest share of cancellations since April 2020, when early Covid lockdowns froze the housing market.”
Redfin NASDAQ RDFN, which offers a full-service real estate brokerage discounted service, has suffered a staggering loss of -92.80% in its stock price after putting in its February 2021 high.
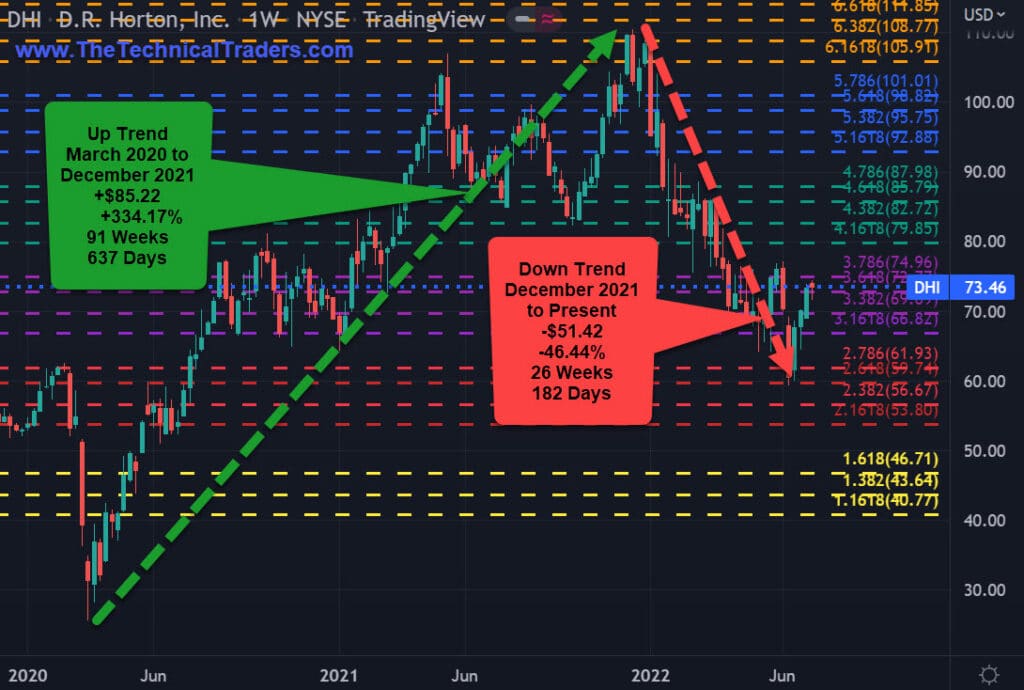
D.R. Horton NYSE DHI, America’s largest homebuilder as of January 20, 2022, responsible for 71,292 home closings totaling $21.5 billion in revenue for 2021, has dropped -46.44% from its high.
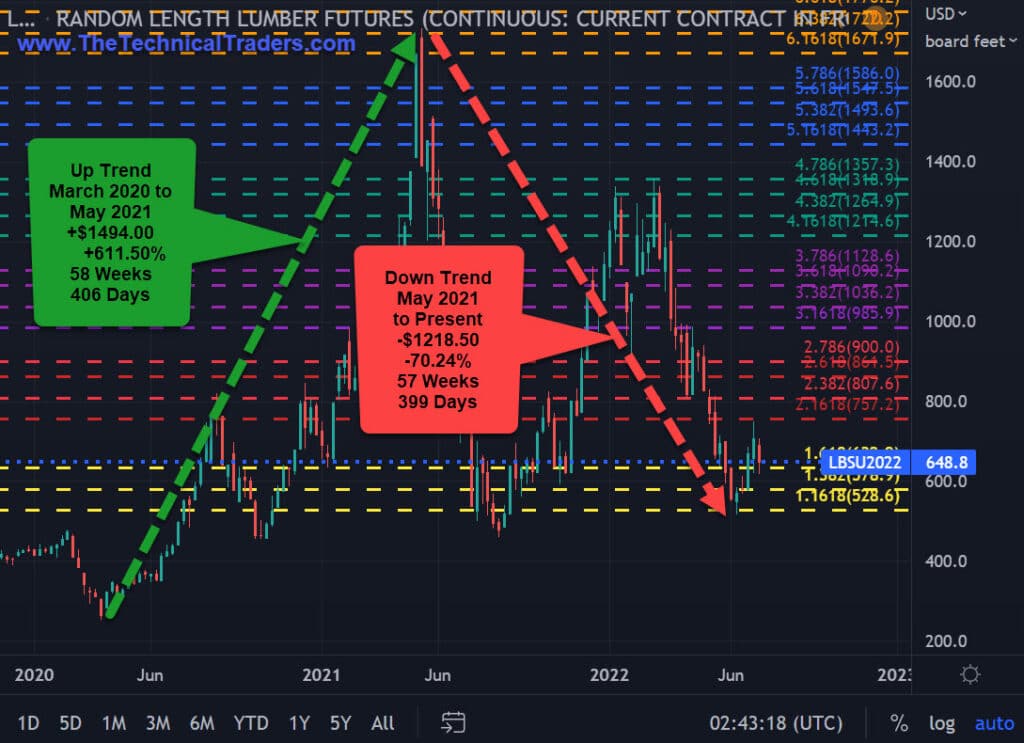
Other housing-related commodity markets such as copper -38.09% and lumber -70.24% are also signaling a recession.
U.S. DOLLAR +18.33%
UUP +18.33% U.S. Dollar ETF
FXC -3.14% Canadian Dollar ETF; Spread CAD to the USD 21.47%
FXA -10.73% Australian Dollar ETF; Spread AUD to the USD 29.06%
FXF -11.06% Swiss Franc ETF; Spread CHF to the USD 29.39%
FXB -12.33% British Pound ETF; Spread GBP to the USD 30.66%
FXE -18.42% Eurodollar ETF; Spread EUD to the USD 36.75%
FXY -25.86% Japanese Yen ETF; Spread JPY to the USD 44.18%
INVESCO DB USD INDEX BULLISH FUND ETF • UUP • ARCA • DAILY
The New Market Wizards by Jack D Schwager (www.Amazon.com) is packed with insights from successful traders who have shared their wisdom based on firsthand trading experiences. The following snippets are from his super trader interviews that seem relevant for today’s market:
Randy McKay:
“I realized that prices moved based on the psychology of the people who were trading.” “You could actually see anxiety, greed, and fear in the markets.”
“I never try to buy a bottom or sell a top.” “You don’t want to have a position before a move has started.” “You want to wait until the move is already underway before you get into the market.”
“When I get hurt in the market, I get the hell out.” “It doesn’t matter at all where the market is trading.” “I just get out, because I believe that once you’re hurt in the market, your decisions are going to be far less objective than they are when you’re doing well.” “If you stick around when the market is severely against you, sooner or later they’re going to carry you out.”
“I basically learned that you must get out of your losses immediately.” It’s not merely a matter of how much you can afford to risk on a given trade, but you also have to consider how many potential future winners you might miss because of the effect of the larger loss on your mental attitude and trading size.”
LEARN FROM OUR TEAM OF SEASONED TRADERS
In today’s market environment, it’s imperative to assess our trading plans, portfolio holdings, and cash reserves. As professional technical traders, we always follow the price. At first glance, this seems very straightforward and simple. But emotions can interfere with a trader’s success when they buck the trend (price). Remember, our ego aside, protecting our hard-earned capital is essential to our survival and success.
Successfully managing our drawdowns ensures our trading success. The larger the loss, the more difficult it will be to make up. Consider the following:
A loss of 10% requires an 11% gain to recover.
A 50% loss requires a 100% gain to recover.
A 60% loss requires an even more daunting 150% gain to simply break even.
Recovery time also varies significantly depending upon the magnitude of the drawdown:
A 10% drawdown can typically be recovered in weeks to a few months.
A 50% drawdown may take many years to recover.
Depending on a trader’s age, they may not have the time to wait nor the patience for a market recovery. Successful traders know it’s critical to keep drawdowns with reason, as most have learned this principle the hard way.
We invite you to join our group of active traders who invest conservatively together. They learn and profit from our three ETF Technical Trading Strategies. We can help you protect and grow your wealth in any type of market condition. Click on the following link to learn how: www.TheTechnicalTraders.com.
Chris Vermeulen Founder & Chief Market Strategist TheTechnicalTraders.com
http://www.thegoldandoilguy.com/wp-content/uploads/2014/11/tgaoglogo.png00adminhttp://www.thegoldandoilguy.com/wp-content/uploads/2014/11/tgaoglogo.pngadmin2022-07-20 09:05:462022-07-20 09:05:49Will U.S. Dollar Uptrend Slow Foreign Real Estate Investment In The US?
Global market risks have shifted dramatically over the past 90+ days. It almost seems as though the global markets turned 180 degrees overnight, generally going from moderately soft monetary policies to very extreme monetary policies and conditions. This sudden shift caught many traders and investors off guard and resulted in -20% to -25% losses for many.
The driving forces behind this sudden shift are inflation and excess capital (M2) because of nearly a decade of near-zero US interest rates. Much of the excess capital created over the past decade has been deployed into global equities, infrastructure, and various speculative instruments (art, homes, cryptos, collectibles, and others). However, without a doubt, the recent burst of inflation is also a result of COVID restrictions. Such restrictions reduced supply capabilities and the resulting interruptions of manufacturing/supply have been felt throughout the post-COVID global recovery.
Deleveraging Capital Excesses Causing Global Assets To Unwind Faster Than US Assets
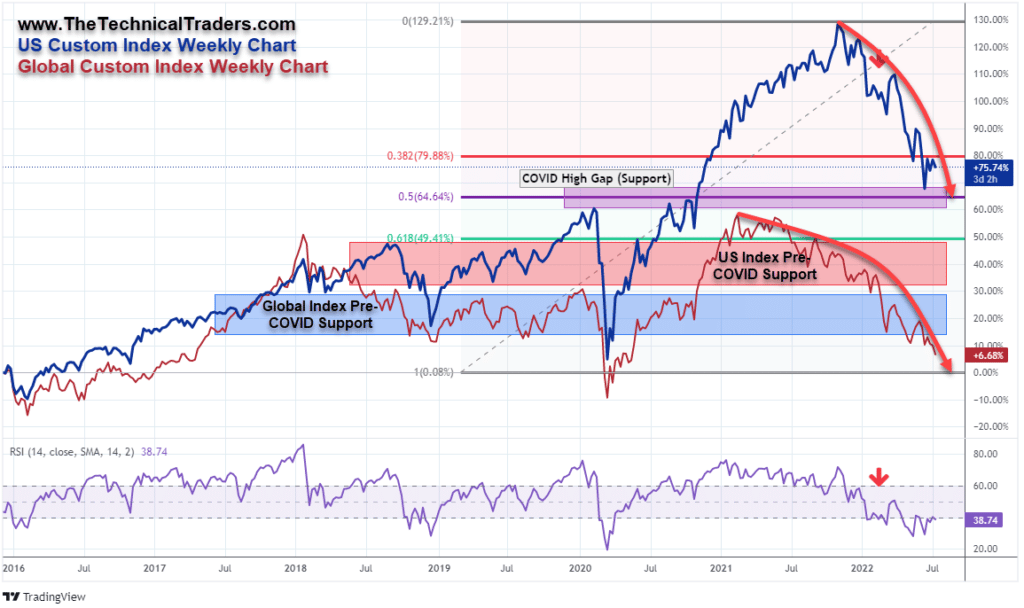
The US & Global markets have contracted by more than 25%~35%. The following Custom Global Market Index highlights the extensive devaluation in global assets compared to US assets. US assets have fallen -23% from recent highs. Global assets have fallen -32% from recent highs – and are breaking downward again.
If this overall trend continues, it is very likely that Chinese & Asian markets could lead to a global contagion event related to extended credit/debt liabilities, economic expectations (GDP/Consumers), and real asset valuations. Over the past 5+ years, I’ve published many articles showing how China/Asia was uniquely positioned to take advantage of the US easy money policies. Results from this could extend credit/debt risks far beyond reasonable expectations. Is this global inflation event driving a global devaluation of assets?
Excess Phase Peak Consumption Can Lead To Extreme Risk Events
This excess phase consumption of cheap credit prompted many nations to engage in very high-risk multi-billion dollar infrastructure projects and other excesses. The Belt-Road project is a perfect example of one nation extending billions of credit to at-risk nations to leverage cheap credit into future opportunities. As evidenced near every market peak, optimism near the peak of excess phases can be very addictive and dangerous.
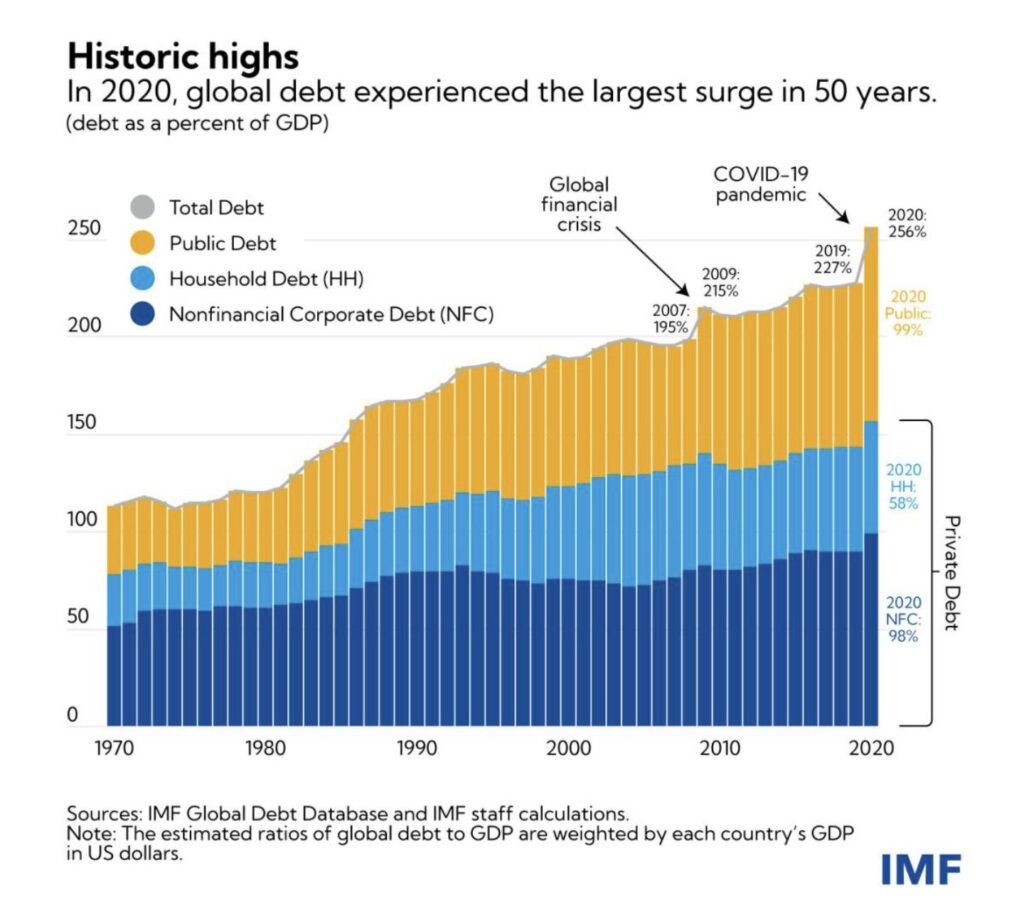
Global debt levels have skyrocketed over the past 5+ years. With the US prompting extreme easy money policies, many foreign nations extended debt levels far beyond reasonable expectations when COVID hit. The following chart from the IMF shows consumers and corporations increased debt levels at an excessively higher rate in 2020. The excessive global debt levels are now evidently working as a liability for many Asian & Emerging markets.
Protecting & Growing Wealth When Markets Are In Chaos
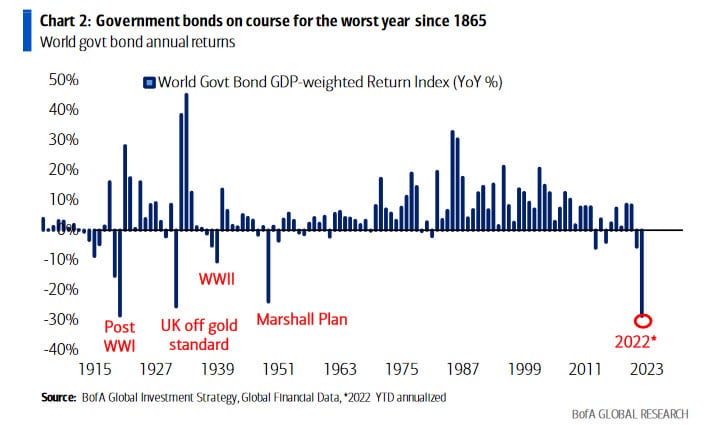
I receive many questions from investors and traders every week. Generally, the most common question is “what can I do to profit right now from what is happening throughout the world?”. The simple answer to that question is to not extend any greater risk within your portfolio than necessary.
This chart from Bank of America Investment Strategies shows how aggressively World Government Bonds are reacting to inflation and global central bank rate increases. The short story of this chart is that Bonds are pricing in very unfavorable growth and capital function conditions over the next 3 to 5+ years. World Government bonds have reached risk levels we’ve not seen since post-WWI (1918+) or the Great Depression (1930+).
Research & Technology Highlighted Risks & Opportunities
My research team and I have posted articles over the past 5+ years highlighting how global markets were taking advantage of the US monetary policy and inadvertently gorging themselves on cheap credit to address infrastructure, industrial, and consumer demand. We’ve been warning of this moment and have strategies/technology to help you protect and grow your wealth as this chaos continues.
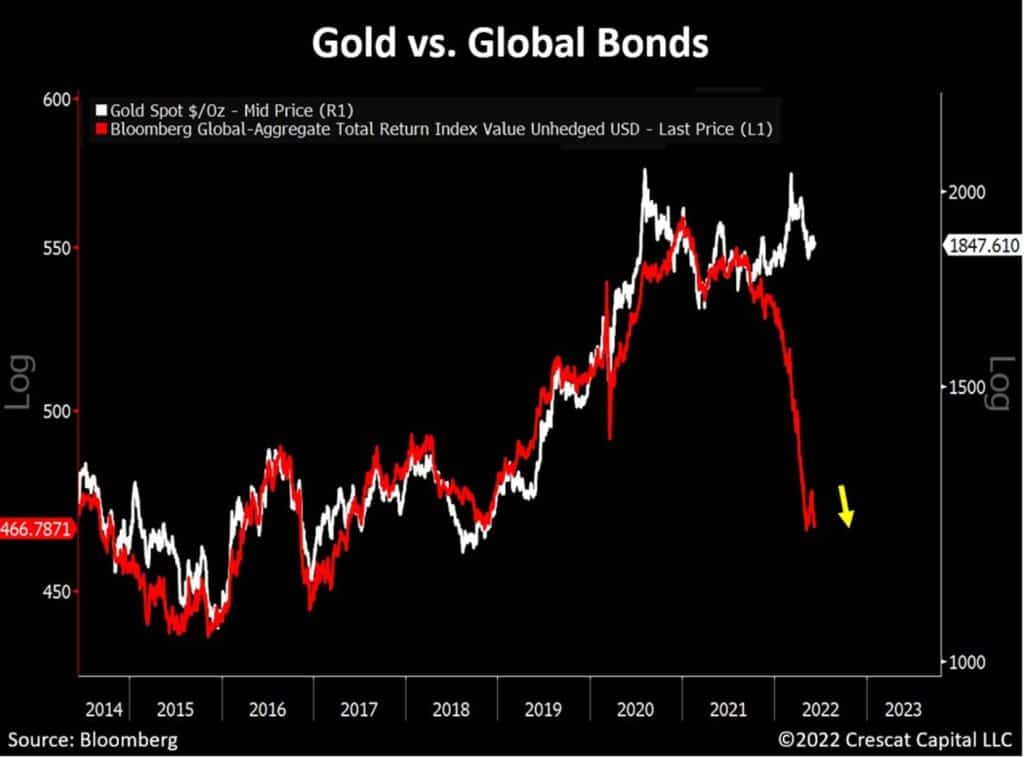
This Bloomberg Gold vs. Global Bonds chart highlights how aggressively global Bonds have adjusted to extreme risk factors. What this is telling traders/investors is that global central banks appear to have very few tools to efficiently manage inflationary trends – and these reflect in extreme risk factors in global bonds. Quickly raising rates to combat inflation trends may aggressively compound risk factors at this point. This chart is clearly showing us that global risk factors have never been this extreme, or disconnected, over the past 8+ years.
I suggest taking immediate action while this market chaos continues. Even though it may seem frightening, this is one of the best opportunities for you to take control of your assets, and also learn how to better protect and grow your wealth while the markets deleverage and resettle. Eventually, a market bottom will confirm, and global assets will begin another rally phase. Before this happens, though, all traders/investors need to begin taking immediate actions/steps to manage, protect and grow their wealth as efficiently as possible.
WHAT STRATEGIES CAN HELP YOU NAVIGATE THE CURRENT MARKET TRENDS?
Learn how we use specific tools to help us understand price cycles, set-ups, and price target levels in various sectors. Also, learn how we identify strategic entry and exit points for trades. Over the next 12 to 24+ months, we expect very large price swings in the US stock market. The markets have begun to transition away from the continued central bank support rally phase. A revaluation phase has started as global traders attempt to identify the next big trends. Precious Metals may start to act as a proper hedge as caution and concern begin to drive traders/investors into safe havens.
Historically, bonds have served as one of these safe havens. This isn’t proving to be the case, so if bonds are off the table, what bond alternatives are there? How can they be deployed in a bond replacement strategy?
HOW WE CAN HELP YOU LEARN TO INVEST CONSERVATIVELY
At TheTechnicalTraders.com, my team and I can do these things:
Safely navigate the commodity and crude oil trend.
Reduce your FOMO and manage your emotions.
Have proven trading strategies for bull and bear markets.
Provide quality trades for investing conservatively.
Tell you when to take profits and exit trades.
Save you time with our research.
Proved above-average returns/growth over the long run.
Have consistent growth with low volatility/risks.
Make trading and investing safer, more profitable, and educational.
We invite you to join our group of active traders who invest conservatively together. They learn and profit from our three ETF Technical Trading Strategies. We can help you protect and grow your wealth in any type of market condition. Click on the following link to learn how: www.TheTechnicalTraders.com.
Chris Vermeulen Founder & Chief Market Strategist TheTechnicalTraders.com
http://www.thegoldandoilguy.com/wp-content/uploads/2014/11/tgaoglogo.png00adminhttp://www.thegoldandoilguy.com/wp-content/uploads/2014/11/tgaoglogo.pngadmin2022-07-14 22:46:282022-07-14 22:46:30What Are The Driving Forces Behind The Shift In Global Market Risks?
Summer is here, and it’s time for a vacation. But this year, flight schedules are anything but reliable, and that new car for the road trip is probably not available at the local Toyota, Honda, Tesla, General Motors, Ford, etc dealership. Due to chip shortages and other issues, most car dealerships have little to no inventory to sell.
High inflation and rising interest rates combined with high gasoline prices are causing people to rethink or pay more attention to their monthly budget expenditures.
Furthermore, if you do decide to buy a used car, be prepared to pay top dollar. In some cases, a 3-year-old model may cost you as much as a new one. Historically autos almost always depreciate, but we are in an unusual market phenomenon where many used cars have appreciated significantly.
What about the auto company stocks themselves? Cash is looking great versus owning one of these auto brands.
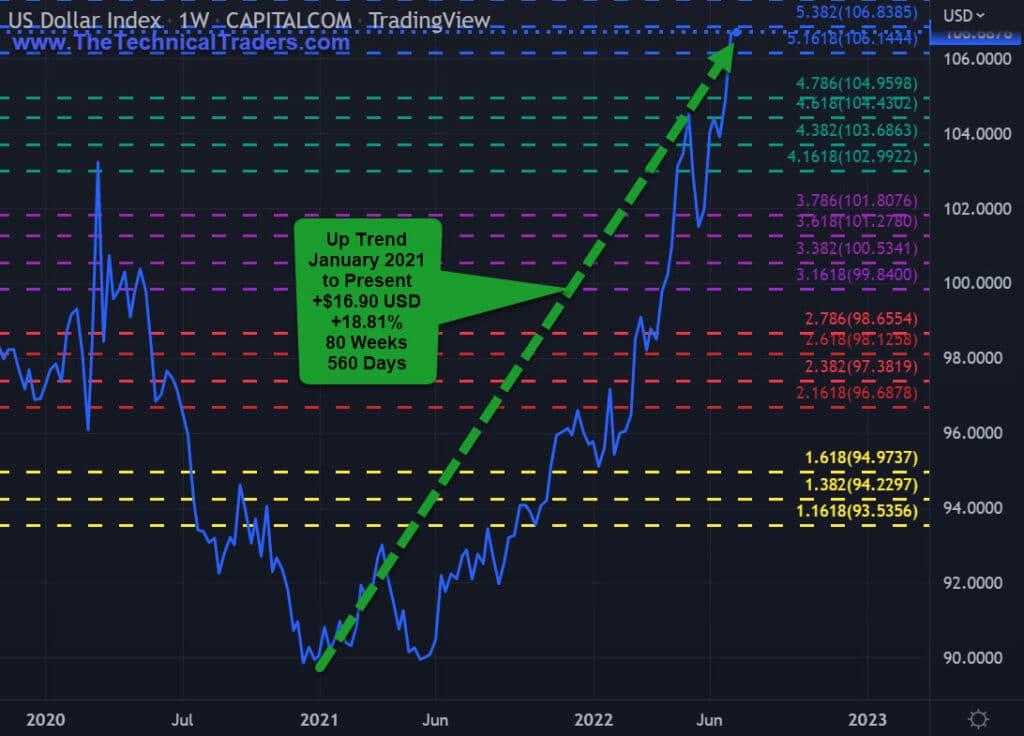
Before we motor into the auto company stocks, let’s take a quick look at cash (the U.S. Dollar).
U.S. DOLLAR +18.81%
U.S. Dollar making a new 14-year high
2020-2022 U.S. Presidential Cycle: USD appreciated +18.74% to date
2016-2020 U.S. Presidential Cycle: USD depreciated – 12.80%
2012-2016 U.S. Presidential Cycle: USD appreciated +37.20%
US DOLLAR INDEX • DXY • CAPITALCOM • WEEKLY
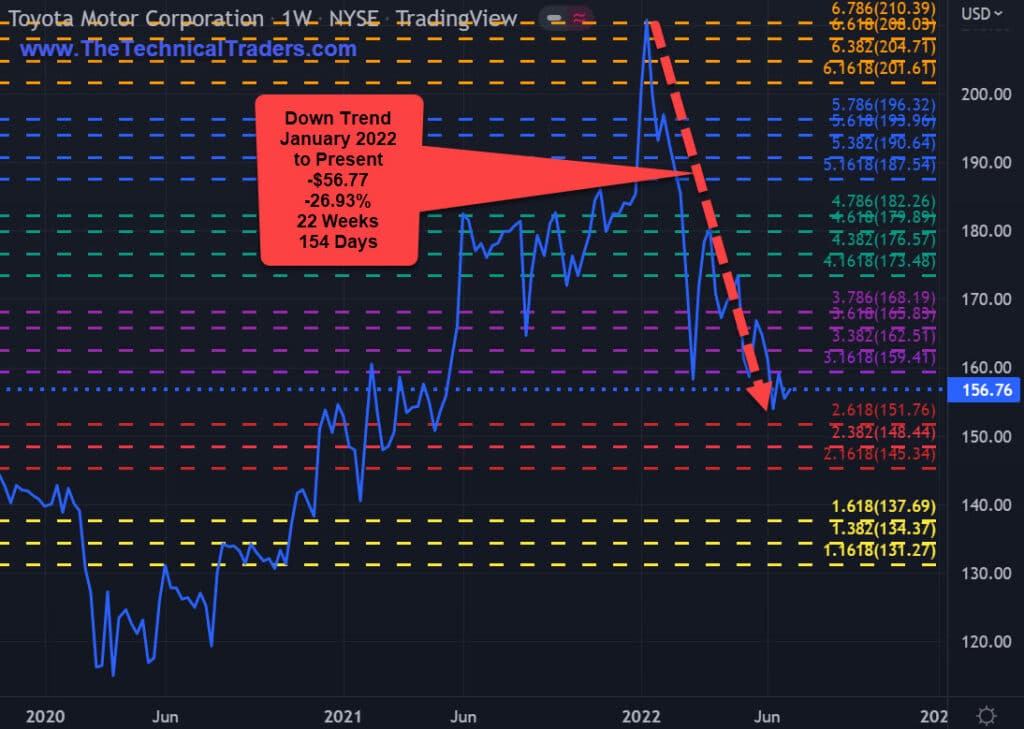
TOYOTA -26.93%
January 2022 to present
-$56.77 or -26.93%
22 weeks or 154 days down
The bear market has more room to drop; if you own it consider selling on rallies and going to cash
TOYOTA MOTOR CORPORATION • TM • NYSE • WEEKLY
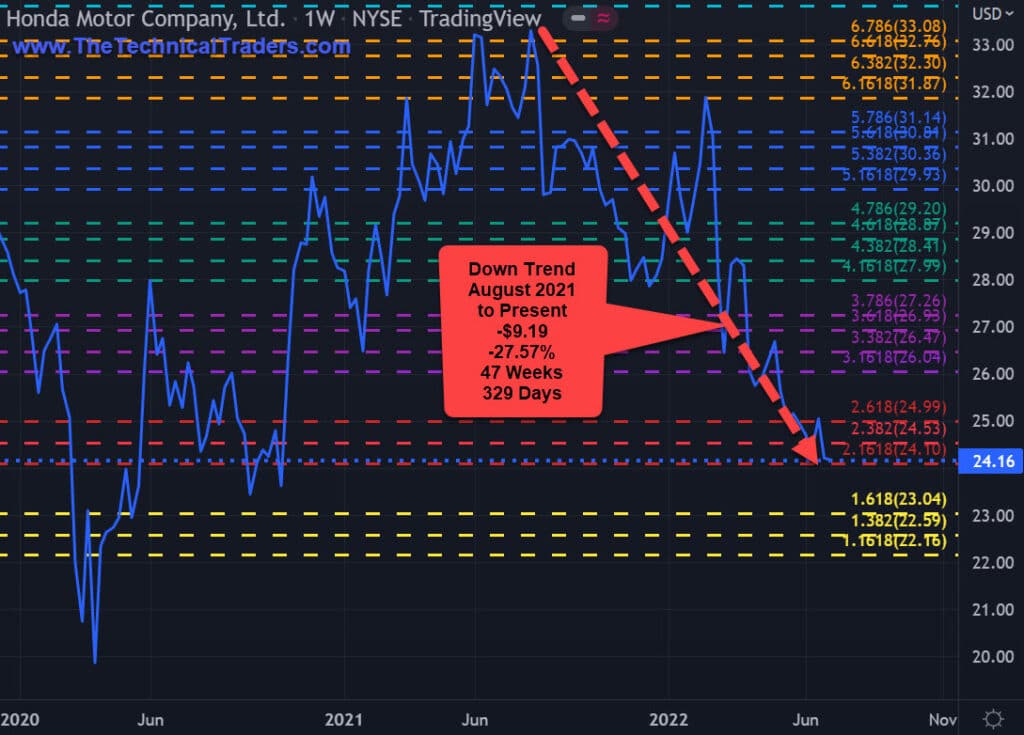
HONDA -27.57%
August 2021 to present
-$9.19 or -27.57%
47 weeks or 329 days down
The bear market has more room to drop; if you own it consider selling on rallies and going to cash
HONDA MOTOR COMPANY, LTD. • HMC • NYSE • WEEKLY
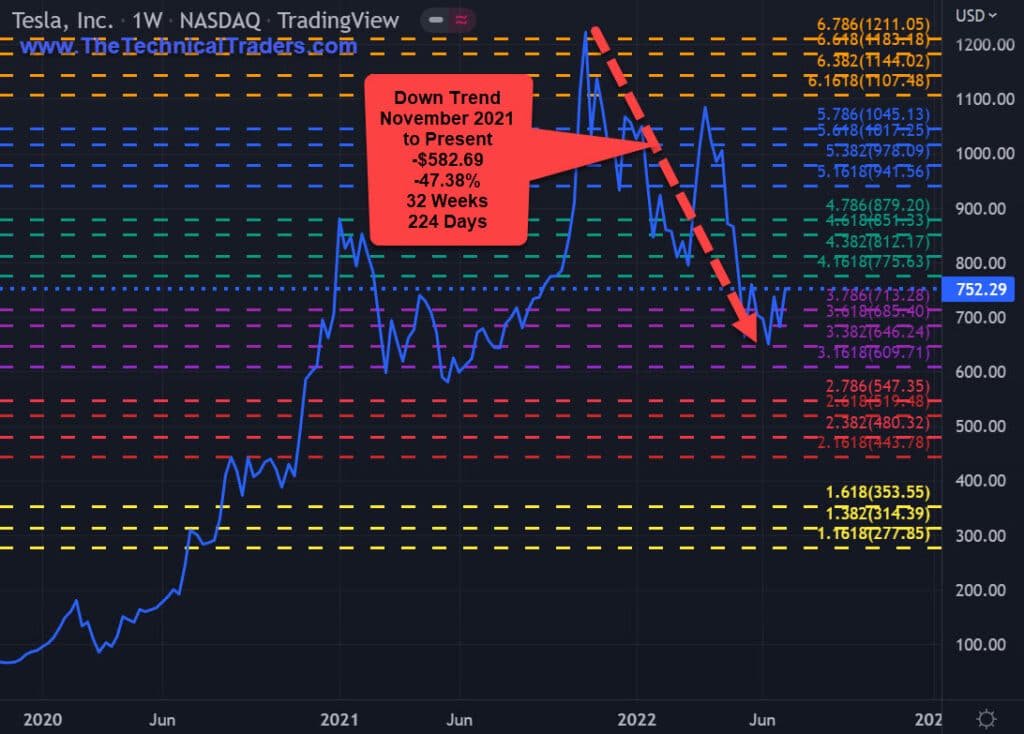
TESLA -47.38%
November 2021 to present
-$582.69 or -47.38%
32 weeks or 224 days down
The bear market has more room to drop; if you own it consider selling on rallies and going to cash
TESLA, INC. • TSLA • NASDAQ • WEEKLY
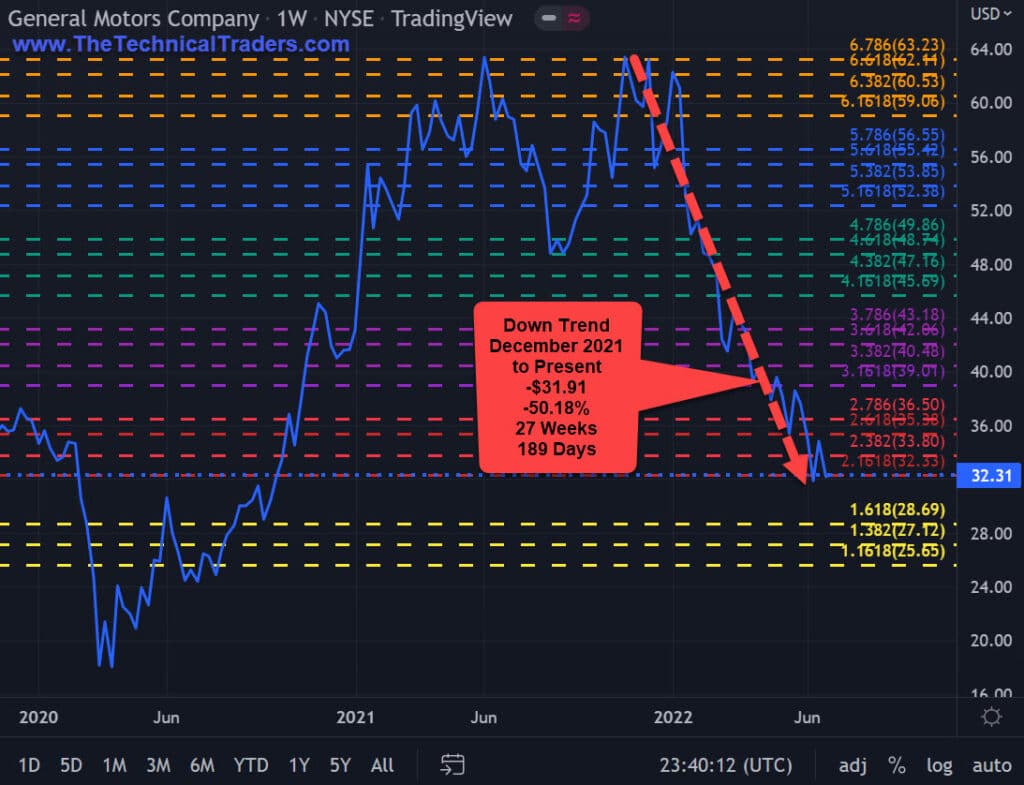
GENERAL MOTORS -50.18%
December 2021 to present
-$31.91 or -50.18%
27 weeks or 189 days down
The bear market has more room to drop; if you own it consider selling on rallies and going to cash
GENERAL MOTORS COMPANY • GM • NYSE • WEEKLY
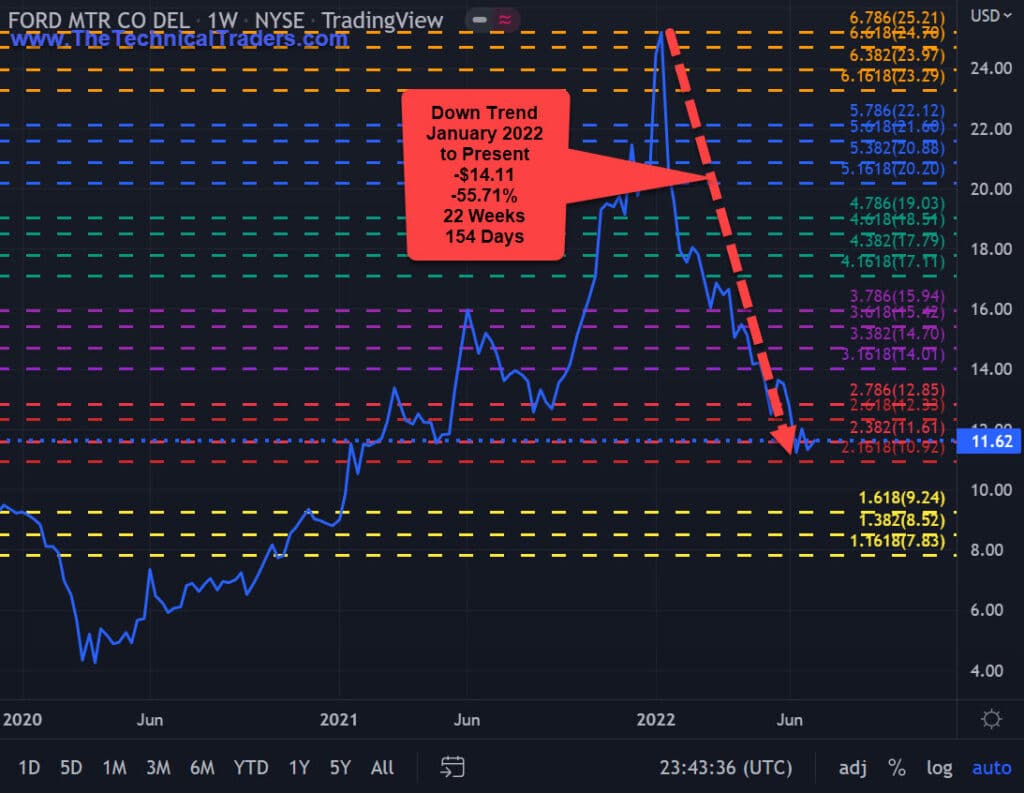
FORD -55.71%
January 2022 to present
-$14.11 or -55.71%
22 weeks or 154 days down
The bear market has more room to drop; if you own it consider selling on rallies and going to cash
FORD MOTOR COMPANY • F • NYSE • WEEKLY
VALUABLE INSIGHTS FROM SUCCESSFUL TRADERS
Market Wizards by Jack D Schwager (www.Amazon.com) is packed with insights from successful traders who have shared their wisdom based on firsthand trading experiences. The following are some of Jack Schwager’s thoughts after his first set of super trader interviews that seem relevant for today’s market:
Jack Schwager:
“Sometimes, being out of the market may be nearly as important to success as the investments made.”
“The critical lesson is that it is important not to be involved in the market when the opportunities are not there.”
“Many super traders consider risk control more important than the methodology.”
HOW WE CAN HELP YOU LEARN TO INVEST CONSERVATIVELY
At TheTechnicalTraders.com, my team and I can do these things:
Reduce your FOMO and manage your emotions.
Have proven trading strategies for bull and bear markets.
Provide quality trades for investing conservatively.
Tell you when to take profits and exit trades.
Save you time with our research.
Proved above-average returns/growth over the long run.
Have consistent growth with low volatility/risks.
Make trading and investing safer, more profitable, and educational.
We invite you to join our group of active traders who invest conservatively together. They learn and profit from our three ETF Technical Trading Strategies. We can help you protect and grow your wealth in any type of market condition by clicking on the following link: www.TheTechnicalTraders.com
Chris Vermeulen Chief Market Strategist Founder of TheTechnicalTraders.com
http://www.thegoldandoilguy.com/wp-content/uploads/2014/11/tgaoglogo.png00adminhttp://www.thegoldandoilguy.com/wp-content/uploads/2014/11/tgaoglogo.pngadmin2022-07-14 22:44:532022-07-14 22:44:55Compared To The USD, Auto Company Stocks Are On A Summer Vacation
In the trader tip video, Brian talks about the ELI LILLY ticket symbol LLY. It’s a beautiful looking chart for LLY, one that we are not seeing too many of in this bearish market. LLY recently had a breakout above the area around three twenty. One way to play this with some margin of safety would be to do a Put Vertical Credit Spread.
This is where we would be selling an out-of-the-money put below that three-twenty level. And we would want to buy a lower strike and turn this into a spread so that we can have risk on the trade. We are also looking at the 29th of July expiration, closing that trade before that earnings report on August 4th.
TO LEARN MORE ABOUT THE LLY TRADE SETUP – WATCH THE VIDEO
Subscribers: Please let us know what you would like to learn and we will add it to the roster of our weekly Technical Trader Tips!
Non-subscribers: Please enjoy these micro-lessons as a way to further your education and understanding of how a technical trader…well…trades!
TO EXPLORE THE STRATEGIES THAT BRIAN USES, PLEASE VISIT THE TECHNICAL TRADERS. YOU’VE GOT MORE TO GAIN THAN TO LOSE WHEN SEEKING INFORMATION!
Disclaimer: None of this material is meant to be construed as investment advice. It is for education and entertainment purposes only. The video is accurate as of the posting date but may not be accurate in the future.
http://www.thegoldandoilguy.com/wp-content/uploads/2014/11/tgaoglogo.png00adminhttp://www.thegoldandoilguy.com/wp-content/uploads/2014/11/tgaoglogo.pngadmin2022-07-14 22:42:592022-07-14 22:43:01LLY ETF – Trade Setup Of The Week Video